6039 Skipping Way · Somerset, TX
Flood risk 1/10 · Minimal
- FEMA flood zone
- X (unshaded)
- Chance of flooding over 30 yrs
- 0.0%
- Est. flood insurance / yr
- $507 – $1,088
Fire risk 5/10 · Moderate
- Est. fire insurance / yr
- $1,222 – $2,270
Heat risk 8/10 · Major
- Hot days now (above 109°F)
- 4 days/yr
- Hot days in 30 yrs
- 11 days/yr
Wind risk 8/10 · Major
- Chance of severe wind over 30 yrs
- 80.0%
Air-quality risk 1/10 · Minimal
- Unhealthy air days now
- 0 days/yr
- Unhealthy air days in 30 yrs
- 0 days/yr
Risk factors via First Street. Map © Google.
Why this score? — see what drove the C grade
The composite is a weighted blend of 9 inputs, each scored 0–100. Each bar is that input's sub-score; the figure is the points it added to the 100-point composite (weight × sub-score).
- Cash flow +13.7/30.0
- ARV discount +12.9/15.0
- Appreciation +6.3/10.0
- Condition / age +5.0/5.0
- DSCR +4.1/10.0
- 1% rule +4.0/10.0
- Schools +3.4/10.0
- Livability +3.3/5.0
- Rent growth +2.5/5.0
$203,999
🖨 Deal sheet 📄 Offer letter ✓ Due diligence
Listing remarks
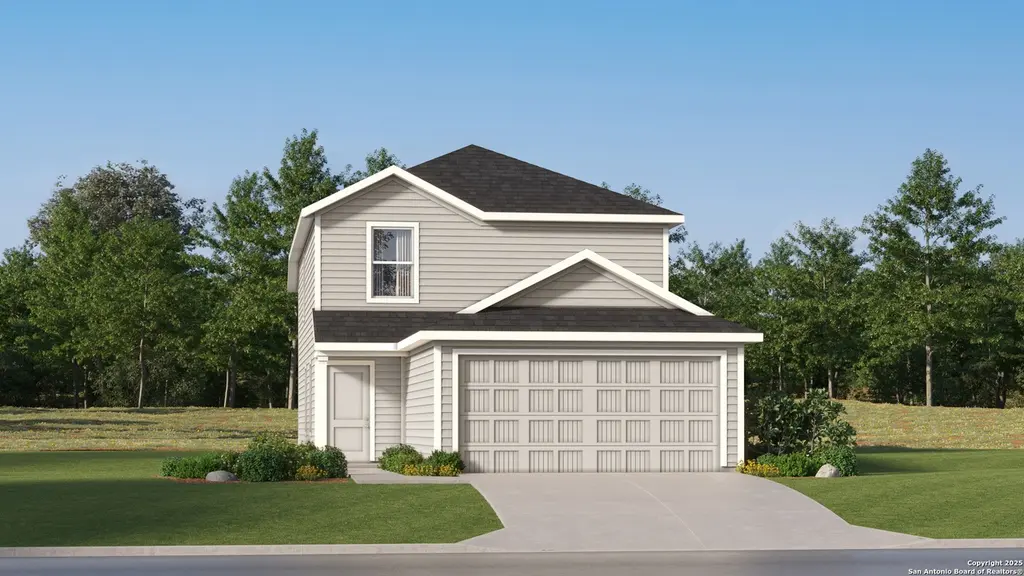
The Tilley - This new two-story home features a comfortable first-level owner's suite, complete with a full bathroom and walk-in closet to create a luxurious retreat. A nearby open-concept layout provides simple transitions and multitasking. Three additional bedrooms can be found on the second floor next to a versatile and inviting loft area. Estimated Completion May 2026. The completion date, prices and features may vary and are subject to change. Please verify with Lennar directly. Photos are for illustrative purposes only.
Key facts
- 4,791 sq ft lot
- 2 garage spots
- Community pool
Property features AI
Finance
- Financial info: Down payment resources available
- HOA & community: Mandatory HOA; HOA fee $33 monthly; Association transfer fee $450; Community amenities include pool
Exterior
- Parking: 2-car garage
- Utilities: City garbage service; Water service: SAWS; Sewer service: SAWS; Electricity: CPS
- Home design: New construction by Lennar; Cement fiber exterior; Entry level: lower-level master (master on lower level)
- Construction: Slab foundation; Composition roof
- Exterior features: Privacy fence; Pool in community
Interior
- Kitchen: Stove/Range; Dishwasher; Kitchen approx. 10 x 11; Breakfast bar
- Bedrooms: Master bedroom on lower level with walk-in closet and full bath; Bedroom 2: 10 x 11; Bedroom 3: 11 x 10; Bedroom 4: 10 x 10; Master bedroom dimensions: 11 x 12
- Flooring: Carpeting; Vinyl flooring
- Bathrooms: 2 full bathrooms; 1 half bathroom; Master bath with tub/shower combination and separate shower option
- Heating & cooling: Central heating; Electric and natural gas heating; Central air conditioning
- Interior features: Open floor plan; 1 living area; Breakfast bar; Loft; Utility room inside; Cable TV available; Walk-in closets
- Laundry & utility: Washer connection; Dryer connection; Utility room inside
Neighborhood map
What this means for you Summary
Snapshot
- This is a 4-bed/2.5-bath single-family listed at $204k. Condition is rated excellent.
Deal economics
- At list price, monthly cash flow is $13 ($159/yr) — positive.
- The deal already cash-flows at list — no discount required.
- To meet the 1% rule (rent ≥ 1% of price), the offer needs to be $184k (9.7% below list).
- Recommended offer: $184k (9.7% below list) — sets the bar for 1% rule.
Location & tenants
- Location reads 66/100 on livability (#639 in TX) — a middle-class / working-renter tenant base. Strengths: cost of living A+, housing A+, crime A; Watch: amenities F, commute F, health & safety F.
- Somerset ISD (rural): math 41% / reading 39% proficiency, ranked #417 of 826 in TX (top 50%) — families likely to look elsewhere, expect single-tenant / working-renter base with shorter leases; 72% free/reduced lunch — lower-income household profile, screen leases tightly.
- Market conditions: 324 active listings in the ZIP; 224 units permitted in Atascosa County in 2024 (0 in 5+ unit buildings).
Forward outlook
- In year one you build about $7k of equity ($1k loan paydown + $5k appreciation (2.6% local appreciation)).
- Atascosa County population projected at +41% by 2050 — long-run rental-demand tailwind backs the buy-and-hold thesis.
- At projected returns (2.6% appreciation + 3.0% rent growth), your $57k cash investment doubles in ~7 years — after that, you're playing with house money.
- By year 6, paydown + projected appreciation supports a ~$36k cash-out refi (75% LTV) — recoverable capital for the next deal without selling this one.
Negotiation context
- It's been on market 69 days — a 6% lower offer ($192k) is reasonable based on typical stale-listing flexibility.
Risks & watch-outs
- Climate carrying-cost: severe wind risk, 80% chance of damaging wind over 30y; moderate wildfire risk; extreme-heat days projected 4→11/yr by 2055 (HVAC capex compounding) — expect insurance premiums to compound above CPI over the hold.
Questions for the listing agent
- It's been on market 69 days. Have you received any prior offers? Is the seller open to a 10% concession, seller financing, or rate buy-down credit?
- What does the HOA fee cover, when was the last increase, and are there any pending special assessments or reserve-fund shortfalls?
- Why hasn't it sold? Are there any deal-killer items the seller is aware of (foundation, flood, title, zoning, code violations)?
- Is there a deadline driving the sale (1031 exchange, divorce, estate, relocation)? That informs how much negotiation room exists.
- What's the average days-on-market for RENTAL listings here right now (not sales)? A rising rental-DOM trend means longer vacancies and softer asking-rent achievability than the comps imply.
- What's the recent tenant-quality profile in this submarket — average credit score on applications, eviction rate, late-payment / NSF rate, and stable-employment percentage? A property-management company in the area should have these aggregated.
- How much new for-sale + rental construction is in the pipeline within 1–3 miles? Heavy new supply typically softens prices + rents 12–24 months out; constrained supply supports both.
Investment metrics
- 1% rule
- 0.90% ✗
- Cap rate
- 6.37%
- Cash-on-cash
- 0.28%
- DSCR
- 1.01
- GRM
- 9.2
CMA / ARV
- ARV (on-the-fly)
- $231,804
- Comps found
- 12
Show comp detail 12 sales within ~0.75 mi
| Address | Dist | Beds/Ba | Sqft | Sold | Price | $/sf | Match |
|---|---|---|---|---|---|---|---|
| 6031 Skipping Way | 0.00mi | 4/2.5 | 1,692 (0%) | 1mo | $222,999 | $132 | 99 |
| 6007 Skipping Way | 0.00mi | 4/2.5 | 1,692 (0%) | 2mo | $206,999 | $122 | 98 |
| 12022 Pressing Pass | 0.00mi | 4/2.5 | 1,692 (0%) | 2mo | $215,999 | $128 | 98 |
| 12918 Bone Dry Ln | 0.00mi | 4/2.5 | 1,676 (-1%) | 4mo | $219,506 | $131 | 95 |
| 12018 Listening Pass | 0.00mi | 3/2.0 (-1) | 1,657 (-2%) | 1mo | $234,999 | $142 | 89 |
| 12006 Listening Pass | 0.00mi | 3/2.0 (-1) | 1,657 (-2%) | 1mo | $245,999 | $148 | 89 |
| 12010 Listening Pass | 0.00mi | 4/3.0 | 1,795 (+6%) | 1mo | $248,999 | $139 | 87 |
| 12227 Kneeling Path | 0.00mi | 4/2.0 | 1,600 (-5%) | 3mo | $197,999 | $124 | 86 |
| 12203 Kneeling Path | 0.00mi | 4/2.0 | 1,600 (-5%) | 4mo | $219,999 | $137 | 86 |
| 6003 Skipping Way | 0.00mi | 4/2.5 | 1,897 (+12%) | 1mo | $232,999 | $123 | 79 |
| 1648 Palo Alto | 0.34mi | 3/2.0 (-1) | 1,442 (-15%) | 5mo | $224,900 | $156 | 48 |
| 55 N Cedar Dr | 0.71mi | 3/2.5 (-1) | 1,600 (-5%) | 15mo | $314,900 | $197 | 41 |
Match score weights: distance 35% · size 25% · config 20% · recency 20%. Top-matched comps best support the ARV.
Projected returns pro-forma
2.6% appreciation · 3.0% rent growth · sell at horizon
- IRR
- 6.6%
- Equity multiple
- 1.37×
- Total profit
- $21,194
- Equity at exit
- $87,179
- IRR
- 9.7%
- Equity multiple
- 2.40×
- Total profit
- $79,762
- Equity at exit
- $130,920
Cash invested: $57,120 (down + closing). Projections, not guarantees.
Landlord ↔ Tenant lean methodology
- Overall (STATE)
- 87 Strongly Landlord-Friendly
- State Texas
- 87 Strongly Landlord-Friendly · R+5
- County
- — inherits STATE
- City
- — inherits STATE
ZIP-level market 78073
- Home prices YoY
- 0.9%
- Active inventory
- 324
- Price-to-rent
- 9.2×
Monthly cashflow live
- Estimated rent
- $1,843 medium interval (Pro) →
- Mortgage (P&I)
- −$1,070
- Tax est. 1.5%
- −$255 /mo · $3,060/yr
- Insurance
- −$85
- HOA
- −$33
- Vacancy / Maint / Mgmt
- −$387
- Net cashflow
- $13
Break-even live
UW: 25.0% down · 7.5% · 30yr · 1.5% tax · 5.0% vac · 8.0% maint · 8.0% mgmt
Financing live
Cash to close
- Down payment
- $51,000
- Closing costs
- $6,120
- Reserves months
- —
- Total cash needed
- —
Loan-product check · same deal, 3 products live
Conventional
25% down · 7.5% · 30yr
- Down + closing
- —
- Monthly P&I
- —
- Monthly cashflow
- —
- DSCR
- —
- Eligible?
- —
Personal DTI + credit; lowest rate.
DSCR
20% down · 8.5% · 30yr
- Down + closing
- —
- Monthly P&I
- —
- Monthly cashflow
- —
- DSCR
- —
- Eligible?
- —
No personal income docs; deal must DSCR.
Hard money
10% down · 12.0% · 12mo
- Down + closing
- —
- Monthly P&I
- —
- Monthly cashflow
- —
- DSCR
- —
- Eligible?
- —
Short-term bridge; refi at stabilization.
HOA detail
- Monthly dues
- $33 · $396/yr
Listing history 5 events
-
2026-05-31status $203,999 Pending 69 DOM
-
2026-05-31days on market $203,999 Price Change 69 DOM
-
2026-05-21price $203,999
-
2026-04-30price $224,999
-
2026-03-23$236,999 New
ⓘ Source: listings_history table (triggers on properties + properties_extension) + one-shot
backfill from property_details.listing_events for pre-trigger history.
Climate risk First Street
- Flood 1/10 Low FEMA zone X (unshaded) · 0% chance over 30 yrs
- Wildfire 5/10 Major
- Heat 8/10 Severe 4 d/yr ≥109°F today · 11 d/yr by 30 yrs out
- Wind 8/10 Severe 80% chance of damaging wind over 30 yrs
- Air quality 1/10 Low 0 unhealthy d/yr today · 0 by 30 yrs out
Nearby sold comps map
Loading sold comps map…
Walkable amenities ~0.75 mi
Loading nearby amenities…
Taxation est. · year 1
- Rental income
- $22,117
- − Mortgage interest
- −$11,427
- − Property taxes
- −$3,060
- − Insurance
- −$1,020
- − Repairs & maintenance
- −$1,769
- − Management
- −$1,769
- − HOA
- −$396
- − Depreciation
- −$5,935
- Taxable loss
- −$3,259
- Est. tax savings @ 24.0%
- +$782
- After-tax cash flow
- $941/yr
For passive investors: Depreciation is non-cash, so a rental often shows a tax loss while cash-flowing — sheltering income. Rental losses are passive: they offset passive income freely, and up to $25,000/yr can offset ordinary (W-2) income if you actively participate and your MAGI is under $100k (phasing out to $0 by $150k); unused losses carry forward. On sale, claimed depreciation is recaptured at up to 25%, and gains may owe capital-gains tax (a 1031 exchange can defer both). Figures are a year-1 estimate at your 24.0% rate — not tax advice; consult a CPA.
Condition & rehab AI · 13 photos
This new two-story home is move-in ready with excellent condition and no visible repairs needed. It offers a comfortable first-level owner's suite and an open-concept layout, making it ideal for both resale and rental.
Value-add opportunities
- Both Landscaping — Enhances curb appeal and adds value
- Both Painting — Fresh paint can make the home look more inviting
- Both Lighting — Improved lighting can make the home more appealing
Renovation cost estimate screening
Value-add ROI direction
- Both Landscaping — Enhances curb appeal and adds value ↑
- Both Painting — Fresh paint can make the home look more inviting ↑
- Both Lighting — Improved lighting can make the home more appealing ↑
ⓘ Cost ranges are severity-bucket heuristics (US national rule-of-thumb). Get contractor quotes + a written scope before underwriting a rehab budget.
Schools (NCES district)
- District
- Somerset ISD
- NCES district ID
- 4840740
- Math proficiency
- 41% ▬ 0.00%
- Reading proficiency
- 39% ▲ 4.00%
- Median HH income
- $44,712
- Composite
- 34.01/100
- National rank
- #5315
- State rank
- #417 of 826 in TX
Livability — Somerset
- Score
- 66/100
- State rank
- #639
- US rank
- #12187
Category grades
Schools grade is shown separately in the Schools card above.
Census & demographics
- Population (ZIP)
- 9,510
Population outlook (Atascosa County) Hauer SSP2
- Today (2025)
- 57,233 people
- By 2030
- 61,729 · +7.9%
- By 2040
- 71,122 · +24.3%
- By 2050
- 80,906 · +41.4%
- By 2075
- 106,134 · +85.4%
- By 2100
- 122,415 · +113.9%
Race, ethnicity, and origin ACS 2023
- Neighborhood character
- Predominantly Hispanic (81%)
- Race & ethnicity
- Hispanic / Latino 81% Two or more races 33% White 16%
- Hispanic origin (detail)
- Mexican 75%
- Foreign-born
- 12% · Canada
- Languages at home
- 51% English-only · Spanish 48% German/W. Germanic 1%
Political lean MEDSL · Atascosa
- 2024 margin
- Solid R (+43.3) · D 27.9% · R 71.3%
- 2008→2024 swing
- -32.8pp toward R · 2008: -10.5pp · 2024: -43.3pp
- All cycles
- 2024: R+43.3 2020: R+34.0 2016: R+29.1 2012: R+18.3 2008: R+10.5
Not yet ingested
- Civics
- —
Market trends
- HPI YoY
- ▲ 2.60%
- Current HPI
- 289.1266
- Rent YoY
- —
- Metro
- —
- State GDP YoY
- ▲ 3.95%
- F500 in state
- 110
Industry mix (Fortune 500 HQ in TX)
| Industry | F500 HQs | Revenue |
|---|---|---|
| Energy | 16 | $1,198B |
|
||
| Technology | 5 | $198B |
|
||
| Engineering / Construction | 4 | $72B |
|
||
| Energy Services | 3 | $60B |
|
||
| Utilities | 3 | $41B |
|
||
| Healthcare | 2 | $330B |
|
||
Price history
-13.9% since first listed3 events — show timeline
- 2026-05-21 Price Changed $203,999 LERA
- 2026-04-30 Price Changed $224,999 LERA
- 2026-03-23 Listed $236,999 LERA
Cash-flow waterfall
monthlySold comps — $/sqft
last 12 mo · ≤1 miLoading sold comps…