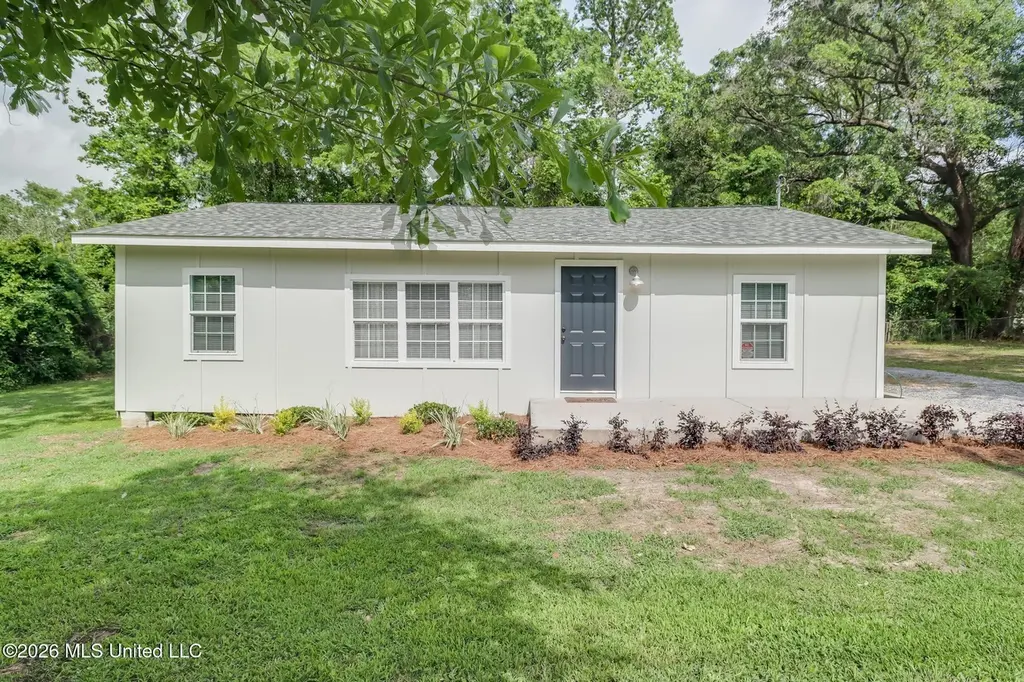
13518 Scott St · Gulfport, MS
Flood risk 1/10 · Minimal
- FEMA flood zone
- X (unshaded)
- Chance of flooding over 30 yrs
- 0.0%
- Est. flood insurance / yr
- $507 – $1,088
Fire risk 4/10 · Minor
- Est. fire insurance / yr
- $1,241 – $2,305
Heat risk 9/10 · Severe
- Hot days now (above 107°F)
- 7 days/yr
- Hot days in 30 yrs
- 21 days/yr
Wind risk 9/10 · Severe
- Chance of severe wind over 30 yrs
- 99.0%
Air-quality risk 2/10 · Minimal
- Unhealthy air days now
- 1 days/yr
- Unhealthy air days in 30 yrs
- 2 days/yr
Risk factors via First Street. Map © Google.
Why this score? — see what drove the B- grade
The composite is a weighted blend of 9 inputs, each scored 0–100. Each bar is that input's sub-score; the figure is the points it added to the 100-point composite (weight × sub-score).
- Cash flow +26.8/30.0
- ARV discount +12.6/15.0
- DSCR +9.2/10.0
- 1% rule +6.1/10.0
- Rent growth +4.2/5.0
- Schools +4.2/10.0
- Livability +3.7/5.0
- Condition / age +2.5/5.0
- Appreciation +0.0/10.0
$154,000
🖨 Deal sheet (PDF) 📄 Offer letter ✓ Due diligence
Listing remarks
Priced to sell! This recently updated split floorplan-three-bedroom home features a fully remodeled bathroom and is ideal for a first-time buyer or small family. Enjoy peace of mind with a roof (architectural shingles), HVAC, and insulation—all approximately 4 years old. Durable, low maintenance Hardi plank exterior and recent partial subfloor replacement. Situated minutes from A rated schools and located in a no flood insurance zone. Relax or entertain on the back patio with composite decking or the new concrete front patio on a spacious . 37-acre lot. One mile from Highway 605! Schedule your showing today!
Key facts
- Hardi plank exterior
- 0.37 acre lot
- Built 1960
Tags
Property features AI
Finance
- Other: Lot approximately 0.37 acre (dimensions 151.0 x 107.0)
Exterior
- Parking: Driveway with gravel surface
- Utilities: Public water; Public sewer; Electricity connected; Water connected; Sewer connected
- Home design: Single family residence (house); One level; Raised foundation; Architectural shingle roof; Board & batten and HardiPlank siding; Facing direction not provided
- Construction: Built date available from public records
- Exterior features: Partial fencing; Other exterior features
Interior
- Kitchen: Electric cooktop; Oven; Refrigerator
- Flooring: Laminate flooring
- Bathrooms: 1 full bathroom
- Heating & cooling: Central electric heating; Central electric air conditioning
- Interior features: Move-in ready condition; Patio and porch
- Laundry & utility: Laundry located in the bathroom
Neighborhood map
What this means for you Summary
Snapshot
- This is a 2-bed/1.0-bath single-family listed at $154k.
Deal economics
- At list price, monthly cash flow is $423 ($5k/yr) — positive.
- The deal already cash-flows at list — no discount required.
- Meets the 1% rule at list price ($2k rent vs $154k).
- Recommended offer: $149k (3.0% below list) — sets the bar for market timing.
- Cap rate 9.6% vs local median 4.9% in Gulfport — top-decile yield for the area; either an underpriced asset or a hidden risk that comps aren't pricing in. Stress-test before assuming the spread holds.
Location & tenants
- Location reads 73/100 on livability (#15 in MS) — a middle-class / working-renter tenant base. Strengths: cost of living A+, housing A+, health & safety A+; Watch: schools D, amenities F, commute F.
- Harrison County School District (rural): math 52% / reading 46% proficiency, ranked #14 of 130 in MS (top 11%) — families likely to look elsewhere, expect single-tenant / working-renter base with shorter leases; 62% free/reduced lunch — lower-income household profile, screen leases tightly.
- Market conditions: Rents rising fast (+7.0%/yr); 769 active listings in the ZIP; 8 comparable units currently listed for rent nearby; rentals lingering (median 45d on market — plan ~5-8 weeks vacancy on turnover, expect pricing pressure); 75% of comp listings sitting > 30 days — soft ceiling on asking rent; 2,194 units permitted in Harrison County in 2024 (0 in 5+ unit buildings).
- This rent runs 33% of the median local income ($63k/yr) — at the standard rent-burdened threshold; future hikes will face affordability resistance.
Forward outlook
- Local home prices are declining (-3.0%/yr); year-one equity from $1k of loan paydown is wiped out by about $5k of value loss. Plan a longer hold.
- Harrison County population projected at +27% by 2050 — long-run rental-demand tailwind backs the buy-and-hold thesis.
- At projected returns (-3.0% appreciation + 7.0% rent growth), your $43k cash investment doubles in ~8 years — after that, you're playing with house money.
Negotiation context
- It's been on market 52 days — a 3% lower offer ($149k) is reasonable based on typical stale-listing flexibility.
- 2 sale attempts since 13y ago; this cycle's ask has dropped $16k (9%) from the opening price — seller is motivated, your offer sets the floor, not the list.
- Current owner paid $10k; list at $154k implies a 1440% gain — meaningful room to come down on a strong offer.
Risks & watch-outs
- Climate carrying-cost: severe wind risk, 99% chance of damaging wind over 30y; extreme-heat days projected 7→21/yr by 2055 (HVAC capex compounding) — expect insurance premiums to compound above CPI over the hold.
Questions for the listing agent
- It's been on market 52 days. Have you received any prior offers? Is the seller open to a 3% concession, seller financing, or rate buy-down credit?
- Built in 1960 — when were the roof, HVAC, electrical panel, plumbing, and water heater last replaced?
- Is there a deadline driving the sale (1031 exchange, divorce, estate, relocation)? That informs how much negotiation room exists.
- Schools are D-rated, which usually means shorter tenancies and higher turnover. Who's the typical renter profile here, and what's been the actual vacancy rate?
- What's the average days-on-market for RENTAL listings here right now (not sales)? A rising rental-DOM trend means longer vacancies and softer asking-rent achievability than the comps imply.
- What's the recent tenant-quality profile in this submarket — average credit score on applications, eviction rate, late-payment / NSF rate, and stable-employment percentage? A property-management company in the area should have these aggregated.
- How much new for-sale + rental construction is in the pipeline within 1–3 miles? Heavy new supply typically softens prices + rents 12–24 months out; constrained supply supports both.
Investment metrics
- 1% rule
- 1.11% ✓
- Cap rate
- 9.59%
- Cash-on-cash
- 11.76%
- DSCR
- 1.52
- GRM
- 7.5
CMA / ARV
- ARV (median comp)
- $173,728
- List price
- $154,000
- Delta
- -11.36%
- Verdict
- UNDERPRICED
- Comps
- 20 within 1.0 mi
Show comp detail 12 sales within ~0.75 mi
| Address | Dist | Beds/Ba | Sqft | Sold | Price | $/sf | Match |
|---|---|---|---|---|---|---|---|
| 13321 Gwen Ave | 0.58mi | 2/2.0 | 1,300 (+2%) | 2mo | $125,000 | $96 | 63 |
| 13691 Lawton Ln | 0.67mi | 3/2.0 (+1) | 1,220 (-4%) | 1mo | $205,000 | $168 | 52 |
| 14037 Sanctuary Trails Dr | 0.59mi | 3/2.0 (+1) | 1,348 (+6%) | 3mo | $249,900 | $185 | 51 |
| 14111 Sanctuary Trails Dr | 0.53mi | 3/2.0 (+1) | 1,388 (+9%) | 0mo | $248,900 | $179 | 51 |
| 13292 Turtle Creek Pkwy | 0.69mi | 3/2.0 (+1) | 1,312 (+3%) | 4mo | $223,000 | $170 | 50 |
| 13727 Churchwood Dr | 0.73mi | 3/2.0 (+1) | 1,237 (-3%) | 4mo | $219,900 | $178 | 49 |
| 14202 Debra Barbee Ct | 0.50mi | 3/2.0 (+1) | 1,379 (+8%) | 6mo | $255,000 | $185 | 48 |
| 14116 Sanctuary Trails Dr | 0.56mi | 3/2.0 (+1) | 1,398 (+10%) | 4mo | $227,900 | $163 | 45 |
| 14201 Sanctuary Trails Dr | 0.47mi | 3/2.0 (+1) | 1,384 (+9%) | 11mo | $202,400 | $146 | 45 |
| 13637 Lawton Ln | 0.70mi | 3/2.0 (+1) | 1,176 (-8%) | 2mo | $199,000 | $169 | 45 |
| 13268 Turtle Creek Pkwy | 0.72mi | 3/2.0 (+1) | 1,318 (+4%) | 10mo | $219,900 | $167 | 43 |
| 14194 Sanctuary Trails Dr | 0.47mi | 3/2.0 (+1) | 1,421 (+12%) | 10mo | $249,000 | $175 | 41 |
Match score weights: distance 35% · size 25% · config 20% · recency 20%. Top-matched comps best support the ARV.
Projected returns pro-forma
-3.0% appreciation · 6.99% rent growth · sell at horizon
- IRR
- 5.2%
- Equity multiple
- 1.21×
- Total profit
- $9,034
- Equity at exit
- $22,962
- IRR
- 17.7%
- Equity multiple
- 2.72×
- Total profit
- $74,064
- Equity at exit
- $13,315
Cash invested: $43,120 (down + closing). Projections, not guarantees.
Landlord ↔ Tenant lean methodology
- Overall (STATE)
- 90 Strongly Landlord-Friendly
- State Mississippi
- 90 Strongly Landlord-Friendly · R+11
- County
- — inherits STATE
- City
- — inherits STATE
ZIP-level market 39503
- Home prices YoY
- -21.5%
- Rents YoY
- 7.0%
- Active inventory
- 769
- Price-to-rent
- 7.5×
Monthly cashflow live
- Estimated rent
- $1,708 high interval (Pro) →
- Mortgage (P&I)
- −$808
- Tax from tax record
- −$55 /mo · $660/yr
- Insurance
- −$64
- HOA
- −$0
- Vacancy / Maint / Mgmt
- −$359
- Net cashflow
- $423
Break-even live
Sensitivity live
| Price | -10% $510 | -5% $466 | +0% $423 | +5% $379 | +10% $335 |
|---|---|---|---|---|---|
| Rent | -10% $288 | -5% $355 | +0% $423 | +5% $490 | +10% $558 |
| Rate | -1.0pp $500 | -0.5pp $462 | base $423 | +0.5pp $383 | +1.0pp $342 |
UW: 25.0% down · 7.5% · 30yr · 1.5% tax · 5.0% vac · 8.0% maint · 8.0% mgmt
Financing live
Cash to close
- Down payment
- $38,500
- Closing costs
- $4,620
- Reserves months
- —
- Total cash needed
- —
Loan-product check · same deal, 3 products live
Conventional
25% down · 7.5% · 30yr
- Down + closing
- —
- Monthly P&I
- —
- Monthly cashflow
- —
- DSCR
- —
- Eligible?
- —
Personal DTI + credit; lowest rate.
DSCR
20% down · 8.5% · 30yr
- Down + closing
- —
- Monthly P&I
- —
- Monthly cashflow
- —
- DSCR
- —
- Eligible?
- —
No personal income docs; deal must DSCR.
Hard money
10% down · 12.0% · 12mo
- Down + closing
- —
- Monthly P&I
- —
- Monthly cashflow
- —
- DSCR
- —
- Eligible?
- —
Short-term bridge; refi at stabilization.
Rent comps 8 comps
| Address | Beds | Baths | Sqft | Rent | $/sqft | DOM | Units | Dist |
|---|---|---|---|---|---|---|---|---|
| 13469 Mary Ave Gulfport, MS | 3.0 | 2.0 | 1565 | $1,800 | $1.15 | 44d | 1 | 0.13mi |
| 13463 Mary Ave Gulfport, MS | 3.0 | 2.0 | 1565 | $1,775 | $1.13 | 44d | 1 | 0.14mi |
| 13498 Dee Ave Gulfport, MS | 3.0 | 2.0 | 1410 | $1,750 | $1.24 | 44d | 1 | 0.14mi |
| 13459 Gorman St Gulfport, MS | 2.0 | 1.5 | 1000 | $1,649 | $1.65 | 44d | 1 | 0.17mi |
| 14179 Debra Barbee Ct Gulfport, MS | 3.0 | 2.0 | 1379 | $1,849 | $1.34 | 22d | 1 | 0.45mi |
| 13444 Willow Oak Cir Gulfport, MS | 3.0 | 2.5 | 1679 | $1,750 | $1.04 | 44d | 1 | 0.84mi |
| 13145 Turtle Creek Pkwy Gulfport, MS | 3.0 | 2.5 | 1679 | $1,795 | $1.07 | 44d | 1 | 0.93mi |
| 13070 Tracewood Dr Gulfport, MS | 3.0 | 2.0 | 1190 | $1,400 | $1.18 | 22d | 1 | 1.47mi |
Listing history 23 events
-
2026-06-21days on market $154,000 Active 52 DOM
-
2026-06-18days on market $154,000 Active 49 DOM
-
2026-06-17days on market $154,000 Active 48 DOM
-
2026-06-16days on market $154,000 Active 47 DOM
-
2026-06-15days on market $154,000 Active 46 DOM
-
2026-06-14days on market $154,000 Active 44 DOM
-
2026-06-13pricedays on market $154,000 Active 43 DOM
-
2026-06-10days on market $159,900 Active 41 DOM
-
2026-06-09days on market $159,900 Active 40 DOM
-
2026-06-08days on market $159,900 Active 39 DOM
-
2026-06-07days on market $159,900 Active 38 DOM
-
2026-06-02days on market $159,900 Active 33 DOM
-
2026-06-01days on market $159,900 Active 32 DOM
-
2026-05-31days on market $159,900 Active 31 DOM
-
2026-05-30days on market $159,900 Active 30 DOM
-
2026-05-12price $164,900 620-char remark
-
2026-04-30$170,000 Active 620-char remark
-
2023-03-14soldstatus
-
2021-11-23soldstatus $10,000
-
2021-09-15historical
-
2016-03-01soldstatus
-
2013-06-27soldstatus
-
2013-04-18$10,900
ⓘ Source: listings_history table (triggers on properties + properties_extension) + one-shot
backfill from property_details.listing_events for pre-trigger history.
Tax reassessment forecast MS · Resets to sale price
- Current annual tax
- $660 · $55/mo
- Projected year-2 tax
- $1,217 · $101/mo
- Expected delta
- +$556/yr (+$46/mo · 84.3%)
ⓘ Screening estimate from a state-policy table — verify with the county assessor before closing.
Climate risk First Street
- Flood 1/10 Low FEMA zone X (unshaded) · 0% chance over 30 yrs
- Wildfire 4/10 Moderate
- Heat 9/10 Extreme 7 d/yr ≥107°F today · 21 d/yr by 30 yrs out
- Wind 9/10 Extreme 99% chance of damaging wind over 30 yrs
- Air quality 2/10 Low 1 unhealthy d/yr today · 2 by 30 yrs out
Nearby sold comps map
Loading sold comps map…
Walkable amenities ~0.75 mi
Loading nearby amenities…
Taxation est. · year 1
- Rental income
- $20,497
- − Mortgage interest
- −$8,626
- − Property taxes
- −$660
- − Insurance
- −$770
- − Repairs & maintenance
- −$1,640
- − Management
- −$1,640
- − Depreciation
- −$4,480
- Taxable income
- $2,681
- Est. tax owed @ 24.0%
- −$643
- After-tax cash flow
- $4,428/yr
For passive investors: Depreciation is non-cash, so a rental often shows a tax loss while cash-flowing — sheltering income. Rental losses are passive: they offset passive income freely, and up to $25,000/yr can offset ordinary (W-2) income if you actively participate and your MAGI is under $100k (phasing out to $0 by $150k); unused losses carry forward. On sale, claimed depreciation is recaptured at up to 25%, and gains may owe capital-gains tax (a 1031 exchange can defer both). Figures are a year-1 estimate at your 24.0% rate — not tax advice; consult a CPA.
Schools (NCES district)
- District
- Harrison County School District
- NCES district ID
- 2801770
- Math proficiency
- 52% ▼ -4.00%
- Reading proficiency
- 46% ▼ -4.00%
- Median HH income
- $46,504
- Composite
- 41.66/100
- National rank
- #3419
- State rank
- #14 of 130 in MS
Livability — Gulfport
- Score
- 73/100
- State rank
- #15
- US rank
- #5010
Category grades
Schools grade is shown separately in the Schools card above.
Census & demographics
- Census place
- Gulfport, MS
- County
- Harrison County · 178,171 people
- City population
- 96,188
- Metro
- Gulfport-Biloxi, MS
- Population (ZIP)
- 55,059
- Household income
- $62,641
- Rent vs Own
- Severe rent burden
- 1686.0
Population outlook (Harrison County) Hauer SSP2
- Today (2025)
- 228,444 people
- By 2030
- 241,942 · +5.9%
- By 2040
- 267,531 · +17.1%
- By 2050
- 291,062 · +27.4%
- By 2075
- 346,711 · +51.8%
- By 2100
- 378,165 · +65.5%
Race, ethnicity, and origin ACS 2023
- Neighborhood character
- Diverse neighborhood (Simpson 0.58)
- Race & ethnicity
- White 58% Black 27% Two or more races 9% Hispanic / Latino 6% Asian 2%
- Hispanic origin (detail)
- Mexican 2% Puerto Rican 1%
- Common ancestry
- Lithuanian 5% Slovak 1% Portuguese 1%
- Foreign-born
- 3% · Canada
- Languages at home
- 95% English-only · Spanish 3%
Political lean MEDSL · Harrison
- 2024 margin
- Strong R (+28.9) · D 35.0% · R 63.9% · Other 1.1%
- 2008→2024 swing
- -2.9pp toward R · 2008: -26.0pp · 2024: -28.9pp
- All cycles
- 2024: R+28.9 2020: R+25.2 2016: R+30.7 2012: R+26.6 2008: R+26.0
Not yet ingested
- Civics
- —
Market trends
- HPI YoY
- ▼ -51.39%
- Current HPI
- 187.285
- Rent YoY
- ▲ 6.99%
- Metro
- Gulfport-Biloxi, MS
- State GDP YoY
- —
- F500 in state
- 0
Price history
+1312.8% since first listed10 events — show timeline
- 2026-06-10 Price Changed $154,000 MLSU
- 2026-05-20 Price Changed $159,900 MLSU
- 2026-05-12 Price Changed $164,900 MLSU
- 2026-04-30 Listed $170,000 MLSU
- 2023-03-14 Sold (Public Records) — Public Records
- 2021-11-23 Sold (Public Records) $10,000 Public Records
- 2021-09-15 Listing Removed — MLSU
- 2016-03-01 Sold (Public Records) — Public Records
- 2013-06-27 Sold (Public Records) — Public Records
- 2013-04-18 Listed $10,900 MLSU
Property tax history
+4.0%/yrLatest (2025): $660 · +4.8% YoY. Source: county tax records.
Cash-flow waterfall
monthlySold comps — $/sqft
last 12 mo · ≤1 miLoading sold comps…