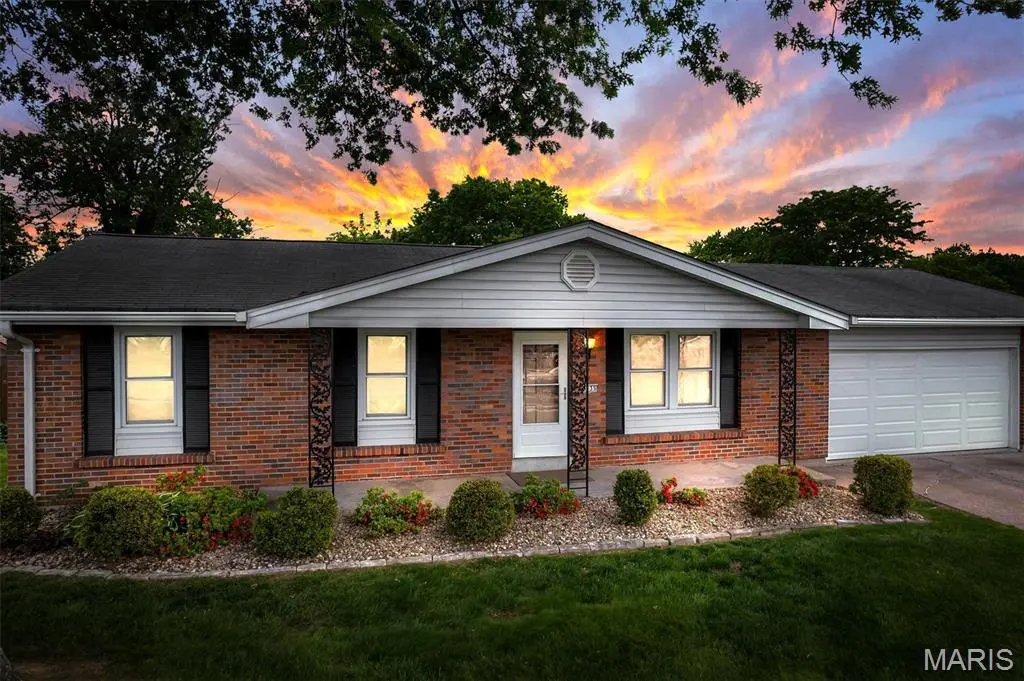
3135 Elm St · St. Charles, MO
Flood risk 1/10 · Minimal
- FEMA flood zone
- X (unshaded)
- Chance of flooding over 30 yrs
- 0.0%
- Est. flood insurance / yr
- $473 – $860
Fire risk 1/10 · Minimal
- Est. fire insurance / yr
- $1,054 – $1,958
Heat risk 4/10 · Minor
- Hot days now (above 106°F)
- 7 days/yr
- Hot days in 30 yrs
- 19 days/yr
Wind risk 2/10 · Minimal
- Chance of severe wind over 30 yrs
- 1.0%
Air-quality risk 3/10 · Minor
- Unhealthy air days now
- 2 days/yr
- Unhealthy air days in 30 yrs
- 3 days/yr
Risk factors via First Street. Map © Google.
Why this score? — see what drove the F grade
The composite is a weighted blend of 9 inputs, each scored 0–100. Each bar is that input's sub-score; the figure is the points it added to the 100-point composite (weight × sub-score).
- ARV discount +11.3/15.0
- Cash flow +5.8/30.0
- Schools +4.1/10.0
- Rent growth +3.3/5.0
- Livability +2.5/5.0
- Condition / age +2.5/5.0
- 1% rule +0.6/10.0
- DSCR +0.2/10.0
- Appreciation +0.0/10.0
$285,000
🖨 Deal sheet (PDF) 📄 Offer letter ✓ Due diligence
Listing remarks
This beautiful home offers the space, updates, and versatility today’s buyers are looking for! Situated on a beautifully landscaped corner lot in Huntmoor Estates, this spacious ranch features 4 bedrooms, 2.5 baths, an oversized 2 car garage, and over 2,000+ sq ft of living space including the finished lower level. The updated kitchen is a standout with full slab granite countertops, tiled backsplash, custom cabinetry, induction/electric hybrid cooktop, full size wall oven, breakfast bar, Kenmore appliances including refrigerator and tiled center island opening to the dining area. The lower part of the pantry has roll out drawers. Floor-to-ceiling custom built-in shelving adds charact
Key facts
- 0.26 acre lot
- 2 garage spots
- Built 1969
Property features AI
Finance
- Other: Above-grade finished area and living area reported by assessor; Below-grade finished area reported by owner
Exterior
- Parking: Attached garage with 2 spaces, garage faces front and has automatic door opener; Oversized, side-by-side garage; Driveway and paved parking; total parking for 4 vehicles
- Security: Storm doors
- Utilities: Public water; Public sewer; Electricity connected (220 volts); Natural gas connected
- Home design: Single-family residence; Updated/remodeled condition; One level with finished below-grade space; Private ownership
- Construction: Brick, concrete and vinyl siding exterior; Shingle roof; Concrete perimeter foundation; Basement present (full, partially finished, daylight/lookout with egress window, interior entry, sleeping area, storage and sump pump)
- Exterior features: Deck; Front porch and additional porch; Private yard; Fenced backyard with chain link, wood privacy sections and gate; Landscaped yard with garden, few trees, front and back yard; Gentle sloping, level and irregular lot characteristics; Concrete road frontage (city street)
Interior
- Kitchen: Electric cooktop; Induction cooktop; Wall oven; Dishwasher; Disposal; Microwave; Refrigerator; Granite and stone countertops; Kitchen island; Pantry; Eat-in/kitchen-dining combo
- Bedrooms: 4 bedrooms total — 3 on the main level, 1 on the lower level
- Flooring: Carpet; Ceramic tile; Laminate; Simulated wood
- Bathrooms: 2 full bathrooms and 1 half bathroom; Main level contains full bathrooms; lower level contains a half bath
- Heating & cooling: Forced air heating (natural gas); Central air conditioning; Attic fan; Ceiling fans
- Interior features: Bookcases; Breakfast bar; Ceiling fans; Eat-in kitchen; Granite counters; Kitchen island; Kitchen/dining room combo; Pantry; Stone counters; Storage; Walk-in closets; Blinds and window treatments; Double-pane insulated windows with screens and storm windows
- Laundry & utility: Laundry in basement with washer and electric dryer hookups
Neighborhood map
What this means for you Summary
Snapshot
- This is a 3-bed/2.5-bath single-family listed at $285k.
Deal economics
- At list price, monthly cash flow is $-567 ($-7k/yr) — negative.
- To cash-flow at today's rent, offer at most $185k (35.1% below list).
- To meet the 1% rule (rent ≥ 1% of price), the offer needs to be $158k (44.4% below list).
- Recommended offer: $158k (44.4% below list) — sets the bar for 1% rule.
Location & tenants
- Location reads: area grade F — affects rentability + tenant quality, not the cash-flow math above.
- St. Charles R-VI (urban): math 44% / reading 52% proficiency, ranked #51 of 324 in MO (top 16%) — families likely to look elsewhere, expect single-tenant / working-renter base with shorter leases.
- Zoned schools: George M. Null Elem. (math 47% / reading 57%, grade C-, #231 of 1,115 statewide, top 24%, 249 students, 37% FRL); St. Charles High (math 42% / reading 54%, grade D, #153 of 521 statewide, top 29%, 817 students, 43% FRL) — zoned schools at 40% FRL track the district average.
- Market conditions: Rents rising (+3.2%/yr); 305 active listings in the ZIP; 3 comparable units currently listed for rent nearby; rentals leasing fast (median 7d on market — plan ~1-2 weeks tenant-placement turnaround); solid renter incomes; 2,021 units permitted in St. Charles County in 2024 (568 in 5+ unit buildings).
Forward outlook
- Local home prices are declining (-3.0%/yr); year-one equity from $2k of loan paydown is wiped out by about $9k of value loss. Plan a longer hold.
- St. Charles County population projected at +22% by 2050 — long-run rental-demand tailwind backs the buy-and-hold thesis.
Negotiation context
- Only 3 days on market — expect competitive offers; lowballing is unlikely to land.
- Current owner paid $70k; list at $285k implies a 307% gain — meaningful room to come down on a strong offer.
Questions for the listing agent
- What do current leases actually rent for vs. the listed asking? Can we see a recent rent roll and the last 12 months of T-12 income?
- Built in 1969 — when were the roof, HVAC, electrical panel, plumbing, and water heater last replaced?
- Is there a deadline driving the sale (1031 exchange, divorce, estate, relocation)? That informs how much negotiation room exists.
- The area grade is low — what's the realistic commute time and amenity access for the typical tenant pool here? Any planned neighborhood developments (good or bad) we should know about?
- What's the average days-on-market for RENTAL listings here right now (not sales)? A rising rental-DOM trend means longer vacancies and softer asking-rent achievability than the comps imply.
- What's the recent tenant-quality profile in this submarket — average credit score on applications, eviction rate, late-payment / NSF rate, and stable-employment percentage? A property-management company in the area should have these aggregated.
- How much new for-sale + rental construction is in the pipeline within 1–3 miles? Heavy new supply typically softens prices + rents 12–24 months out; constrained supply supports both.
Investment metrics
- 1% rule
- 0.56% ✗
- Cap rate
- 3.91%
- Cash-on-cash
- -8.52%
- DSCR
- 0.62
- GRM
- 15.0
CMA / ARV
- ARV (median comp)
- $311,329
- List price
- $285,000
- Delta
- -8.46%
- Verdict
- FAIR
- Comps
- 20 within 1.0 mi
Show comp detail 12 sales within ~0.75 mi
| Address | Dist | Beds/Ba | Sqft | Sold | Price | $/sf | Match |
|---|---|---|---|---|---|---|---|
| 605 Rauch Dr | 0.37mi | 3/2.0 | 1,204 (+0%) | 3mo | $315,000 | $262 | 78 |
| 3000 Elm St | 0.24mi | 3/3.0 | 1,236 (+3%) | 12mo | $229,900 | $186 | 72 |
| 2948 Homewood Ave | 0.32mi | 3/2.0 | 1,118 (-7%) | 4mo | $275,000 | $246 | 68 |
| 5 Cedar Ct | 0.36mi | 3/2.0 | 1,275 (+6%) | 3mo | $258,000 | $202 | 68 |
| 324 Elmwood Dr | 0.66mi | 3/2.5 | 1,210 (+1%) | 3mo | $245,000 | $202 | 66 |
| 1 Havenhill Ct | 0.07mi | 2/2.0 (-1) | 1,334 (+11%) | 7mo | $439,900 | $330 | 65 |
| 3109 Powder Horn Trl | 0.43mi | 2/2.0 (-1) | 1,288 (+7%) | 5mo | $280,000 | $217 | 56 |
| 2602 Nettie Dr | 0.73mi | 3/1.5 | 1,190 (-1%) | 8mo | $250,000 | $210 | 54 |
| 3424 La Salle Dr | 0.48mi | 4/2.5 (+1) | 1,080 (-10%) | 6mo | $174,900 | $162 | 51 |
| 139 Cole Blvd | 0.50mi | 3/2.0 | 1,368 (+14%) | 2mo | $320,000 | $234 | 50 |
| 2513 Sibley St | 0.73mi | 3/1.5 | 1,148 (-4%) | 13mo | $234,900 | $205 | 44 |
| 2534 Leonard Dr | 0.72mi | 3/1.0 | 1,040 (-13%) | 4mo | $225,000 | $216 | 35 |
Match score weights: distance 35% · size 25% · config 20% · recency 20%. Top-matched comps best support the ARV.
Projected returns pro-forma
-3.0% appreciation · 3.2% rent growth · sell at horizon
- IRR
- -31.2%
- Equity multiple
- -0.03×
- Total profit
- $-82,030
- Equity at exit
- $42,494
- IRR
- -33.8%
- Equity multiple
- -0.46×
- Total profit
- $-116,877
- Equity at exit
- $24,642
Cash invested: $79,800 (down + closing). Projections, not guarantees.
Landlord ↔ Tenant lean methodology
- Overall (STATE)
- 81 Strongly Landlord-Friendly
- State Missouri
- 81 Strongly Landlord-Friendly · R+10
- County
- — inherits STATE
- City
- — inherits STATE
ZIP-level market 63301
- Rents YoY
- 3.2%
- Active inventory
- 305
- Price-to-rent
- 15.0×
Monthly cashflow live
- Estimated rent
- $1,585 medium interval (Pro) →
- Mortgage (P&I)
- −$1,495
- Tax from tax record
- −$205 /mo · $2,463/yr
- Insurance
- −$119
- HOA
- −$0
- Lot rent
- −$0
- Vacancy / Maint / Mgmt
- −$333
- Net cashflow
- $-567
Break-even live
Sensitivity live
| Price | -10% $-405 | -5% $-486 | +0% $-567 | +5% $-647 | +10% $-728 |
|---|---|---|---|---|---|
| Rent | -10% $-692 | -5% $-629 | +0% $-567 | +5% $-504 | +10% $-442 |
| Rate | -1.0pp $-423 | -0.5pp $-494 | base $-567 | +0.5pp $-641 | +1.0pp $-716 |
UW: 25.0% down · 7.5% · 30yr · 1.5% tax · 5.0% vac · 8.0% maint · 8.0% mgmt
Financing live
Cash to close
- Down payment
- $71,250
- Closing costs
- $8,550
- Reserves months
- —
- Total cash needed
- —
Loan-product check · same deal, 3 products live
Conventional
25% down · 7.5% · 30yr
- Down + closing
- —
- Monthly P&I
- —
- Monthly cashflow
- —
- DSCR
- —
- Eligible?
- —
Personal DTI + credit; lowest rate.
DSCR
20% down · 8.5% · 30yr
- Down + closing
- —
- Monthly P&I
- —
- Monthly cashflow
- —
- DSCR
- —
- Eligible?
- —
No personal income docs; deal must DSCR.
Hard money
10% down · 12.0% · 12mo
- Down + closing
- —
- Monthly P&I
- —
- Monthly cashflow
- —
- DSCR
- —
- Eligible?
- —
Short-term bridge; refi at stabilization.
Rent comps 3 comps
| Address | Beds | Baths | Sqft | Rent | $/sqft | DOM | Units | Dist |
|---|---|---|---|---|---|---|---|---|
| 236 S Cadillac Dr Saint Charles, MO | 3.0 | 1.0 | 864 | $1,600 | $1.85 | 6d | 1 | 0.82mi |
| 3313 Droste Rd Unit 3313 St Charles, MO | 2.0 | 1.5 | 850 | $1,450 | $1.71 | 0d | 1 | 1.23mi |
| 920 Parkcrest Dr Unit 920 St Charles, MO | 2.0 | 1.5 | 1000 | $1,400 | $1.40 | 18d | 1 | 1.28mi |
Listing history 5 events
-
2026-05-18status Pending 1573-char remark
-
2026-05-15$285,000 Active 1573-char remark
-
2026-05-09historical $285,000 1573-char remark
-
2005-08-18soldstatus
-
1991-12-01soldstatus $70,000
ⓘ Source: listings_history table (triggers on properties + properties_extension) + one-shot
backfill from property_details.listing_events for pre-trigger history.
Tax reassessment forecast MO · Resets to sale price
- Current annual tax
- $2,463 · $205/mo
- Projected year-2 tax
- $2,764 · $230/mo
- Expected delta
- +$302/yr (+$25/mo · 12.2%)
ⓘ Screening estimate from a state-policy table — verify with the county assessor before closing.
Climate risk First Street
- Flood 1/10 Low FEMA zone X (unshaded) · 0% chance over 30 yrs
- Wildfire 1/10 Low
- Heat 4/10 Moderate 7 d/yr ≥106°F today · 19 d/yr by 30 yrs out
- Wind 2/10 Low 100% chance of damaging wind over 30 yrs
- Air quality 3/10 Moderate 2 unhealthy d/yr today · 3 by 30 yrs out
Nearby sold comps map
Loading sold comps map…
Walkable amenities ~0.75 mi
Loading nearby amenities…
Taxation est. · year 1
- Rental income
- $19,014
- − Mortgage interest
- −$15,964
- − Property taxes
- −$2,463
- − Insurance
- −$1,425
- − Repairs & maintenance
- −$1,521
- − Management
- −$1,521
- − Depreciation
- −$8,291
- Taxable loss
- −$12,171
- Est. tax savings @ 24.0%
- +$2,921
- After-tax cash flow
- $-3,880/yr
For passive investors: Depreciation is non-cash, so a rental often shows a tax loss while cash-flowing — sheltering income. Rental losses are passive: they offset passive income freely, and up to $25,000/yr can offset ordinary (W-2) income if you actively participate and your MAGI is under $100k (phasing out to $0 by $150k); unused losses carry forward. On sale, claimed depreciation is recaptured at up to 25%, and gains may owe capital-gains tax (a 1031 exchange can defer both). Figures are a year-1 estimate at your 24.0% rate — not tax advice; consult a CPA.
Schools (NCES district)
- District
- St. Charles R-VI
- NCES district ID
- 2928920
- Math proficiency
- 44% ▼ -4.00%
- Reading proficiency
- 52% ▼ -1.00%
- Median HH income
- $52,897
- Composite
- 41.38/100
- National rank
- #3486
- State rank
- #51 of 324 in MO
Livability — St. Charles
No livability data for this city. (Only ~50 U.S. cities are tracked.)
Census & demographics
- Census place
- St. Charles, MO
- County
- Saint Charles County · 399,703 people
- Metro
- St. Louis, MO-IL
- Population (ZIP)
- 52,667
- Household income
- $85,308
- Rent vs Own
- Severe rent burden
- 1118.0
Population outlook (St. Charles County) Hauer SSP2
- Today (2025)
- 437,857 people
- By 2030
- 461,707 · +5.4%
- By 2040
- 503,222 · +14.9%
- By 2050
- 534,684 · +22.1%
- By 2075
- 597,047 · +36.4%
- By 2100
- 609,682 · +39.2%
Race, ethnicity, and origin ACS 2023
- Neighborhood character
- Predominantly White (80%)
- Race & ethnicity
- White 80% Black 7% Two or more races 7% Hispanic / Latino 7% Asian 2%
- Hispanic origin (detail)
- Mexican 4%
- Common ancestry
- Lithuanian 3% Romanian 2% Italian 2%
- Foreign-born
- 5% · Canada, Guatemala
- Languages at home
- 93% English-only · Spanish 4%
Political lean MEDSL · St. Charles
- 2024 margin
- R (+17.0) · D 40.8% · R 57.8% · Other 1.4%
- 2008→2024 swing
- -7.2pp toward R · 2008: -9.7pp · 2024: -17.0pp
- All cycles
- 2024: R+17.0 2020: R+17.5 2016: R+26.4 2012: R+21.0 2008: R+9.7
Not yet ingested
- Civics
- —
Market trends
- HPI YoY
- ▼ -289.53%
- Current HPI
- 221.0637
- Rent YoY
- ▲ 3.20%
- Metro
- St. Louis, MO-IL
- State GDP YoY
- ▲ 1.84%
- F500 in state
- 20
Industry mix (Fortune 500 HQ in MO)
| Industry | F500 HQs | Revenue |
|---|---|---|
| Healthcare | 1 | $163B |
|
||
| Insurance | 1 | $21B |
|
||
| Industrial Technology | 1 | $17B |
|
||
| Retail | 1 | $16B |
|
||
| Industrial Distribution | 1 | $10B |
|
||
| Utilities | 1 | $9B |
|
||
Price history
+307.1% since first listed6 events — show timeline
- 2026-06-04 Sold (MLS) — MARIS as Distributed by MLS Grid
- 2026-05-18 Pending — MARIS as Distributed by MLS Grid
- 2026-05-15 Listed $285,000 MARIS as Distributed by MLS Grid
- 2026-05-09 Coming Soon $285,000 MARIS as Distributed by MLS Grid
- 2005-08-18 Sold (Public Records) — Public Records
- 1991-12-01 Sold (Public Records) $70,000 Public Records
Property tax history
+2.5%/yrLatest (2025): $2,463 · +1.5% YoY. Source: county tax records.
Cash-flow waterfall
monthlySold comps — $/sqft
last 12 mo · ≤1 miLoading sold comps…