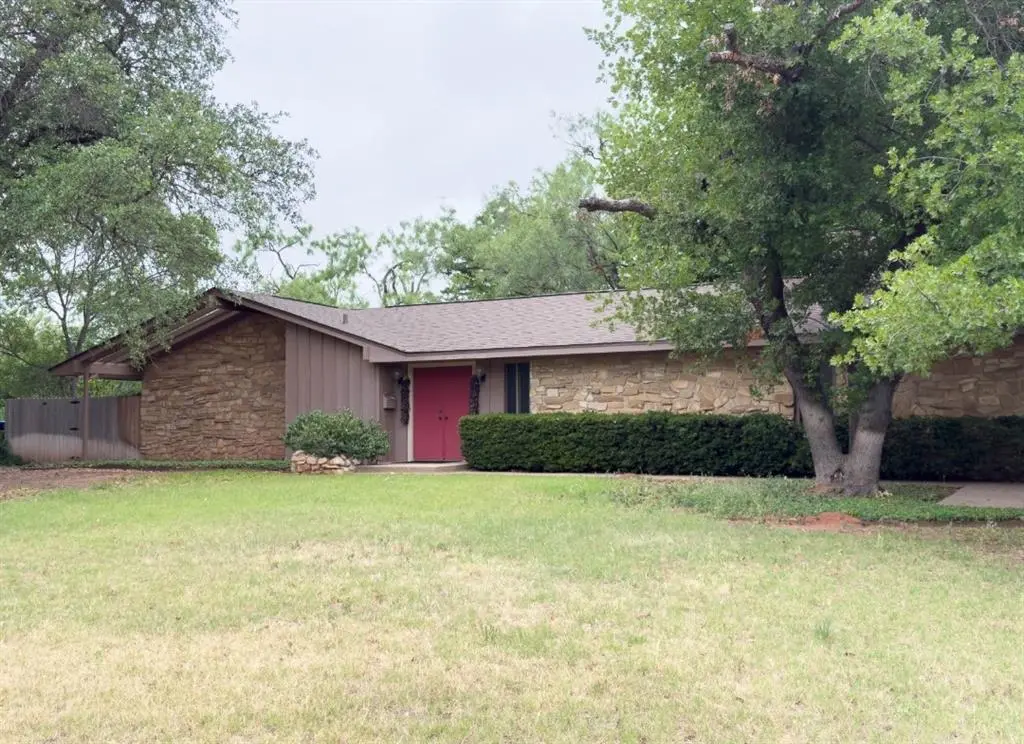
2134 River Oaks Cir · Abilene, TX
Flood risk 4/10 · Minor
- FEMA flood zone
- X (unshaded)
- Chance of flooding over 30 yrs
- 0.21%
- Est. flood insurance / yr
- $507 – $1,088
Fire risk 2/10 · Minimal
- Est. fire insurance / yr
- $1,222 – $2,270
Heat risk 6/10 · Moderate
- Hot days now (above 104°F)
- 7 days/yr
- Hot days in 30 yrs
- 21 days/yr
Wind risk 4/10 · Minor
- Chance of severe wind over 30 yrs
- 11.0%
Air-quality risk 1/10 · Minimal
- Unhealthy air days now
- 0 days/yr
- Unhealthy air days in 30 yrs
- 0 days/yr
Risk factors via First Street. Map © Google.
Why this score? — see what drove the D grade
The composite is a weighted blend of 9 inputs, each scored 0–100. Each bar is that input's sub-score; the figure is the points it added to the 100-point composite (weight × sub-score).
- Cash flow +12.4/30.0
- ARV discount +9.0/15.0
- Rent growth +5.0/5.0
- 1% rule +4.1/10.0
- Livability +3.8/5.0
- DSCR +3.7/10.0
- Schools +2.8/10.0
- Condition / age +2.5/5.0
- Appreciation +0.0/10.0
$299,900
🖨 Deal sheet 📄 Offer letter ✓ Due diligence
Listing remarks
Welcome to 2134 River Oaks Circle, a lovely mid-century modern home nestled in the highly desireable River Oaks neighborhood. This spacious 4 bedroom, 2.5 bath home offers timeless character with beautiful stone accents, warm architectral details, and an inviting layout designed for comfortable living. Enjoy relaxing mornings or peaceful evenings in the sunroom overlooking the property's beautiful setting. Situated on a great lot in a quiet, established neighborhood, this home combines charm, space, and location all in one. A wonderful opportunity to own a distinctive home full of style and personality in one of the area's most sought-after communities.
Key facts
- Distinctive home
- Stone accents
- 0.74 acre lot
Tags
Property features AI
Finance
- Financial info: Listing terms: Cash or Conventional; Loan type: Treat As Clear; Second mortgage: No
- HOA & community: No association
Exterior
- Parking: Carport (2 covered spaces); Driveway parking; Off-street parking
- Utilities: City water; City sewer; Electricity available; Individual gas meter; Cable available; Curbs; Municipal utility district
- Home design: Single family residence; Residential property; One story; Built in 1962; Subdivision: River Oaks; Facing / entry level: 1
- Construction: Rock/stone and wood exterior materials; Composition roof; Slab foundation; Year built: 1962
- Exterior features: Cul-de-sac location; Interior and irregular lot; Large backyard with grass; Many trees; Covered patios/porches; Fencing: Other
Interior
- Kitchen: Gas cooktop; Double oven
- Bedrooms: Primary bedroom on level 1 with ensuite bath, separate shower, shower body sprays, and walk-in closet(s); Two additional bedrooms on level 1
- Flooring: Carpet; Tile; Wood
- Bathrooms: Two full bathrooms; One half bathroom
- Heating & cooling: Central heating; Central air conditioning
- Interior features: Pantry; Walk-in closet(s); Two living areas; One dining area; Room count: 11; Levels: One; Solarium / Sunroom; Covered porch(es)
- Laundry & utility: Utility room; Washer hookup
Neighborhood map
What this means for you Summary
Snapshot
- This is a 3-bed/2.5-bath single-family listed at $300k.
Deal economics
- At list price, monthly cash flow is $-49 ($-582/yr) — negative.
- To cash-flow at today's rent, offer at most $291k (2.9% below list).
- To meet the 1% rule (rent ≥ 1% of price), the offer needs to be $272k (9.4% below list).
- Recommended offer: $272k (9.4% below list) — sets the bar for 1% rule.
Location & tenants
- Location reads 75/100 on livability (#142 in TX, #4,037 nationally) — a middle-class / working-renter tenant base. Strengths: cost of living A+, housing A+, health & safety A+; Watch: crime D, commute F.
- Abilene ISD (urban): math 32% / reading 34% proficiency, ranked #575 of 826 in TX (top 70%) — families likely to look elsewhere, expect single-tenant / working-renter base with shorter leases.
- Zoned schools: Austin El (math 48% / reading 49%, grade D, #950 of 4,322 statewide, top 22%, 724 students, 60% FRL) — zoned schools at 60% FRL track the district average.
- Zoned-school proficiency averages 48% at this address vs 33% district-wide (+16 pts) — the actual schools serving this property are materially stronger than the Abilene ISD average implies; a family-tenant draw the district grade alone would hide.
- Market conditions: Rents rising fast (+32.1%/yr); 109 active listings in the ZIP; 5 comparable units currently listed for rent nearby; rentals lingering (median 44d on market — plan ~5-8 weeks vacancy on turnover, expect pricing pressure); 60% of comp listings sitting > 30 days — soft ceiling on asking rent; 508 units permitted in Taylor County in 2024 (0 in 5+ unit buildings).
- At $2,718/mo this rent would consume 52% of the median local household income ($63k/yr) (locally 1096% of renters already pay >50% of income on rent) — very limited rent-growth headroom before tenants either downsize or default.
Forward outlook
- Local home prices are declining (-3.0%/yr); year-one equity from $2k of loan paydown is wiped out by about $9k of value loss. Plan a longer hold.
- Taylor County population projected at +16% by 2050 — long-run rental-demand tailwind backs the buy-and-hold thesis.
Negotiation context
- Only 6 days on market — expect competitive offers; lowballing is unlikely to land.
Risks & watch-outs
- Climate carrying-cost: extreme-heat days projected 7→21/yr by 2055 (HVAC capex compounding) — expect insurance premiums to compound above CPI over the hold.
Questions for the listing agent
- What do current leases actually rent for vs. the listed asking? Can we see a recent rent roll and the last 12 months of T-12 income?
- Built in 1962 — when were the roof, HVAC, electrical panel, plumbing, and water heater last replaced?
- Is there a deadline driving the sale (1031 exchange, divorce, estate, relocation)? That informs how much negotiation room exists.
- Schools are D-rated, which usually means shorter tenancies and higher turnover. Who's the typical renter profile here, and what's been the actual vacancy rate?
- Crime grade is D in this area — have there been break-ins, vandalism, or insurance claims at this property in the last 3 years? What carrier currently insures it and at what premium?
- The area grade is low — what's the realistic commute time and amenity access for the typical tenant pool here? Any planned neighborhood developments (good or bad) we should know about?
- What's the average days-on-market for RENTAL listings here right now (not sales)? A rising rental-DOM trend means longer vacancies and softer asking-rent achievability than the comps imply.
- What's the recent tenant-quality profile in this submarket — average credit score on applications, eviction rate, late-payment / NSF rate, and stable-employment percentage? A property-management company in the area should have these aggregated.
- How much new for-sale + rental construction is in the pipeline within 1–3 miles? Heavy new supply typically softens prices + rents 12–24 months out; constrained supply supports both.
Investment metrics
- 1% rule
- 0.91% ✗
- Cap rate
- 6.10%
- Cash-on-cash
- -0.69%
- DSCR
- 0.97
- GRM
- 9.2
CMA / ARV
- ARV (on-the-fly)
- $310,270
- Comps found
- 12
Show comp detail 12 sales within ~0.75 mi
| Address | Dist | Beds/Ba | Sqft | Sold | Price | $/sf | Match |
|---|---|---|---|---|---|---|---|
| 2150 Brook Hollow Dr | 0.33mi | 4/3.0 (+1) | 2,202 (+1%) | 2mo | $339,900 | $154 | 74 |
| 2049 Post Oak Rd | 0.42mi | 3/2.0 | 2,091 (-4%) | 1mo | $319,900 | $153 | 70 |
| 1318 Westridge Dr | 0.65mi | 3/2.0 | 2,086 (-4%) | 0mo | $305,000 | $146 | 60 |
| 2118 Brentwood Dr | 0.48mi | 3/2.0 | 2,040 (-7%) | 6mo | $280,000 | $137 | 60 |
| 4034 Brook Hollow Dr | 0.69mi | 4/2.0 (+1) | 2,152 (-2%) | 0mo | $299,000 | $139 | 58 |
| 2401 Windsor Rd | 0.47mi | 3/2.5 | 2,380 (+9%) | 8mo | $368,900 | $155 | 56 |
| 4102 Hartford St | 0.59mi | 3/2.0 | 2,063 (-6%) | 6mo | $275,000 | $133 | 56 |
| 2234 Brentwood Dr | 0.51mi | 3/2.0 | 1,920 (-12%) | 1mo | $199,900 | $104 | 53 |
| 2102 Woodridge Dr | 0.60mi | 4/2.0 (+1) | 2,367 (+8%) | 1mo | $312,444 | $132 | 50 |
| 3915 S 20th St | 0.49mi | 4/2.0 (+1) | 2,485 (+14%) | 2mo | $399,900 | $161 | 46 |
| 2318 Brentwood Dr | 0.55mi | 3/2.0 | 1,894 (-13%) | 9mo | $255,000 | $135 | 43 |
| 2050 Brentwood Dr | 0.46mi | 4/3.0 (+1) | 2,473 (+13%) | 9mo | $350,000 | $142 | 42 |
Match score weights: distance 35% · size 25% · config 20% · recency 20%. Top-matched comps best support the ARV.
Projected returns pro-forma
-3.0% appreciation · 8.0% rent growth · sell at horizon
- IRR
- -11.6%
- Equity multiple
- 0.56×
- Total profit
- $-37,208
- Equity at exit
- $44,716
- IRR
- 3.9%
- Equity multiple
- 1.35×
- Total profit
- $29,467
- Equity at exit
- $25,930
Cash invested: $83,972 (down + closing). Projections, not guarantees.
Landlord ↔ Tenant lean methodology
- Overall (STATE)
- 87 Strongly Landlord-Friendly
- State Texas
- 87 Strongly Landlord-Friendly · R+5
- County
- — inherits STATE
- City
- — inherits STATE
ZIP-level market 79605
- Rents YoY
- 32.1%
- Active inventory
- 109
- Price-to-rent
- 9.2×
Monthly cashflow live
- Estimated rent
- $2,718 high interval (Pro) →
- Mortgage (P&I)
- −$1,573
- Tax from tax record
- −$498 /mo · $5,975/yr
- Insurance
- −$125
- HOA
- −$0
- Vacancy / Maint / Mgmt
- −$571
- Net cashflow
- $-49
Break-even live
UW: 25.0% down · 7.5% · 30yr · 1.5% tax · 5.0% vac · 8.0% maint · 8.0% mgmt
Financing live
Cash to close
- Down payment
- $74,975
- Closing costs
- $8,997
- Reserves months
- —
- Total cash needed
- —
Loan-product check · same deal, 3 products live
Conventional
25% down · 7.5% · 30yr
- Down + closing
- —
- Monthly P&I
- —
- Monthly cashflow
- —
- DSCR
- —
- Eligible?
- —
Personal DTI + credit; lowest rate.
DSCR
20% down · 8.5% · 30yr
- Down + closing
- —
- Monthly P&I
- —
- Monthly cashflow
- —
- DSCR
- —
- Eligible?
- —
No personal income docs; deal must DSCR.
Hard money
10% down · 12.0% · 12mo
- Down + closing
- —
- Monthly P&I
- —
- Monthly cashflow
- —
- DSCR
- —
- Eligible?
- —
Short-term bridge; refi at stabilization.
Rent comps 5 comps
| Address | Beds | Baths | Sqft | Rent | $/sqft | DOM | Units | Dist |
|---|---|---|---|---|---|---|---|---|
| 2301 Post Oak Rd Abilene, TX | 3.0 | 2.0 | 1915 | $3,295 | $1.72 | 20d | 1 | 0.51mi |
| 25 Juniper Cir Abilene, TX | 4.0 | 3.0 | 2557 | $3,500 | $1.37 | 43d | 1 | 1.02mi |
| 3373 S 27th St Abilene, TX | 2.0 | 2.0 | 1436 | $1,700 | $1.18 | 43d | 1 | 1.10mi |
| 3409 High Meadows Dr Abilene, TX | 3.0 | 2.0 | 1987 | $2,995 | $1.51 | 20d | 1 | 1.26mi |
| 3302 Shelby Rd Abilene, TX | 3.0 | 2.0 | 1582 | $3,195 | $2.02 | 43d | 1 | 1.31mi |
Listing history 6 events
-
2026-06-13statusdays on market $299,900 Pending 6 DOM
-
2026-06-10days on market $299,900 Active Option Contract 5 DOM
-
2026-06-09days on market $299,900 Active Option Contract 4 DOM
-
2026-06-08statusdays on market $299,900 Active Option Contract 3 DOM
-
2026-06-07remarks 661-char remark
-
2026-06-07$299,900 Active 2 DOM
ⓘ Source: listings_history table (triggers on properties + properties_extension) + one-shot
backfill from property_details.listing_events for pre-trigger history.
Tax reassessment forecast TX · Resets to sale price
- Current annual tax
- $5,975 · $498/mo
- Projected year-2 tax
- $5,975 · $498/mo
- Expected delta
- $0/yr ($0/mo · -0.0%)
ⓘ Screening estimate from a state-policy table — verify with the county assessor before closing.
Climate risk First Street
- Flood 4/10 Moderate FEMA zone X (unshaded) · 21% chance over 30 yrs
- Wildfire 2/10 Low
- Heat 6/10 Major 7 d/yr ≥104°F today · 21 d/yr by 30 yrs out
- Wind 4/10 Moderate 11% chance of damaging wind over 30 yrs
- Air quality 1/10 Low 0 unhealthy d/yr today · 0 by 30 yrs out
Nearby sold comps map
Loading sold comps map…
Walkable amenities ~0.75 mi
Loading nearby amenities…
Taxation est. · year 1
- Rental income
- $32,614
- − Mortgage interest
- −$16,799
- − Property taxes
- −$5,975
- − Insurance
- −$1,500
- − Repairs & maintenance
- −$2,609
- − Management
- −$2,609
- − Depreciation
- −$8,724
- Taxable loss
- −$5,603
- Est. tax savings @ 24.0%
- +$1,345
- After-tax cash flow
- $762/yr
For passive investors: Depreciation is non-cash, so a rental often shows a tax loss while cash-flowing — sheltering income. Rental losses are passive: they offset passive income freely, and up to $25,000/yr can offset ordinary (W-2) income if you actively participate and your MAGI is under $100k (phasing out to $0 by $150k); unused losses carry forward. On sale, claimed depreciation is recaptured at up to 25%, and gains may owe capital-gains tax (a 1031 exchange can defer both). Figures are a year-1 estimate at your 24.0% rate — not tax advice; consult a CPA.
Schools (NCES district)
- District
- Abilene ISD
- NCES district ID
- 4807440
- Math proficiency
- 32% ▼ -11.00%
- Reading proficiency
- 34% ▼ -5.00%
- Median HH income
- $39,782
- Composite
- 27.71/100
- National rank
- #6909
- State rank
- #575 of 826 in TX
Livability — Abilene
- Score
- 75/100
- State rank
- #142
- US rank
- #4037
Category grades
Schools grade is shown separately in the Schools card above.
Census & demographics
- Census place
- Abilene, TX
- County
- Taylor County · 136,672 people
- City population
- 136,672
- Metro
- Abilene, TX
- Population (ZIP)
- 28,467
- Household income
- $62,929
- Rent vs Own
- Severe rent burden
- 1096.0
Population outlook (Taylor County) Hauer SSP2
- Today (2025)
- 145,270 people
- By 2030
- 150,050 · +3.3%
- By 2040
- 159,417 · +9.7%
- By 2050
- 168,883 · +16.3%
- By 2075
- 194,436 · +33.8%
- By 2100
- 203,163 · +39.9%
Race, ethnicity, and origin ACS 2023
- Neighborhood character
- Majority White (63%)
- Race & ethnicity
- White 63% Hispanic / Latino 22% Two or more races 12% Black 8% Asian 2%
- Hispanic origin (detail)
- Mexican 19%
- Common ancestry
- Slovak 2% Lithuanian 1% Serbian 1%
- Foreign-born
- 6% · Canada
- Languages at home
- 84% English-only · Spanish 14% German/W. Germanic 1% Other Asian/Pacific 0%
Political lean MEDSL · Taylor
- 2024 margin
- Solid R (+49.8) · D 24.6% · R 74.4% · Other 1.0%
- 2008→2024 swing
- -4.2pp toward R · 2008: -45.6pp · 2024: -49.8pp
- All cycles
- 2024: R+49.8 2020: R+45.3 2016: R+51.1 2012: R+53.6 2008: R+45.6
Not yet ingested
- Civics
- —
Market trends
- HPI YoY
- ▼ -181.75%
- Current HPI
- 201.2341
- Rent YoY
- ▲ 32.08%
- Metro
- Abilene, TX
- State GDP YoY
- ▲ 3.95%
- F500 in state
- 110
Industry mix (Fortune 500 HQ in TX)
| Industry | F500 HQs | Revenue |
|---|---|---|
| Energy | 16 | $1,198B |
|
||
| Technology | 5 | $198B |
|
||
| Engineering / Construction | 4 | $72B |
|
||
| Energy Services | 3 | $60B |
|
||
| Utilities | 3 | $41B |
|
||
| Healthcare | 2 | $330B |
|
||
Price history
1 event — show timeline
- 2026-05-21 Listed $299,900 NTREIS
Property tax history
+2.8%/yrLatest (2025): $5,975 · -0.2% YoY. Source: county tax records.
Cash-flow waterfall
monthlySold comps — $/sqft
last 12 mo · ≤1 miLoading sold comps…