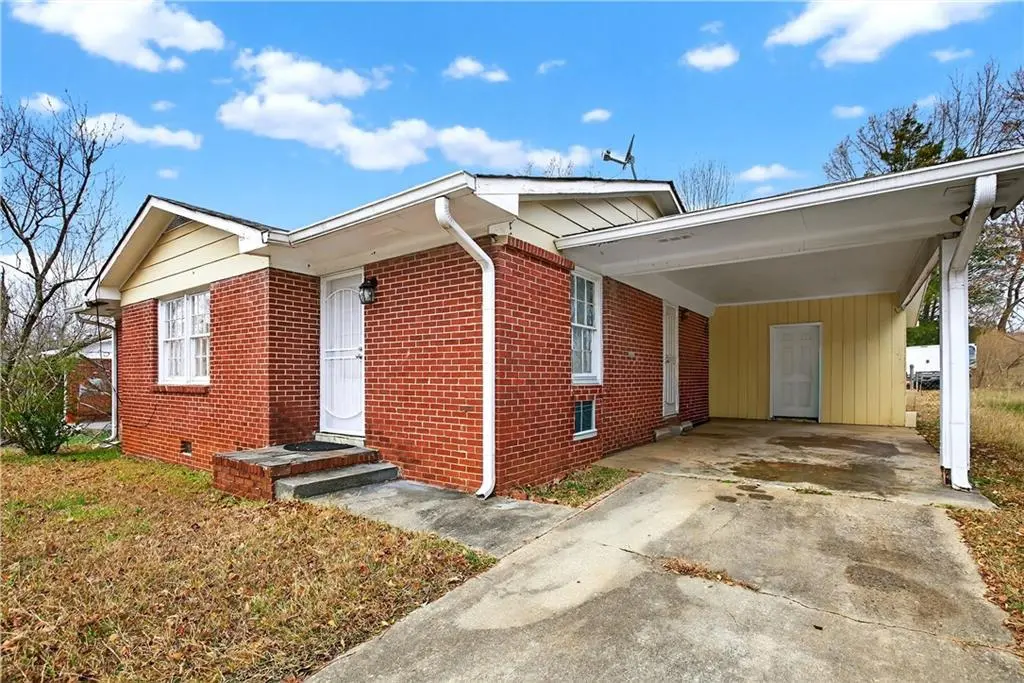
1742 Cardinal Rd · Bonanza, GA
Flood risk 1/10 · Minimal
- FEMA flood zone
- X (unshaded)
- Chance of flooding over 30 yrs
- 0.0%
- Est. flood insurance / yr
- $507 – $1,088
Fire risk 2/10 · Minimal
- Est. fire insurance / yr
- $963 – $1,789
Heat risk 6/10 · Moderate
- Hot days now (above 105°F)
- 7 days/yr
- Hot days in 30 yrs
- 18 days/yr
Wind risk 6/10 · Moderate
- Chance of severe wind over 30 yrs
- 27.0%
Air-quality risk 4/10 · Minor
- Unhealthy air days now
- 5 days/yr
- Unhealthy air days in 30 yrs
- 6 days/yr
Risk factors via First Street. Map © Google.
Why this score? — see what drove the C- grade
The composite is a weighted blend of 9 inputs, each scored 0–100. Each bar is that input's sub-score; the figure is the points it added to the 100-point composite (weight × sub-score).
- Cash flow +18.7/30.0
- ARV discount +15.0/15.0
- DSCR +5.9/10.0
- 1% rule +5.4/10.0
- Livability +3.1/5.0
- Rent growth +3.0/5.0
- Condition / age +2.5/5.0
- Schools +1.3/10.0
- Appreciation +0.0/10.0
$174,900
🖨 Deal sheet 📄 Offer letter ✓ Due diligence
Listing remarks MLS
Welcome to this 3-bedroom, 2-bath home built in 1964. Full of potential and ready for its next chapter, this property is being sold AS IS—a great opportunity to make it your own.
Key facts
- 0.28 acre lot
- Parking
- Built 1964
Neighborhood map
What this means for you Summary
Snapshot
- This is a 3-bed/2.0-bath single-family listed at $175k.
Deal economics
- At list price, monthly cash flow is $173 ($2k/yr) — positive.
- The deal already cash-flows at list — no discount required.
- Meets the 1% rule at list price ($2k rent vs $175k).
- Recommended offer: $154k (12.0% below list) — sets the bar for market timing.
- Cap rate 7.5% vs local median 5.2% in Bonanza — top-decile yield for the area; either an underpriced asset or a hidden risk that comps aren't pricing in. Stress-test before assuming the spread holds.
Location & tenants
- Location reads 62/100 on livability (#314 in GA) — a middle-class / working-renter tenant base. Strengths: cost of living A+, housing A+, crime A; Watch: employment C-, schools F, amenities F.
- Clayton County (suburban): math 11% / reading 20% proficiency, ranked #155 of 174 in GA (top 89%) — low school quality limits family demand, transient renter base, plan for 1-2y turnover; 78% free/reduced lunch — lower-income household profile, screen leases tightly.
- Market conditions: Rents rising (+2.1%/yr); 251 active listings in the ZIP; 37 comparable units currently listed for rent nearby; rentals lingering (median 44d on market — plan ~5-8 weeks vacancy on turnover, expect pricing pressure); 54% of comp listings sitting > 30 days — soft ceiling on asking rent; 865 units permitted in Clayton County in 2024 (448 in 5+ unit buildings).
- This rent runs 35% of the median local income ($62k/yr) — at the standard rent-burdened threshold; future hikes will face affordability resistance.
Forward outlook
- Local home prices are declining (-3.0%/yr); year-one equity from $1k of loan paydown is wiped out by about $5k of value loss. Plan a longer hold.
- Clayton County population projected at +29% by 2050 — long-run rental-demand tailwind backs the buy-and-hold thesis.
Negotiation context
- It's been on market 164 days — a 12% lower offer ($154k) is reasonable based on typical stale-listing flexibility.
- 2 sale attempts; this cycle's ask has dropped $10k (5%) from the opening price — seller is motivated, your offer sets the floor, not the list.
- Current owner paid $125k; 40% above their basis — modest negotiation headroom, anchor on the comps not their cost.
Risks & watch-outs
- Climate carrying-cost: major wind risk, 27% chance of damaging wind over 30y; extreme-heat days projected 7→18/yr by 2055 (HVAC capex compounding) — expect insurance premiums to compound above CPI over the hold.
Questions for the listing agent
- It's been on market 164 days. Have you received any prior offers? Is the seller open to a 12% concession, seller financing, or rate buy-down credit?
- Built in 1964 — when were the roof, HVAC, electrical panel, plumbing, and water heater last replaced?
- Why hasn't it sold? Are there any deal-killer items the seller is aware of (foundation, flood, title, zoning, code violations)?
- Is there a deadline driving the sale (1031 exchange, divorce, estate, relocation)? That informs how much negotiation room exists.
- Schools are F-rated, which usually means shorter tenancies and higher turnover. Who's the typical renter profile here, and what's been the actual vacancy rate?
- What's the average days-on-market for RENTAL listings here right now (not sales)? A rising rental-DOM trend means longer vacancies and softer asking-rent achievability than the comps imply.
- What's the recent tenant-quality profile in this submarket — average credit score on applications, eviction rate, late-payment / NSF rate, and stable-employment percentage? A property-management company in the area should have these aggregated.
- How much new for-sale + rental construction is in the pipeline within 1–3 miles? Heavy new supply typically softens prices + rents 12–24 months out; constrained supply supports both.
Investment metrics
- 1% rule
- 1.04% ✓
- Cap rate
- 7.48%
- Cash-on-cash
- 4.24%
- DSCR
- 1.19
- GRM
- 8.0
CMA / ARV
- ARV (median comp)
- $239,969
- List price
- $174,900
- Delta
- -27.12%
- Verdict
- UNDERPRICED
- Comps
- 20 within 1.0 mi
Show comp detail 6 sales within ~0.75 mi
| Address | Dist | Beds/Ba | Sqft | Sold | Price | $/sf | Match |
|---|---|---|---|---|---|---|---|
| 1697 Cardinal Rd | 0.10mi | 3/1.5 | 1,072 (-3%) | 1mo | $177,000 | $165 | 86 |
| 1685 Pheasant Dr | 0.14mi | 3/1.5 | 1,109 (0%) | 9mo | $189,900 | $171 | 84 |
| 1683 Spoonbill Rd | 0.25mi | 3/2.5 | 1,104 (-0%) | 5mo | $160,000 | $145 | 81 |
| 1520 Towhee Ct | 0.44mi | 3/2.0 | 1,134 (+2%) | 17mo | $206,000 | $182 | 62 |
| 10839 Mallard Dr | 0.52mi | 3/2.0 | 1,265 (+14%) | 11mo | $208,000 | $164 | 43 |
| 10859 Panhandle Rd | 0.70mi | 2/1.0 (-1) | 1,232 (+11%) | 6mo | $190,000 | $154 | 34 |
Match score weights: distance 35% · size 25% · config 20% · recency 20%. Top-matched comps best support the ARV.
Projected returns pro-forma
-3.0% appreciation · 2.06% rent growth · sell at horizon
- IRR
- -10.7%
- Equity multiple
- 0.61×
- Total profit
- $-18,962
- Equity at exit
- $26,078
- IRR
- -2.8%
- Equity multiple
- 0.82×
- Total profit
- $-8,932
- Equity at exit
- $15,122
Cash invested: $48,972 (down + closing). Projections, not guarantees.
Landlord ↔ Tenant lean methodology
- Overall (STATE)
- 90 Strongly Landlord-Friendly
- State Georgia
- 90 Strongly Landlord-Friendly · R+3
- County
- — inherits STATE
- City
- — inherits STATE
ZIP-level market 30238
- Home prices YoY
- -33.3%
- Rents YoY
- 2.1%
- Active inventory
- 251
- Price-to-rent
- 8.0×
Monthly cashflow live
- Estimated rent
- $1,818 high interval (Pro) →
- Mortgage (P&I)
- −$917
- Tax from tax record
- −$273 /mo · $3,275/yr
- Insurance
- −$73
- HOA
- −$0
- Vacancy / Maint / Mgmt
- −$382
- Net cashflow
- $173
Break-even live
UW: 25.0% down · 7.5% · 30yr · 1.5% tax · 5.0% vac · 8.0% maint · 8.0% mgmt
Financing live
Cash to close
- Down payment
- $43,725
- Closing costs
- $5,247
- Reserves months
- —
- Total cash needed
- —
Loan-product check · same deal, 3 products live
Conventional
25% down · 7.5% · 30yr
- Down + closing
- —
- Monthly P&I
- —
- Monthly cashflow
- —
- DSCR
- —
- Eligible?
- —
Personal DTI + credit; lowest rate.
DSCR
20% down · 8.5% · 30yr
- Down + closing
- —
- Monthly P&I
- —
- Monthly cashflow
- —
- DSCR
- —
- Eligible?
- —
No personal income docs; deal must DSCR.
Hard money
10% down · 12.0% · 12mo
- Down + closing
- —
- Monthly P&I
- —
- Monthly cashflow
- —
- DSCR
- —
- Eligible?
- —
Short-term bridge; refi at stabilization.
Rent comps 37 comps
| Address | Beds | Baths | Sqft | Rent | $/sqft | DOM | Units | Dist |
|---|---|---|---|---|---|---|---|---|
| 10624 Woodcock St Jonesboro, GA | 4.0 | 2.0 | 1171 | $1,670 | $1.43 | 22d | 1 | 0.14mi |
| 1546 Plover Rd Jonesboro, GA | 4.0 | 3.0 | 1040 | $1,730 | $1.66 | 43d | 1 | 0.31mi |
| 10903 Thrasher Rd Hampton, GA | 3.0 | 2.0 | 1412 | $1,725 | $1.22 | 22d | 1 | 0.33mi |
| 1556 Wren Rd Jonesboro, GA | 3.0 | 2.0 | 1388 | $1,715 | $1.24 | 43d | 1 | 0.43mi |
| 1496 Paladin Ct Hampton, GA | 4.0 | 2.5 | 1116 | $2,045 | $1.83 | 19d | 1 | 0.47mi |
| 1652 Thorn Ridge Trl Hampton, GA | 3.0 | 2.0 | 1360 | $1,960 | $1.44 | 43d | 1 | 0.54mi |
| 10911 Tara Blvd Lovejoy, GA | 1.0–3.0 | 1.0–2.0 | 1150 | $1,795 | $1.56 | 43d | 1 | 0.58mi |
| 10784 Knotty Pine Pl Hampton, GA | 3.0 | 2.0 | 1329 | $1,795 | $1.35 | 43d | 1 | 0.62mi |
| 1478 Carriage Ln Jonesboro, GA | 3.0 | 2.0 | 1436 | $1,675 | $1.17 | 22d | 1 | 0.63mi |
| 11035 Shannon Cir Hampton, GA | 3.0 | 2.0 | 1320 | $1,606 | $1.22 | 12d | 1 | 0.70mi |
| 1374 Misty Ridge Ct Hampton, GA | 3.0 | 2.0 | 1250 | $1,775 | $1.42 | 43d | 1 | 0.72mi |
| 11015 Tara Blvd Lovejoy, GA | 1.0–3.0 | 1.0–2.0 | 1113 | $1,815 | $1.63 | 43d | 1 | 0.75mi |
| 1786 Old Dogwood Jonesboro, GA | 3.0 | 2.5 | 1454 | $1,730 | $1.19 | 43d | 1 | 0.76mi |
| 1798 Old Dogwood Jonesboro, GA | 3.0 | 3.0 | 1454 | $1,730 | $1.19 | 24d | 1 | 0.77mi |
| 1814 Old Dogwood Jonesboro, GA | 3.0 | 2.5 | 1454 | $1,730 | $1.19 | 43d | 1 | 0.78mi |
| 1779 Old Dogwood Jonesboro, GA | 3.0 | 2.5 | 1454 | $1,730 | $1.19 | 43d | 1 | 0.78mi |
| 1830 Old Dogwood Jonesboro, GA | 3.0 | 2.5 | 1454 | $1,730 | $1.19 | 43d | 1 | 0.79mi |
| 1834 Old Dogwood Jonesboro, GA | 3.0 | 2.5 | 1454 | $1,730 | $1.19 | 43d | 1 | 0.79mi |
| 1795 Old Dogwood Jonesboro, GA | 3.0 | 3.0 | 1454 | $1,730 | $1.19 | 43d | 1 | 0.79mi |
| 10346 Wisteria Ln Jonesboro, GA | 3.0 | 2.0 | 1042 | $1,595 | $1.53 | 12d | 1 | 0.83mi |
| 10357 Briarbay Dr Jonesboro, GA | 3.0 | 2.0 | 1180 | $1,610 | $1.36 | 2d | 1 | 0.87mi |
| 1545 Iris Walk Jonesboro, GA | 3.0 | 3.0 | 1453 | $1,800 | $1.24 | 24d | 1 | 0.87mi |
| 10299 Wisteria Ln Jonesboro, GA | 3.0 | 2.0 | 1257 | $1,770 | $1.41 | 43d | 1 | 0.92mi |
| 1591 Elizabeth Ln Hampton, GA | 3.0 | 2.0 | 1352 | $1,591 | $1.18 | 43d | 1 | 0.93mi |
| 10375 Larrack Trce Jonesboro, GA | 3.0 | 2.0 | 1340 | $1,800 | $1.34 | 17d | 1 | 0.97mi |
| 1485 Bola Ct Jonesboro, GA | 4.0 | 2.0 | 1300 | $1,780 | $1.37 | 5d | 1 | 1.06mi |
| 10485 Ace Ct Jonesboro, GA | 3.0 | 2.0 | 1288 | $1,611 | $1.25 | 43d | 1 | 1.07mi |
| 1277 Iron Gate Blvd Jonesboro, GA | 3.0 | 2.0 | 1120 | $1,499 | $1.34 | 2d | 1 | 1.08mi |
| 1260 Iron Gate Blvd Jonesboro, GA | 3.0 | 2.0 | 1460 | $1,745 | $1.20 | 19d | 1 | 1.13mi |
| 1433 Iron Gate Blvd Jonesboro, GA | 3.0 | 1.5 | 1075 | $1,475 | $1.37 | 12d | 1 | 1.13mi |
| 1117 Village Crk Jonesboro, GA | 3.0 | 2.5 | 1330 | $1,815 | $1.36 | 43d | 1 | 1.19mi |
| 10091 Silent Trl Jonesboro, GA | 3.0 | 1.5 | 1456 | $1,395 | $0.96 | 24d | 1 | 1.21mi |
| 1334 Labelle St Jonesboro, GA | 4.0 | 2.0 | 1352 | $1,521 | $1.12 | 5d | 1 | 1.23mi |
| 1108 Sunday Ln Jonesboro, GA | 3.0 | 2.0 | 1137 | $1,625 | $1.43 | 43d | 1 | 1.30mi |
| 1174 Walnut Creek Ln Jonesboro, GA | 3.0 | 2.0 | 1218 | $1,861 | $1.53 | 43d | 1 | 1.33mi |
| 1096 Bonita Cir Jonesboro, GA | 3.0 | 2.0 | 1442 | $1,700 | $1.18 | 24d | 1 | 1.35mi |
| 1781 Fielding Way Lovejoy, GA | 3.0 | 2.5 | 1370 | $1,545 | $1.13 | 43d | 1 | 1.49mi |
Listing history 21 events
-
2026-06-18days on market $174,900 Active 164 DOM
-
2026-06-17days on market $174,900 Active 163 DOM
-
2026-06-16days on market $174,900 Active 162 DOM
-
2026-06-15days on market $174,900 Active 161 DOM
-
2026-06-13days on market $174,900 Active 159 DOM
-
2026-06-09days on market $174,900 Active 155 DOM
-
2026-06-08days on market $174,900 Active 154 DOM
-
2026-06-07days on market $174,900 Active 153 DOM
-
2026-06-04days on market $174,900 Active 150 DOM
-
2026-06-03days on market $174,900 Active 149 DOM
-
2026-06-02days on market $174,900 Active 148 DOM
-
2026-06-01days on market $174,900 Active 147 DOM
-
2026-05-31days on market $174,900 Active 146 DOM
-
2026-04-08price $174,900 184-char remark
Show marketing remark (178 chars)
Welcome to this 3-bedroom, 2-bath home built in 1964. Full of potential and ready for its next chapter, this property is being sold AS IS-a great opportunity to make it your own.
-
2026-04-08price $174,900 178-char remark
Show marketing remark (178 chars)
Welcome to this 3-bedroom, 2-bath home built in 1964. Full of potential and ready for its next chapter, this property is being sold AS IS-a great opportunity to make it your own.
-
2026-01-05$184,900 New 178-char remark
Show marketing remark (184 chars)
Welcome to this 3-bedroom, 2-bath home built in 1964. Full of potential and ready for its next chapter, this property is being sold AS IS—a great opportunity to make it your own.
-
2026-01-05$184,900 Active 184-char remark
Show marketing remark (184 chars)
Welcome to this 3-bedroom, 2-bath home built in 1964. Full of potential and ready for its next chapter, this property is being sold AS IS—a great opportunity to make it your own.
-
2021-05-27soldstatus $125,000
-
2019-02-14soldstatus $80,000
-
2004-08-23soldstatus $66,000
-
1978-06-14soldstatus $23,500
ⓘ Source: listings_history table (triggers on properties + properties_extension) + one-shot
backfill from property_details.listing_events for pre-trigger history.
Tax reassessment forecast GA · Resets to sale price
- Current annual tax
- $3,275 · $273/mo
- Projected year-2 tax
- $3,275 · $273/mo
- Expected delta
- $0/yr ($0/mo · 0.0%)
ⓘ Screening estimate from a state-policy table — verify with the county assessor before closing.
Climate risk First Street
- Flood 1/10 Low FEMA zone X (unshaded) · 0% chance over 30 yrs
- Wildfire 2/10 Low
- Heat 6/10 Major 7 d/yr ≥105°F today · 18 d/yr by 30 yrs out
- Wind 6/10 Major 27% chance of damaging wind over 30 yrs
- Air quality 4/10 Moderate 5 unhealthy d/yr today · 6 by 30 yrs out
Nearby sold comps map
Loading sold comps map…
Walkable amenities ~0.75 mi
Loading nearby amenities…
Taxation est. · year 1
- Rental income
- $21,813
- − Mortgage interest
- −$9,797
- − Property taxes
- −$3,275
- − Insurance
- −$874
- − Repairs & maintenance
- −$1,745
- − Management
- −$1,745
- − Depreciation
- −$5,088
- Taxable loss
- −$712
- Est. tax savings @ 24.0%
- +$171
- After-tax cash flow
- $2,247/yr
For passive investors: Depreciation is non-cash, so a rental often shows a tax loss while cash-flowing — sheltering income. Rental losses are passive: they offset passive income freely, and up to $25,000/yr can offset ordinary (W-2) income if you actively participate and your MAGI is under $100k (phasing out to $0 by $150k); unused losses carry forward. On sale, claimed depreciation is recaptured at up to 25%, and gains may owe capital-gains tax (a 1031 exchange can defer both). Figures are a year-1 estimate at your 24.0% rate — not tax advice; consult a CPA.
Schools (NCES district)
- District
- Clayton County
- NCES district ID
- 1301230
- Math proficiency
- 11% ▼ -13.00%
- Reading proficiency
- 20% ▼ -9.00%
- Median HH income
- $42,266
- Composite
- 13.41/100
- National rank
- #9527
- State rank
- #155 of 174 in GA
Livability — Bonanza
- Score
- 62/100
- State rank
- #314
- US rank
- #16994
Category grades
Schools grade is shown separately in the Schools card above.
Census & demographics
- Census place
- Bonanza, GA
- County
- Clayton County · 230,153 people
- Metro
- Atlanta-Sandy Springs-Alpharetta, GA
- Population (ZIP)
- 43,191
- Household income
- $62,185
- Rent vs Own
- Severe rent burden
- 1992.0
Population outlook (Clayton County) Hauer SSP2
- Today (2025)
- 310,777 people
- By 2030
- 329,762 · +6.1%
- By 2040
- 368,052 · +18.4%
- By 2050
- 401,196 · +29.1%
- By 2075
- 472,488 · +52.0%
- By 2100
- 500,446 · +61.0%
Race, ethnicity, and origin ACS 2023
- Neighborhood character
- Predominantly Black (71%)
- Race & ethnicity
- Black 71% Hispanic / Latino 17% White 7% Two or more races 7%
- Hispanic origin (detail)
- Mexican 13% Puerto Rican 2%
- Foreign-born
- 11% · Canada, United Kingdom
- Languages at home
- 83% English-only · Spanish 14% French/Haitian/Cajun 1%
Political lean MEDSL · Clayton
- 2024 margin
- Solid D (+69.2) · D 84.3% · R 15.1%
- 2008→2024 swing
- +2.8pp toward D · 2008: 66.4pp · 2024: 69.2pp
- All cycles
- 2024: D+69.2 2020: D+70.9 2016: D+71.9 2012: D+70.1 2008: D+66.4
Not yet ingested
- Civics
- —
Market trends
- HPI YoY
- ▼ -105.48%
- Current HPI
- 211.6309
- Rent YoY
- ▲ 2.06%
- Metro
- Atlanta-Sandy Springs-Alpharetta, GA
- State GDP YoY
- ▲ 2.66%
- F500 in state
- 28
Industry mix (Fortune 500 HQ in GA)
| Industry | F500 HQs | Revenue |
|---|---|---|
| Paper / Packaging | 2 | $29B |
|
||
| Retail | 1 | $160B |
|
||
| Transportation / Logistics | 1 | $91B |
|
||
| Airlines | 1 | $62B |
|
||
| Consumer Goods | 1 | $47B |
|
||
| Utilities | 1 | $25B |
|
||
Price history
+644.3% since first listed8 events — show timeline
- 2026-04-08 Price Changed $174,900 FMLS
- 2026-04-08 Price Changed $174,900 GAMLS
- 2026-01-05 Listed $184,900 FMLS
- 2026-01-05 Listed $184,900 GAMLS
- 2021-05-27 Sold (Public Records) $125,000 Public Records
- 2019-02-14 Sold (Public Records) $80,000 Public Records
- 2004-08-23 Sold (Public Records) $66,000 Public Records
- 1978-06-14 Sold (Public Records) $23,500 Public Records
Property tax history
+6.9%/yrLatest (2025): $3,275 · -3.8% YoY. Source: county tax records.
Cash-flow waterfall
monthlySold comps — $/sqft
last 12 mo · ≤1 miLoading sold comps…