 8-Plex
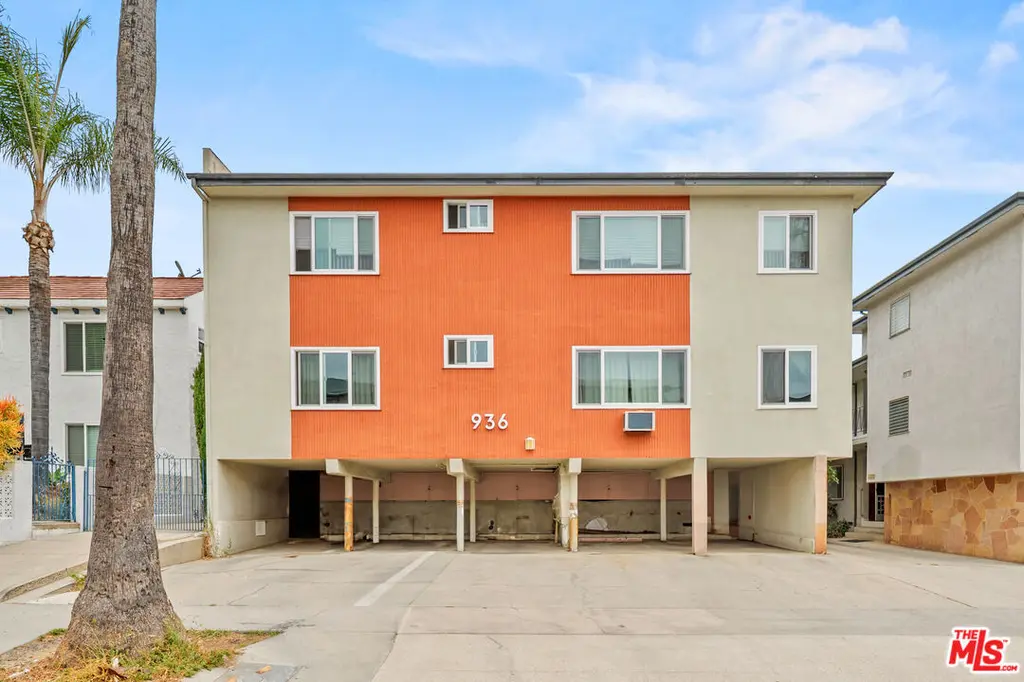
936 N Curson Ave · West Hollywood, CA
Flood risk 1/10 · Minimal
- FEMA flood zone
- X (unshaded)
- Chance of flooding over 30 yrs
- 0.0%
- Est. flood insurance / yr
- $507 – $1,088
Fire risk 1/10 · Minimal
- Est. fire insurance / yr
- $659 – $1,223
Heat risk 7/10 · Major
- Hot days now (above 88°F)
- 8 days/yr
- Hot days in 30 yrs
- 23 days/yr
Wind risk 1/10 · Minimal
- Chance of severe wind over 30 yrs
- —
Air-quality risk 5/10 · Moderate
- Unhealthy air days now
- 7 days/yr
- Unhealthy air days in 30 yrs
- 7 days/yr
Risk factors via First Street. Map © Google.
Why this score? — see what drove the B- grade
The composite is a weighted blend of 9 inputs, each scored 0–100. Each bar is that input's sub-score; the figure is the points it added to the 100-point composite (weight × sub-score).
- Cash flow +29.5/30.0
- DSCR +10.0/10.0
- 1% rule +8.3/10.0
- ARV discount +7.5/15.0
- Condition / age +3.8/5.0
- Schools +3.6/10.0
- Livability +3.5/5.0
- Rent growth +2.1/5.0
- Appreciation +0.0/10.0
$2,299,000
🖨 Deal sheet 📄 Offer letter ✓ Due diligence
Multi-family units
County records classify this as Multi-Family (5+ Unit). Listing-text estimate: 8 units. confirmed
5+ unit building — per-unit beds/baths from public records are typically unavailable; the breakdown below (if shown) is an estimate from the listing text.
Listing remarks
Located in one of Los Angeles' most desirable rental corridors, 936 N Curson Ave presents a rare opportunity to acquire a well-positioned 8-unit multifamily asset just moments from West Hollywood, Melrose Avenue, and Beverly Grove. Priced at a 5.0% cap rate, the property offers strong in-place income, long-term upside potential, and a premier central location. All eight units are fully occupied and providing stable cash flow. Additionally, two units can be delivered vacant, creating immediate upside potential for an owner-user or investor seeking market-rate leasing opportunities. Situated on a quiet street with excellent walkability to some of LA's best dining, retail, and entertainment de
Key facts
- Onsite parking
- Stable cash flow
- Fully occupied
Tags
Property features AI
Finance
- Other: Property is rent controlled (disclosure)
- Financial info: Actual annual gross income reported at $178,068; Net operating income reported at $115,730; Total annual expenses reported at $62,338.50 (includes insurance, water, gardener, maintenance, taxes); Cap rate listed at 5.0; Gross rent multiplier approximately 12.91; Listing terms: Cash to new loan; Owner pays water and gardener; tenants pay gas and electric; Laundry equipment owned by building
- HOA & community: Eight-unit complex; No tennis court or athletic court
Exterior
- Parking: Total of 7 parking spaces with 5 covered spaces and 2 open spaces
- Utilities: Water meter on property; Sewer connection in street; Tenant pays gas and electric; owner pays water and gardener
- Home design: Residential income property; Two levels; Faces west
- Construction: Stucco construction; Shingle/composition roof
- Exterior features: Stucco exterior; Composition/shingle roof; No additional exterior structures
Interior
- Kitchen: Gas cooking; Range/oven; Refrigerator; Freezer
- Bedrooms: Mix of 1- and 2-bedroom units (eight units total)
- Flooring: Laminate floors
- Bathrooms: Multiple 1-bath units
- Heating & cooling: Wall heating; Wall-mounted cooling units
- Interior features: Tile counters; Ceiling fans
- Laundry & utility: Communal laundry room (building-owned machines; two tenant-owned washers excluded); Washer and dryer listed in equipment; Central gas water heater
Neighborhood map
What this means for you Summary
Snapshot
- This is a 8 × 12-bed/8.0-bath units multifamily listed at $2.30M. Condition is rated good.
Deal economics
- At list price, monthly cash flow is $8k ($99k/yr) — positive. Per door: $1k/mo.
- The deal already cash-flows at list — no discount required.
- Meets the 1% rule at list price ($31k rent vs $2.30M).
- Cap rate 10.6% vs local median 1.5% in West Hollywood — top-decile yield for the area; either an underpriced asset or a hidden risk that comps aren't pricing in. Stress-test before assuming the spread holds.
Location & tenants
- Location reads 70/100 on livability (#239 in CA) — a middle-class / working-renter tenant base. Strengths: schools A+, amenities A+, commute A+; Watch: health & safety C-, crime F, cost of living F.
- Los Angeles Unified (urban): math 29% / reading 54% proficiency, ranked #223 of 517 in CA (top 43%) — families likely to look elsewhere, expect single-tenant / working-renter base with shorter leases; 67% free/reduced lunch — lower-income household profile, screen leases tightly.
- Market conditions: Rents soft (-1.5%/yr); 334 active listings in the ZIP; solid renter incomes; 19,697 units permitted in Los Angeles County in 2024 (9,426 in 5+ unit buildings).
- At $30,524/mo this rent would consume 381% of the median local household income ($96k/yr) (locally 5563% of renters already pay >50% of income on rent) — very limited rent-growth headroom before tenants either downsize or default.
Forward outlook
- Local home prices are declining (-3.0%/yr); year-one equity from $16k of loan paydown is wiped out by about $69k of value loss. Plan a longer hold.
- Los Angeles County population projected at +9% by 2050 — modest demand growth; plan on rents tracking national, not racing it.
Negotiation context
- Only 7 days on market — expect competitive offers; lowballing is unlikely to land.
Risks & watch-outs
- Watch-outs: built in 1956 — expect roof / HVAC / electrical / plumbing capex.
- Climate carrying-cost: extreme-heat days projected 8→23/yr by 2055 (HVAC capex compounding) — expect insurance premiums to compound above CPI over the hold.
Questions for the listing agent
- Can we see the unit-by-unit rent roll, current vacancy, and any below-market leases? What's the average tenancy length?
- What capital expenditures (roof, boiler, parking lot, exteriors) have been made in the last 5 years, and what's planned in the next 2?
- Built in 1956 — when were the roof, HVAC, electrical panel, plumbing, and water heater last replaced?
- Is there a deadline driving the sale (1031 exchange, divorce, estate, relocation)? That informs how much negotiation room exists.
- Schools are A-rated — typically a magnet for longer-tenancy family renters. What's the average tenant stay here, and is there a school-zone premium baked into asking?
- Crime grade is F in this area — have there been break-ins, vandalism, or insurance claims at this property in the last 3 years? What carrier currently insures it and at what premium?
- What's the average days-on-market for RENTAL listings here right now (not sales)? A rising rental-DOM trend means longer vacancies and softer asking-rent achievability than the comps imply.
- What's the recent tenant-quality profile in this submarket — average credit score on applications, eviction rate, late-payment / NSF rate, and stable-employment percentage? A property-management company in the area should have these aggregated.
- How much new apartment / multifamily construction is in the pipeline within 1–3 miles? Heavy new supply (>2% of stock underway) typically softens rents 12–24 months out; light construction supports rent growth.
Investment metrics
- 1% rule
- 1.33% ✓
- Cap rate
- 10.59%
- Cash-on-cash
- 15.33%
- DSCR
- 1.68
- GRM
- 6.3
CMA / ARV
No comps found within radius.
Projected returns pro-forma
-3.0% appreciation · 0.0% rent growth · sell at horizon
- IRR
- 2.6%
- Equity multiple
- 1.10×
- Total profit
- $62,394
- Equity at exit
- $342,788
- IRR
- 9.0%
- Equity multiple
- 1.60×
- Total profit
- $385,134
- Equity at exit
- $198,776
Cash invested: $643,720 (down + closing). Projections, not guarantees.
Landlord ↔ Tenant lean methodology
- Overall (STATE)
- 18 Strongly Tenant-Friendly
- State California
- 18 Strongly Tenant-Friendly · D+13
- County
- — inherits STATE
- City
- — inherits STATE
ZIP-level market 90046
- Rents YoY
- -1.5%
- Active inventory
- 334
- Price-to-rent
- 50.2×
Monthly cashflow live
- Estimated rent
- $30,524 medium interval (Pro) →
- Mortgage (P&I)
- −$12,056
- Tax est. 1.5%
- −$2,874 /mo · $34,485/yr
- Insurance
- −$958
- HOA
- −$0
- Vacancy / Maint / Mgmt
- −$6,410
- Net cashflow
- $8,226
Break-even live
8-unit breakdown (identical units grouped — click to expand)
| Units | Beds | Baths | Est. rent |
|---|---|---|---|
| 8× units | 12 | 8 | $30,528 |
| #1 | 12 | 8 | $3,816 |
| #2 | 12 | 8 | $3,816 |
| #3 | 12 | 8 | $3,816 |
| #4 | 12 | 8 | $3,816 |
| #5 | 12 | 8 | $3,816 |
| #6 | 12 | 8 | $3,816 |
| #7 | 12 | 8 | $3,816 |
| #8 | 12 | 8 | $3,816 |
| Total (8 units) | $30,524 | ||
UW: 25.0% down · 7.5% · 30yr · 1.5% tax · 5.0% vac · 8.0% maint · 8.0% mgmt
Financing live
Cash to close
- Down payment
- $574,750
- Closing costs
- $68,970
- Reserves months
- —
- Total cash needed
- —
Loan-product check · same deal, 3 products live
Conventional
25% down · 7.5% · 30yr
- Down + closing
- —
- Monthly P&I
- —
- Monthly cashflow
- —
- DSCR
- —
- Eligible?
- —
Personal DTI + credit; lowest rate.
DSCR
20% down · 8.5% · 30yr
- Down + closing
- —
- Monthly P&I
- —
- Monthly cashflow
- —
- DSCR
- —
- Eligible?
- —
No personal income docs; deal must DSCR.
Hard money
10% down · 12.0% · 12mo
- Down + closing
- —
- Monthly P&I
- —
- Monthly cashflow
- —
- DSCR
- —
- Eligible?
- —
Short-term bridge; refi at stabilization.
Listing history 6 events
-
2026-06-18days on market $2,299,000 Active 7 DOM
-
2026-06-17days on market $2,299,000 Active 6 DOM
-
2026-06-16days on market $2,299,000 Active 5 DOM
-
2026-06-15days on market $2,299,000 Active 4 DOM
-
2026-06-13days on market $2,299,000 Active 2 DOM
-
2026-05-19$2,299,000 Active
ⓘ Source: listings_history table (triggers on properties + properties_extension) + one-shot
backfill from property_details.listing_events for pre-trigger history.
Climate risk First Street
- Flood 1/10 Low FEMA zone X (unshaded) · 0% chance over 30 yrs
- Wildfire 1/10 Low
- Heat 7/10 Severe 8 d/yr ≥88°F today · 23 d/yr by 30 yrs out
- Wind 1/10 Low
- Air quality 5/10 Major 7 unhealthy d/yr today · 7 by 30 yrs out
Nearby sold comps map
Loading sold comps map…
Walkable amenities ~0.75 mi
Loading nearby amenities…
Taxation est. · year 1
- Rental income
- $366,288
- − Mortgage interest
- −$128,780
- − Property taxes
- −$34,485
- − Insurance
- −$11,495
- − Repairs & maintenance
- −$29,303
- − Management
- −$29,303
- − Depreciation
- −$66,880
- Taxable income
- $66,042
- Est. tax owed @ 24.0%
- −$15,850
- After-tax cash flow
- $82,863/yr
For passive investors: Depreciation is non-cash, so a rental often shows a tax loss while cash-flowing — sheltering income. Rental losses are passive: they offset passive income freely, and up to $25,000/yr can offset ordinary (W-2) income if you actively participate and your MAGI is under $100k (phasing out to $0 by $150k); unused losses carry forward. On sale, claimed depreciation is recaptured at up to 25%, and gains may owe capital-gains tax (a 1031 exchange can defer both). Figures are a year-1 estimate at your 24.0% rate — not tax advice; consult a CPA.
Condition & rehab AI · 12 photos
This 8-unit multifamily property is in good condition with cosmetic updates needed. It offers strong in-place income and a prime location.
Repairs flagged
- Minor Kitchen cabinets — Worn appearance
- Minor Bathroom fixtures — Dated appearance
Value-add opportunities
- Both Paint interior walls — Fresh paint enhances curb appeal and interior aesthetics
- Rental Replace dated bathroom fixtures — Modern fixtures improve tenant satisfaction and rental value
Renovation cost estimate screening
| Repair item | Severity | Est. cost |
|---|---|---|
| Kitchen cabinets · Worn appearance | Minor | $500–3,000 |
| Bathroom fixtures · Dated appearance | Minor | $500–3,000 |
| Total estimated repair cost · 2 items | $1,000–6,000 |
Value-add ROI direction
- Both Paint interior walls — Fresh paint enhances curb appeal and interior aesthetics ↑
- Rental Replace dated bathroom fixtures — Modern fixtures improve tenant satisfaction and rental value ↑
ⓘ Cost ranges are severity-bucket heuristics (US national rule-of-thumb). Get contractor quotes + a written scope before underwriting a rehab budget.
Schools (NCES district)
- District
- Los Angeles Unified
- NCES district ID
- 0622710
- Math proficiency
- 29% ▼ -4.00%
- Reading proficiency
- 54% ▲ 10.00%
- Median HH income
- $50,403
- Composite
- 35.67/100
- National rank
- #4875
- State rank
- #223 of 517 in CA
Livability — West Hollywood
- Score
- 70/100
- State rank
- #239
- US rank
- #7852
Category grades
Schools grade is shown separately in the Schools card above.
Census & demographics
- Census place
- West Hollywood, CA
- County
- Los Angeles County · 9,444,647 people
- City population
- 20,961
- Metro
- Los Angeles-Long Beach-Anaheim, CA
- Population (ZIP)
- 48,296
- Household income
- $96,250
- Rent vs Own
- Severe rent burden
- 5563.0
Population outlook (Los Angeles County) Hauer SSP2
- Today (2025)
- 10,940,515 people
- By 2030
- 11,256,481 · +2.9%
- By 2040
- 11,729,929 · +7.2%
- By 2050
- 11,948,407 · +9.2%
- By 2075
- 11,818,114 · +8.0%
- By 2100
- 10,842,928 · -0.9%
Race, ethnicity, and origin ACS 2023
- Neighborhood character
- Majority White (65%)
- Race & ethnicity
- White 65% Hispanic / Latino 16% Two or more races 13% Asian 7% Black 5%
- Hispanic origin (detail)
- Mexican 8% Puerto Rican 1%
- Common ancestry
- Scotch-Irish 6% Lithuanian 4% Romanian 4%
- Foreign-born
- 26% · Canada, China, South Korea
- Languages at home
- 71% English-only · Spanish 9% Russian/Polish/Slavic 8% Other Indo-European 3%
Political lean MEDSL · Los Angeles
- 2024 margin
- Solid D (+32.9) · D 64.8% · R 31.9% · Other 3.3%
- 2008→2024 swing
- -7.4pp toward R · 2008: 40.4pp · 2024: 32.9pp
- All cycles
- 2024: D+32.9 2020: D+44.2 2016: D+48.0 2012: D+40.0 2008: D+40.4
Not yet ingested
- Civics
- —
Market trends
- HPI YoY
- ▼ -571.28%
- Current HPI
- 365.8036
- Rent YoY
- ▼ -1.48%
- Metro
- Los Angeles-Long Beach-Anaheim, CA
- State GDP YoY
- ▲ 3.21%
- F500 in state
- 116
Industry mix (Fortune 500 HQ in CA)
| Industry | F500 HQs | Revenue |
|---|---|---|
| Technology | 27 | $1,492B |
|
||
| Financial Services | 3 | $174B |
|
||
| Retail | 3 | $44B |
|
||
| Insurance | 3 | $26B |
|
||
| Media / Entertainment | 2 | $115B |
|
||
| Pharmaceuticals / Biotech | 2 | $62B |
|
||
Price history
1 event — show timeline
- 2026-05-19 Listed $2,299,000 TheMLS
Cash-flow waterfall
monthlySold comps — $/sqft
last 12 mo · ≤1 miLoading sold comps…