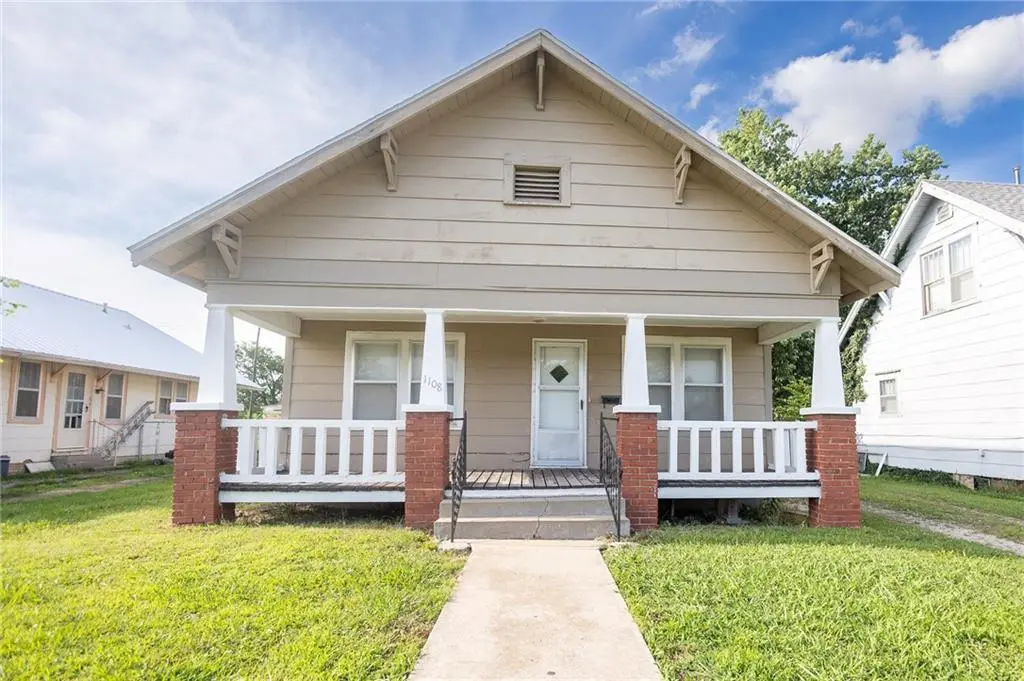
1108 W 9th St · Coffeyville, KS
Flood risk 1/10 · Minimal
- FEMA flood zone
- X (unshaded)
- Chance of flooding over 30 yrs
- 0.0%
- Est. flood insurance / yr
- $507 – $1,088
Fire risk 5/10 · Moderate
- Est. fire insurance / yr
- $1,154 – $2,142
Heat risk 6/10 · Moderate
- Hot days now (above 109°F)
- 7 days/yr
- Hot days in 30 yrs
- 19 days/yr
Wind risk 2/10 · Minimal
- Chance of severe wind over 30 yrs
- 2.0%
Air-quality risk 2/10 · Minimal
- Unhealthy air days now
- 2 days/yr
- Unhealthy air days in 30 yrs
- 2 days/yr
Risk factors via First Street. Map © Google.
Why this score? — see what drove the C grade
The composite is a weighted blend of 9 inputs, each scored 0–100. Each bar is that input's sub-score; the figure is the points it added to the 100-point composite (weight × sub-score).
- Cash flow +30.0/30.0
- 1% rule +10.0/10.0
- DSCR +10.0/10.0
- Livability +3.0/5.0
- Rent growth +2.5/5.0
- Condition / age +2.5/5.0
- Schools +1.5/10.0
- ARV discount +0.0/15.0
- Appreciation +0.0/10.0
$61,900
🖨 Deal sheet (PDF) 📄 Offer letter ✓ Due diligence
Key facts
- Covered front porch
- Fresh coat of paint
- Small deck
Tags
Property features AI
Finance
- Other: Not in a flood plain; Inside city limits; Approximately 988 above-grade living area (per appraiser); Lot about 7,000 sq ft (approx. 50 x 140)
- HOA & community: No association fees
Exterior
- Parking: Off-street parking
- Utilities: Public water; Public sewer
- Home design: Single family residence; Residential property; 1.5-story floor plan; Faces south
- Construction: Lap siding; Composition roof
- Exterior features: Porch; City lot; Paved road access
Interior
- Kitchen: Living/dining combo
- Bedrooms: 2 bedrooms
- Flooring: Carpet; Other flooring
- Bathrooms: 1 full bathroom
- Heating & cooling: Wall furnace heating; Window unit(s) for cooling
- Interior features: Ceiling fan(s); Wood windows
- Laundry & utility: Laundry in kitchen; Laundry closet
Neighborhood map
What this means for you Summary
Snapshot
- This is a 2-bed/1.0-bath single-family listed at $62k.
Deal economics
- At list price, monthly cash flow is $349 ($4k/yr) — positive.
- The deal already cash-flows at list — no discount required.
- Meets the 1% rule at list price ($950 rent vs $62k).
- Cap rate 13.1% vs local median 4.4% in Coffeyville — top-decile yield for the area; either an underpriced asset or a hidden risk that comps aren't pricing in. Stress-test before assuming the spread holds.
Location & tenants
- Location reads 59/100 on livability (#459 in KS) — a working-class tenant base; expect higher turnover. Strengths: cost of living A+, housing A+, health & safety A+; Watch: schools F, crime F, amenities F.
- Coffeyville (town): math 12% / reading 23% proficiency, ranked #164 of 169 in KS (top 97%) — low school quality limits family demand, transient renter base, plan for 1-2y turnover; 65% free/reduced lunch — lower-income household profile, screen leases tightly.
- Market conditions: 42 active listings in the ZIP; 1 comparable units currently listed for rent nearby; 10 units permitted in Montgomery County in 2024 (0 in 5+ unit buildings).
Forward outlook
- Local home prices are declining (-3.0%/yr); year-one equity from $428 of loan paydown is wiped out by about $2k of value loss. Plan a longer hold.
- Montgomery County population projected at -28% by 2050 — secular population decline; favor cash flow + early exit over multi-decade hold.
- At projected returns (-3.0% appreciation + 3.0% rent growth), your $17k cash investment doubles in ~6 years — after that, you're playing with house money.
Negotiation context
- Only 14 days on market — expect competitive offers; lowballing is unlikely to land.
Risks & watch-outs
- Watch-outs: built in 1916 — expect roof / HVAC / electrical / plumbing capex.
- Climate carrying-cost: moderate wildfire risk; extreme-heat days projected 7→19/yr by 2055 (HVAC capex compounding) — expect insurance premiums to compound above CPI over the hold.
Questions for the listing agent
- Built in 1916 — when were the roof, HVAC, electrical panel, plumbing, and water heater last replaced?
- Is there a deadline driving the sale (1031 exchange, divorce, estate, relocation)? That informs how much negotiation room exists.
- Schools are F-rated, which usually means shorter tenancies and higher turnover. Who's the typical renter profile here, and what's been the actual vacancy rate?
- Crime grade is F in this area — have there been break-ins, vandalism, or insurance claims at this property in the last 3 years? What carrier currently insures it and at what premium?
- What's the average days-on-market for RENTAL listings here right now (not sales)? A rising rental-DOM trend means longer vacancies and softer asking-rent achievability than the comps imply.
- What's the recent tenant-quality profile in this submarket — average credit score on applications, eviction rate, late-payment / NSF rate, and stable-employment percentage? A property-management company in the area should have these aggregated.
- How much new for-sale + rental construction is in the pipeline within 1–3 miles? Heavy new supply typically softens prices + rents 12–24 months out; constrained supply supports both.
Investment metrics
- 1% rule
- 1.53% ✓
- Cap rate
- 13.06%
- Cash-on-cash
- 24.18%
- DSCR
- 2.08
- GRM
- 5.4
CMA / ARV
- ARV (on-the-fly)
- $49,400
- Comps found
- 12
Show comp detail 12 sales within ~0.75 mi
| Address | Dist | Beds/Ba | Sqft | Sold | Price | $/sf | Match |
|---|---|---|---|---|---|---|---|
| 1006 W 6th St | 0.23mi | 2/1.0 | 960 (-3%) | 4mo | $39,900 | $42 | 81 |
| 1312 W 7th St | 0.28mi | 2/1.0 | 945 (-4%) | 8mo | $20,000 | $21 | 74 |
| 1217 W 5th St | 0.29mi | 2/1.0 | 1,036 (+5%) | 6mo | $80,000 | $77 | 73 |
| 812 Lincoln St | 0.29mi | 2/1.0 | 1,056 (+7%) | 11mo | $18,000 | $17 | 66 |
| 1412 W 6th St | 0.41mi | 2/1.0 | 1,064 (+8%) | 5mo | $52,000 | $49 | 64 |
| 1309 W 4th St | 0.40mi | 2/1.0 | 1,081 (+9%) | 3mo | $25,000 | $23 | 63 |
| 1008 W 5th St | 0.29mi | 2/1.0 | 909 (-8%) | 12mo | $66,500 | $73 | 63 |
| 1010 W 3rd St | 0.43mi | 2/1.0 | 1,092 (+10%) | 1mo | $74,900 | $69 | 62 |
| 1501 W 5th St | 0.47mi | 2/1.0 | 1,084 (+10%) | 2mo | $69,500 | $64 | 60 |
| 1104 W 4th St | 0.36mi | 3/1.0 (+1) | 1,104 (+12%) | 2mo | $55,000 | $50 | 57 |
| 1509 W 6th St | 0.47mi | 3/1.0 (+1) | 1,064 (+8%) | 9mo | $34,900 | $33 | 52 |
| 1901 W 7th St | 0.72mi | 3/1.0 (+1) | 1,084 (+10%) | 5mo | $60,000 | $55 | 41 |
Match score weights: distance 35% · size 25% · config 20% · recency 20%. Top-matched comps best support the ARV.
Projected returns pro-forma
-3.0% appreciation · 3.0% rent growth · sell at horizon
- IRR
- 17.4%
- Equity multiple
- 1.70×
- Total profit
- $12,214
- Equity at exit
- $9,229
- IRR
- 25.9%
- Equity multiple
- 3.27×
- Total profit
- $39,273
- Equity at exit
- $5,352
Cash invested: $17,332 (down + closing). Projections, not guarantees.
Landlord ↔ Tenant lean methodology
- Overall (STATE)
- 83 Strongly Landlord-Friendly
- State Kansas
- 83 Strongly Landlord-Friendly · R+10
- County
- — inherits STATE
- City
- — inherits STATE
ZIP-level market 67337
- Home prices YoY
- -23.3%
- Active inventory
- 42
- Price-to-rent
- 5.4×
Monthly cashflow live
- Estimated rent
- $950 medium interval (Pro) →
- Mortgage (P&I)
- −$325
- Tax from tax record
- −$51 /mo · $610/yr
- Insurance
- −$26
- HOA
- −$0
- Vacancy / Maint / Mgmt
- −$200
- Net cashflow
- $349
Break-even live
Sensitivity live
| Price | -10% $384 | -5% $367 | +0% $349 | +5% $332 | +10% $314 |
|---|---|---|---|---|---|
| Rent | -10% $274 | -5% $312 | +0% $349 | +5% $387 | +10% $424 |
| Rate | -1.0pp $380 | -0.5pp $365 | base $349 | +0.5pp $333 | +1.0pp $317 |
UW: 25.0% down · 7.5% · 30yr · 1.5% tax · 5.0% vac · 8.0% maint · 8.0% mgmt
Financing live
Cash to close
- Down payment
- $15,475
- Closing costs
- $1,857
- Reserves months
- —
- Total cash needed
- —
Loan-product check · same deal, 3 products live
Conventional
25% down · 7.5% · 30yr
- Down + closing
- —
- Monthly P&I
- —
- Monthly cashflow
- —
- DSCR
- —
- Eligible?
- —
Personal DTI + credit; lowest rate.
DSCR
20% down · 8.5% · 30yr
- Down + closing
- —
- Monthly P&I
- —
- Monthly cashflow
- —
- DSCR
- —
- Eligible?
- —
No personal income docs; deal must DSCR.
Hard money
10% down · 12.0% · 12mo
- Down + closing
- —
- Monthly P&I
- —
- Monthly cashflow
- —
- DSCR
- —
- Eligible?
- —
Short-term bridge; refi at stabilization.
Rent comps 1 comps
| Address | Beds | Baths | Sqft | Rent | $/sqft | DOM | Units | Dist |
|---|---|---|---|---|---|---|---|---|
| 500 N Cline Rd Coffeyville, KS | 2.0 | 1.0 | 700 | $950 | $1.36 | 24d | 1 | 1.24mi |
Listing history 10 events
-
2026-06-21days on market $61,900 Active 14 DOM
-
2026-06-18days on market $61,900 Active 12 DOM
-
2026-06-17days on market $61,900 Active 11 DOM
-
2026-06-16days on market $61,900 Active 10 DOM
-
2026-06-15days on market $61,900 Active 9 DOM
-
2026-06-13days on market $61,900 Active 7 DOM
-
2026-06-12days on market $61,900 Active 6 DOM
-
2026-06-09days on market $61,900 Active 3 DOM
-
2026-06-08days on market $61,900 Active 2 DOM
-
2026-06-07$61,900 Active 1 DOM
ⓘ Source: listings_history table (triggers on properties + properties_extension) + one-shot
backfill from property_details.listing_events for pre-trigger history.
Tax reassessment forecast KS · Resets to sale price
- Current annual tax
- $610 · $51/mo
- Projected year-2 tax
- $873 · $73/mo
- Expected delta
- +$263/yr (+$22/mo · 43.1%)
ⓘ Screening estimate from a state-policy table — verify with the county assessor before closing.
Climate risk First Street
- Flood 1/10 Low FEMA zone X (unshaded) · 0% chance over 30 yrs
- Wildfire 5/10 Major
- Heat 6/10 Major 7 d/yr ≥109°F today · 19 d/yr by 30 yrs out
- Wind 2/10 Low 2% chance of damaging wind over 30 yrs
- Air quality 2/10 Low 2 unhealthy d/yr today · 2 by 30 yrs out
Nearby sold comps map
Loading sold comps map…
Walkable amenities ~0.75 mi
Loading nearby amenities…
Taxation est. · year 1
- Rental income
- $11,400
- − Mortgage interest
- −$3,467
- − Property taxes
- −$610
- − Insurance
- −$310
- − Repairs & maintenance
- −$912
- − Management
- −$912
- − Depreciation
- −$1,801
- Taxable income
- $3,389
- Est. tax owed @ 24.0%
- −$813
- After-tax cash flow
- $3,378/yr
For passive investors: Depreciation is non-cash, so a rental often shows a tax loss while cash-flowing — sheltering income. Rental losses are passive: they offset passive income freely, and up to $25,000/yr can offset ordinary (W-2) income if you actively participate and your MAGI is under $100k (phasing out to $0 by $150k); unused losses carry forward. On sale, claimed depreciation is recaptured at up to 25%, and gains may owe capital-gains tax (a 1031 exchange can defer both). Figures are a year-1 estimate at your 24.0% rate — not tax advice; consult a CPA.
Schools (NCES district)
- District
- Coffeyville
- NCES district ID
- 2004980
- Math proficiency
- 12% ▼ -4.00%
- Reading proficiency
- 23% ▼ -1.00%
- Median HH income
- $37,170
- Composite
- 14.57/100
- National rank
- #9414
- State rank
- #164 of 169 in KS
Livability — Coffeyville
- Score
- 59/100
- State rank
- #459
- US rank
- #19703
Category grades
Schools grade is shown separately in the Schools card above.
Census & demographics
- Census place
- Coffeyville, KS
- Population (ZIP)
- 10,944
Population outlook (Montgomery County) Hauer SSP2
- Today (2025)
- 29,729 people
- By 2030
- 27,786 · -6.5%
- By 2040
- 24,201 · -18.6%
- By 2050
- 21,280 · -28.4%
- By 2075
- 16,754 · -43.6%
- By 2100
- 14,088 · -52.6%
Race, ethnicity, and origin ACS 2023
- Neighborhood character
- Predominantly White (68%)
- Race & ethnicity
- White 68% Two or more races 14% Hispanic / Latino 14% Black 9% Native American 3%
- Hispanic origin (detail)
- Mexican 10%
- Common ancestry
- Slovak 2% Iranian 2% Lithuanian 1%
- Foreign-born
- 4% · Canada
- Languages at home
- 90% English-only · Spanish 8%
Political lean MEDSL · Montgomery
- 2024 margin
- Solid R (+51.1) · D 23.6% · R 74.7% · Other 1.8%
- 2008→2024 swing
- -15.3pp toward R · 2008: -35.8pp · 2024: -51.1pp
- All cycles
- 2024: R+51.1 2020: R+50.2 2016: R+50.8 2012: R+41.4 2008: R+35.8
Not yet ingested
- Civics
- —
Market trends
- HPI YoY
- ▼ -31.41%
- Current HPI
- 103.4247
- Rent YoY
- —
- Metro
- —
- State GDP YoY
- —
- F500 in state
- 0
Price history
1 event — show timeline
- 2026-06-06 Listed $61,900 Heartland MLS as Distributed by MLS Grid
Property tax history
+0.5%/yrLatest (2025): $610 · +2.2% YoY. Source: county tax records.
Cash-flow waterfall
monthlySold comps — $/sqft
last 12 mo · ≤1 miLoading sold comps…