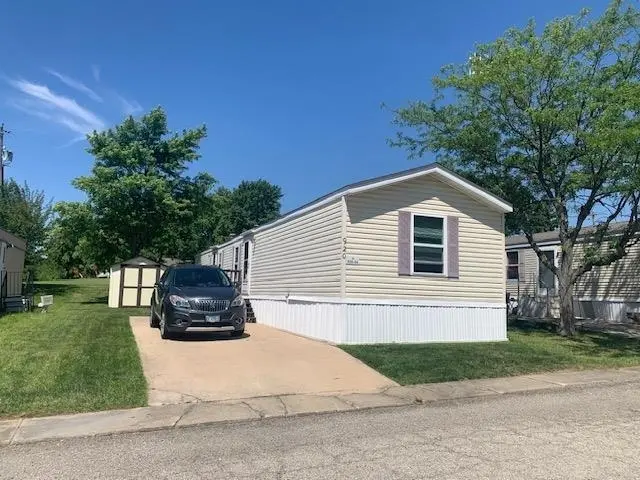
920 Belle Aire Ave · Marseilles, IL
Flood risk No data
- FEMA flood zone
- —
- Chance of flooding over 30 yrs
- —
- Est. flood insurance / yr
- —
Fire risk No data
- Est. fire insurance / yr
- —
Heat risk No data
- Hot days now (above threshold)
- —
- Hot days in 30 yrs
- —
Wind risk No data
- Chance of severe wind over 30 yrs
- —
Air-quality risk No data
- Unhealthy air days now
- —
- Unhealthy air days in 30 yrs
- —
Risk factors via First Street. Map © Google.
Why this score? — see what drove the D grade
The composite is a weighted blend of 9 inputs, each scored 0–100. Each bar is that input's sub-score; the figure is the points it added to the 100-point composite (weight × sub-score).
- Cash flow +15.0/30.0
- ARV discount +7.5/15.0
- 1% rule +5.0/10.0
- DSCR +5.0/10.0
- Condition / age +3.8/5.0
- Livability +3.5/5.0
- Schools +2.7/10.0
- Rent growth +2.5/5.0
- Appreciation +0.0/10.0
$25,900
🖨 Deal sheet 📄 Offer letter ✓ Due diligence
Listing remarks
Very well kept mobile home on a rentable lot in Belle Aire Mobile home park Marseilles IL Washer Dryer Stove Refrigerator shed stay. Buyer must apply and be accepted to park management. Monthly Lot rent $620. per park management. Please confirm with Belle Aire Mobile Home Park Management.
Key facts
- Rentable lot
- Built 2002
- Listed 9 days
Tags
Property features AI
Finance
- Financial info: Annual tax: $70
Exterior
- Utilities: Public water; Public sewer
- Home design: Residential mobile home
Interior
- Kitchen: Gas cooktop; Refrigerator
- Bathrooms: 2 full bathrooms; 2 bathrooms on the main level
- Heating & cooling: Forced air heating (natural gas); Central air conditioning
- Interior features: Gas water heater
- Laundry & utility: Washer; Dryer
Neighborhood map
What this means for you Summary
Snapshot
- This is a 3-bed/2.0-bath manufactured listed at $26k. Condition is rated good.
Deal economics
- At list price, monthly cash flow is $791 ($9k/yr) — positive.
- The deal already cash-flows at list — no discount required.
- Meets the 1% rule at list price ($1k rent vs $26k).
Location & tenants
- Location reads 69/100 on livability (#438 in IL) — a middle-class / working-renter tenant base. Strengths: crime A+, cost of living A+, housing A+; Watch: health & safety C-, employment D, schools F.
- Ottawa Twp Hsd 140 (town): math 25% / reading 30% proficiency, ranked #545 of 919 in IL (top 59%) — low school quality limits family demand, transient renter base, plan for 1-2y turnover.
- Market conditions: 54 active listings in the ZIP; 82 units permitted in LaSalle County in 2024 (0 in 5+ unit buildings).
Forward outlook
- Local home prices are declining (-3.0%/yr); year-one equity from $179 of loan paydown is wiped out by about $777 of value loss. Plan a longer hold.
- LaSalle County population projected at -16% by 2050 — secular population decline; favor cash flow + early exit over multi-decade hold.
- At projected returns (-3.0% appreciation + 3.0% rent growth), your $7k cash investment doubles in ~1 year — after that, you're playing with house money.
Negotiation context
- Only 9 days on market — expect competitive offers; lowballing is unlikely to land.
Questions for the listing agent
- Is there a deadline driving the sale (1031 exchange, divorce, estate, relocation)? That informs how much negotiation room exists.
- Schools are F-rated, which usually means shorter tenancies and higher turnover. Who's the typical renter profile here, and what's been the actual vacancy rate?
- The area grade is low — what's the realistic commute time and amenity access for the typical tenant pool here? Any planned neighborhood developments (good or bad) we should know about?
- What's the average days-on-market for RENTAL listings here right now (not sales)? A rising rental-DOM trend means longer vacancies and softer asking-rent achievability than the comps imply.
- What's the recent tenant-quality profile in this submarket — average credit score on applications, eviction rate, late-payment / NSF rate, and stable-employment percentage? A property-management company in the area should have these aggregated.
- How much new for-sale + rental construction is in the pipeline within 1–3 miles? Heavy new supply typically softens prices + rents 12–24 months out; constrained supply supports both.
Investment metrics
- 1% rule
- 4.74% ✓
- Cap rate
- 42.95%
- Cash-on-cash
- 130.90%
- DSCR
- 6.82
- GRM
- 1.8
CMA / ARV
No comps found within radius.
Projected returns pro-forma
-3.0% appreciation · 3.0% rent growth · sell at horizon
- IRR
- —
- Equity multiple
- 7.37×
- Total profit
- $46,206
- Equity at exit
- $3,862
- IRR
- —
- Equity multiple
- 15.50×
- Total profit
- $105,188
- Equity at exit
- $2,239
Cash invested: $7,252 (down + closing). Projections, not guarantees.
Landlord ↔ Tenant lean methodology
- Overall (STATE)
- 43 Moderately Tenant-Leaning
- State Illinois
- 43 Moderately Tenant-Leaning · D+7
- County
- — inherits STATE
- City
- — inherits STATE
ZIP-level market 61341
- Home prices YoY
- -26.2%
- Active inventory
- 54
- Price-to-rent
- 1.8×
Monthly cashflow live
- Estimated rent
- $1,228 medium interval (Pro) →
- Mortgage (P&I)
- −$136
- Tax est. 1.5%
- −$32 /mo · $388/yr
- Insurance
- −$11
- HOA
- −$0
- Vacancy / Maint / Mgmt
- −$258
- Net cashflow
- $791
Break-even live
UW: 25.0% down · 7.5% · 30yr · 1.5% tax · 5.0% vac · 8.0% maint · 8.0% mgmt
Financing live
Cash to close
- Down payment
- $6,475
- Closing costs
- $777
- Reserves months
- —
- Total cash needed
- —
Loan-product check · same deal, 3 products live
Conventional
25% down · 7.5% · 30yr
- Down + closing
- —
- Monthly P&I
- —
- Monthly cashflow
- —
- DSCR
- —
- Eligible?
- —
Personal DTI + credit; lowest rate.
DSCR
20% down · 8.5% · 30yr
- Down + closing
- —
- Monthly P&I
- —
- Monthly cashflow
- —
- DSCR
- —
- Eligible?
- —
No personal income docs; deal must DSCR.
Hard money
10% down · 12.0% · 12mo
- Down + closing
- —
- Monthly P&I
- —
- Monthly cashflow
- —
- DSCR
- —
- Eligible?
- —
Short-term bridge; refi at stabilization.
Listing history 8 events
-
2026-06-14statusdays on market $25,900 Pending 9 DOM
-
2026-06-12remarks 289-char remark
-
2026-06-12days on market $25,900 Active 8 DOM
-
2026-06-09days on market $25,900 Active 5 DOM
-
2026-06-08days on market $25,900 Active 4 DOM
-
2026-06-07days on market $25,900 Active 3 DOM
-
2026-06-05remarks 185-char remark
-
2026-06-05$25,900 Active 1 DOM
ⓘ Source: listings_history table (triggers on properties + properties_extension) + one-shot
backfill from property_details.listing_events for pre-trigger history.
Nearby sold comps map
Loading sold comps map…
Walkable amenities ~0.75 mi
Loading nearby amenities…
Taxation est. · year 1
- Rental income
- $14,735
- − Mortgage interest
- −$1,451
- − Property taxes
- −$388
- − Insurance
- −$130
- − Repairs & maintenance
- −$1,179
- − Management
- −$1,179
- − Depreciation
- −$753
- Taxable income
- $9,655
- Est. tax owed @ 24.0%
- −$2,317
- After-tax cash flow
- $7,176/yr
For passive investors: Depreciation is non-cash, so a rental often shows a tax loss while cash-flowing — sheltering income. Rental losses are passive: they offset passive income freely, and up to $25,000/yr can offset ordinary (W-2) income if you actively participate and your MAGI is under $100k (phasing out to $0 by $150k); unused losses carry forward. On sale, claimed depreciation is recaptured at up to 25%, and gains may owe capital-gains tax (a 1031 exchange can defer both). Figures are a year-1 estimate at your 24.0% rate — not tax advice; consult a CPA.
Condition & rehab AI · 13 photos
This mobile home is in good condition with some minor repairs and maintenance needed. It has a good foundation and structure, and the exterior appears well-maintained. The interior walls and flooring could benefit from some updates to increase its value.
Repairs flagged
- Minor Paint — Interior walls show some wear.
- Minor Flooring — Carpeted flooring appears slightly worn.
- Minor Landscaping — Some areas of the lawn could benefit from trimming and fertilization.
Value-add opportunities
- Both Paint interior walls — Fresh paint can improve the home's appearance and increase its value.
- Both Replace carpeted flooring — New flooring can enhance the home's appeal and increase its value.
- Both Landscaping improvements — A well-maintained lawn and landscaping can increase curb appeal and property value.
Renovation cost estimate screening
| Repair item | Severity | Est. cost |
|---|---|---|
| Paint · Interior walls show some wear. | Minor | $500–3,000 |
| Flooring · Carpeted flooring appears slightly worn. | Minor | $500–3,000 |
| Landscaping · Some areas of the lawn could benefit from trimming and fertilization. | Minor | $500–3,000 |
| Total estimated repair cost · 3 items | $1,500–9,000 |
Value-add ROI direction
- Both Paint interior walls — Fresh paint can improve the home's appearance and increase its value. ↑
- Both Replace carpeted flooring — New flooring can enhance the home's appeal and increase its value. ↑
- Both Landscaping improvements — A well-maintained lawn and landscaping can increase curb appeal and property value. ↑
ⓘ Cost ranges are severity-bucket heuristics (US national rule-of-thumb). Get contractor quotes + a written scope before underwriting a rehab budget.
Schools (NCES district)
- District
- Ottawa Twp Hsd 140
- NCES district ID
- 1730330
- Math proficiency
- 25% ▼ -3.00%
- Reading proficiency
- 30% ▼ -4.00%
- Median HH income
- $47,828
- Composite
- 26.85/100
- National rank
- #12528
- State rank
- #545 of 919 in IL
Livability — Marseilles
- Score
- 69/100
- State rank
- #438
- US rank
- #8954
Category grades
Schools grade is shown separately in the Schools card above.
Census & demographics
- Census place
- Marseilles, IL
- Population (ZIP)
- 7,249
Population outlook (LaSalle County) Hauer SSP2
- Today (2025)
- 107,080 people
- By 2030
- 104,196 · -2.7%
- By 2040
- 97,413 · -9.0%
- By 2050
- 90,294 · -15.7%
- By 2075
- 76,252 · -28.8%
- By 2100
- 61,339 · -42.7%
Race, ethnicity, and origin ACS 2023
- Neighborhood character
- Predominantly White (89%)
- Race & ethnicity
- White 89% Hispanic / Latino 6% Two or more races 4% Asian 2%
- Hispanic origin (detail)
- Mexican 4%
- Common ancestry
- Portuguese 11% Lithuanian 7% Romanian 4%
- Foreign-born
- 3% · China, Canada
- Languages at home
- 95% English-only · Spanish 2% Chinese 1% German/W. Germanic 1%
Political lean MEDSL · LaSalle
- 2024 margin
- R (+18.5) · D 40.1% · R 58.6% · Other 1.3%
- 2008→2024 swing
- -29.6pp toward R · 2008: 11.1pp · 2024: -18.5pp
- All cycles
- 2024: R+18.5 2020: R+14.3 2016: R+14.4 2012: R+0.4 2008: D+11.1
Not yet ingested
- Civics
- —
Market trends
- HPI YoY
- ▼ -63.60%
- Current HPI
- 178.9377
- Rent YoY
- —
- Metro
- —
- State GDP YoY
- ▲ 1.59%
- F500 in state
- 60
Industry mix (Fortune 500 HQ in IL)
| Industry | F500 HQs | Revenue |
|---|---|---|
| Insurance | 4 | $201B |
|
||
| Consumer Goods | 4 | $87B |
|
||
| Industrial Machinery | 3 | $64B |
|
||
| Healthcare | 2 | $55B |
|
||
| Retail / Pharmacy | 1 | $148B |
|
||
| Agriculture / Food | 1 | $86B |
|
||
Price history
1 event — show timeline
- 2026-06-03 Listed $25,900 NWIAR
Cash-flow waterfall
monthlySold comps — $/sqft
last 12 mo · ≤1 miLoading sold comps…