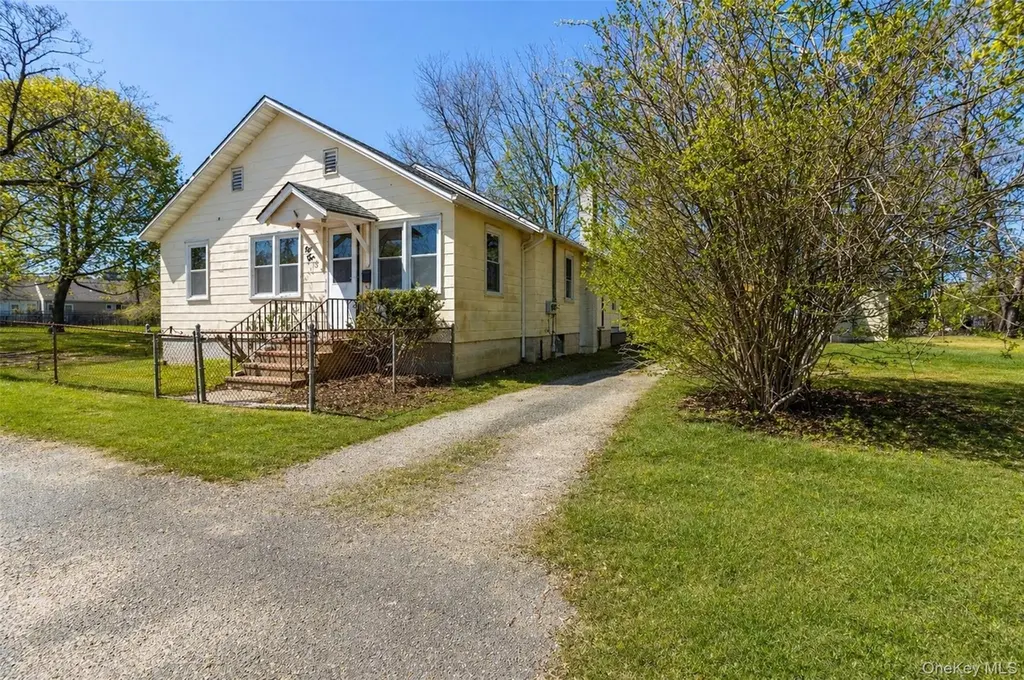
135 Corwin St · Greenport West, NY
Flood risk 1/10 · Minimal
- FEMA flood zone
- X (unshaded)
- Chance of flooding over 30 yrs
- 0.0%
- Est. flood insurance / yr
- $473 – $860
Fire risk 1/10 · Minimal
- Est. fire insurance / yr
- $691 – $1,283
Heat risk 5/10 · Moderate
- Hot days now (above 90°F)
- 7 days/yr
- Hot days in 30 yrs
- 19 days/yr
Wind risk 8/10 · Major
- Chance of severe wind over 30 yrs
- 80.0%
Air-quality risk 3/10 · Minor
- Unhealthy air days now
- 3 days/yr
- Unhealthy air days in 30 yrs
- 4 days/yr
Risk factors via First Street. Map © Google.
Why this score? — see what drove the B+ grade
The composite is a weighted blend of 9 inputs, each scored 0–100. Each bar is that input's sub-score; the figure is the points it added to the 100-point composite (weight × sub-score).
- Cash flow +30.0/30.0
- ARV discount +15.0/15.0
- 1% rule +10.0/10.0
- DSCR +10.0/10.0
- Schools +4.5/10.0
- Livability +2.9/5.0
- Rent growth +2.5/5.0
- Condition / age +2.5/5.0
- Appreciation +0.0/10.0
$725,000
🖨 Deal sheet 📄 Offer letter ✓ Due diligence
Listing remarks
Opportunity knocks! This rare farmhouse style cottage rests on an expansive double lot on the edge of Greenport Village and is prime to be revamped. Featuring 1700sqft of interior space, a large block foundation with full basement throughout most of the footprint, a 12x22 detached garage and a yard that will allow your imagination to run wild. Walk into town, walk to 5th and 6th street beaches and easy access to all that the North Fork has to offer.
Key facts
- Expansive double lot
- Full basement
- Walk to town
Tags
Property features AI
Exterior
- Parking: Driveway; Attached garage (1 space)
- Utilities: Cesspool sewer; Cable connected; Electricity connected; Phone connected; Water connected
- Home design: Single family residence; Measured living area
- Construction: Block, frame, and shingle siding construction; Partial basement
- Exterior features: Not waterfront; Exterior finished with block, frame, and shingle siding
Interior
- Kitchen: Dishwasher; Electric range; Freezer; Refrigerator
- Bedrooms: 10 total rooms (includes bedroom(s) on first floor)
- Flooring: Carpet; Wood
- Bathrooms: 1 full bathroom; 1 half bathroom
- Heating & cooling: Baseboard heating; No central cooling
- Interior features: First-floor bedroom; First-floor full bathroom; Partial basement; Full and partial attic
- Laundry & utility: Laundry located in basement
Neighborhood map
What this means for you Summary
Snapshot
- This is a 5-bed/1.5-bath single-family listed at $725k.
Deal economics
- At list price, monthly cash flow is $6k ($76k/yr) — positive.
- The deal already cash-flows at list — no discount required.
- Meets the 1% rule at list price ($14k rent vs $725k).
- Recommended offer: $703k (3.0% below list) — sets the bar for market timing.
- Cap rate 16.7% vs local median 8.0% in Greenport West — top-decile yield for the area; either an underpriced asset or a hidden risk that comps aren't pricing in. Stress-test before assuming the spread holds.
Location & tenants
- Location reads 58/100 on livability (#1,073 in NY) — a working-class tenant base; expect higher turnover. Strengths: crime A+, employment A+; Watch: amenities F, commute F, cost of living F.
- Greenport Union Free School District (town): math 55% / reading 45% proficiency, ranked #450 of 755 in NY (top 60%) — acceptable for families but not a draw, mixed tenant base, ~2y average lease.
- Zoned schools: Greenport Elementary School (math 47% / reading 62%, grade C, #908 of 2,108 statewide, top 46%, 339 students, 61% FRL); Greenport High School (math 52% / reading 54%, grade C-, #934 of 1,100 statewide, top 86%, 356 students, 63% FRL).
- Market conditions: 67 active listings in the ZIP; 2 comparable units currently listed for rent nearby; 1,366 units permitted in Suffolk County in 2024 (216 in 5+ unit buildings).
Forward outlook
- Local home prices are declining (-3.0%/yr); year-one equity from $5k of loan paydown is wiped out by about $22k of value loss. Plan a longer hold.
- Suffolk County population projected to shrink 5% by 2050 — rents likely to lag national; underwrite the cash flow, not the appreciation.
- At projected returns (-3.0% appreciation + 3.0% rent growth), your $203k cash investment doubles in ~4 years — after that, you're playing with house money.
Negotiation context
- It's been on market 50 days — a 3% lower offer ($703k) is reasonable based on typical stale-listing flexibility.
Risks & watch-outs
- Watch-outs: built in 1958 — expect roof / HVAC / electrical / plumbing capex.
- Climate carrying-cost: severe wind risk, 80% chance of damaging wind over 30y; extreme-heat days projected 7→19/yr by 2055 (HVAC capex compounding) — expect insurance premiums to compound above CPI over the hold.
Questions for the listing agent
- It's been on market 50 days. Have you received any prior offers? Is the seller open to a 3% concession, seller financing, or rate buy-down credit?
- Built in 1958 — when were the roof, HVAC, electrical panel, plumbing, and water heater last replaced?
- Is there a deadline driving the sale (1031 exchange, divorce, estate, relocation)? That informs how much negotiation room exists.
- Schools are D-rated, which usually means shorter tenancies and higher turnover. Who's the typical renter profile here, and what's been the actual vacancy rate?
- What's the average days-on-market for RENTAL listings here right now (not sales)? A rising rental-DOM trend means longer vacancies and softer asking-rent achievability than the comps imply.
- What's the recent tenant-quality profile in this submarket — average credit score on applications, eviction rate, late-payment / NSF rate, and stable-employment percentage? A property-management company in the area should have these aggregated.
- How much new for-sale + rental construction is in the pipeline within 1–3 miles? Heavy new supply typically softens prices + rents 12–24 months out; constrained supply supports both.
Investment metrics
- 1% rule
- 1.92% ✓
- Cap rate
- 16.73%
- Cash-on-cash
- 37.28%
- DSCR
- 2.66
- GRM
- 4.3
CMA / ARV
- ARV (median comp)
- $876,594
- List price
- $725,000
- Delta
- -17.29%
- Verdict
- UNDERPRICED
- Comps
- 9 within 1.0 mi
Show comp detail 4 sales within ~0.75 mi
| Address | Dist | Beds/Ba | Sqft | Sold | Price | $/sf | Match |
|---|---|---|---|---|---|---|---|
| 516 4th St | 0.35mi | 4/2.5 (-1) | 1,840 (+8%) | 14mo | $1,195,000 | $649 | 50 |
| 416 West St | 0.46mi | 4/1.5 (-1) | 1,450 (-15%) | 4mo | $725,000 | $500 | 46 |
| 1605 Washington Ave | 0.73mi | 4/3.0 (-1) | 1,740 (+2%) | 6mo | $1,295,000 | $744 | 46 |
| 336 2nd St | 0.57mi | 4/2.0 (-1) | 1,800 (+6%) | 14mo | $578,000 | $321 | 44 |
Match score weights: distance 35% · size 25% · config 20% · recency 20%. Top-matched comps best support the ARV.
Projected returns pro-forma
-3.0% appreciation · 3.0% rent growth · sell at horizon
- IRR
- 33.2%
- Equity multiple
- 2.40×
- Total profit
- $284,183
- Equity at exit
- $108,100
- IRR
- 40.2%
- Equity multiple
- 4.77×
- Total profit
- $764,695
- Equity at exit
- $62,685
Cash invested: $203,000 (down + closing). Projections, not guarantees.
Landlord ↔ Tenant lean methodology
- Overall (STATE)
- 15 Strongly Tenant-Friendly
- State New York
- 15 Strongly Tenant-Friendly · D+10
- County
- — inherits STATE
- City
- — inherits STATE
ZIP-level market 11944
- Home prices YoY
- -23.7%
- Active inventory
- 67
- Price-to-rent
- 4.3×
Monthly cashflow live
- Estimated rent
- $13,912 medium interval (Pro) →
- Mortgage (P&I)
- −$3,802
- Tax from tax record
- −$580 /mo · $6,961/yr
- Insurance
- −$302
- HOA
- −$0
- Vacancy / Maint / Mgmt
- −$2,922
- Net cashflow
- $6,306
Break-even live
UW: 25.0% down · 7.5% · 30yr · 1.5% tax · 5.0% vac · 8.0% maint · 8.0% mgmt
Financing live
Cash to close
- Down payment
- $181,250
- Closing costs
- $21,750
- Reserves months
- —
- Total cash needed
- —
Loan-product check · same deal, 3 products live
Conventional
25% down · 7.5% · 30yr
- Down + closing
- —
- Monthly P&I
- —
- Monthly cashflow
- —
- DSCR
- —
- Eligible?
- —
Personal DTI + credit; lowest rate.
DSCR
20% down · 8.5% · 30yr
- Down + closing
- —
- Monthly P&I
- —
- Monthly cashflow
- —
- DSCR
- —
- Eligible?
- —
No personal income docs; deal must DSCR.
Hard money
10% down · 12.0% · 12mo
- Down + closing
- —
- Monthly P&I
- —
- Monthly cashflow
- —
- DSCR
- —
- Eligible?
- —
Short-term bridge; refi at stabilization.
Rent comps 2 comps
| Address | Beds | Baths | Sqft | Rent | $/sqft | DOM | Units | Dist |
|---|---|---|---|---|---|---|---|---|
| 312 5th Ave Greenport, NY | 4.0 | 2.0 | 1900 | $12,000 | $6.32 | 43d | 1 | 0.37mi |
| 485 Sutton Pl Greenport, NY | 4.0 | 2.5 | 2026 | $20,000 | $9.87 | 43d | 1 | 1.09mi |
Listing history 16 events
-
2026-06-18days on market $725,000 Active 50 DOM
-
2026-06-17days on market $725,000 Active 49 DOM
-
2026-06-16days on market $725,000 Active 48 DOM
-
2026-06-15days on market $725,000 Active 47 DOM
-
2026-06-13days on market $725,000 Active 45 DOM
-
2026-06-12days on market $725,000 Active 44 DOM
-
2026-06-09days on market $725,000 Active 41 DOM
-
2026-06-08days on market $725,000 Active 40 DOM
-
2026-06-07days on market $725,000 Active 39 DOM
-
2026-06-05days on market $725,000 Active 37 DOM
-
2026-06-04days on market $725,000 Active 35 DOM
-
2026-06-02days on market $725,000 Active 34 DOM
-
2026-06-01days on market $725,000 Active 33 DOM
-
2026-05-31days on market $725,000 Active 32 DOM
-
2026-05-31price $725,000 Active 31 DOM
-
2026-04-29$799,000 Active 453-char remark
ⓘ Source: listings_history table (triggers on properties + properties_extension) + one-shot
backfill from property_details.listing_events for pre-trigger history.
Tax reassessment forecast NY · Partial reset (capped growth)
- Current annual tax
- $6,961 · $580/mo
- Projected year-2 tax
- $9,607 · $801/mo
- Expected delta
- +$2,646/yr (+$220/mo · 38.0%)
ⓘ Screening estimate from a state-policy table — verify with the county assessor before closing.
Climate risk First Street
- Flood 1/10 Low FEMA zone X (unshaded) · 0% chance over 30 yrs
- Wildfire 1/10 Low
- Heat 5/10 Major 7 d/yr ≥90°F today · 19 d/yr by 30 yrs out
- Wind 8/10 Severe 80% chance of damaging wind over 30 yrs
- Air quality 3/10 Moderate 3 unhealthy d/yr today · 4 by 30 yrs out
Nearby sold comps map
Loading sold comps map…
Walkable amenities ~0.75 mi
Loading nearby amenities…
Taxation est. · year 1
- Rental income
- $166,944
- − Mortgage interest
- −$40,611
- − Property taxes
- −$6,961
- − Insurance
- −$3,625
- − Repairs & maintenance
- −$13,356
- − Management
- −$13,356
- − Depreciation
- −$21,091
- Taxable income
- $67,945
- Est. tax owed @ 24.0%
- −$16,307
- After-tax cash flow
- $59,369/yr
For passive investors: Depreciation is non-cash, so a rental often shows a tax loss while cash-flowing — sheltering income. Rental losses are passive: they offset passive income freely, and up to $25,000/yr can offset ordinary (W-2) income if you actively participate and your MAGI is under $100k (phasing out to $0 by $150k); unused losses carry forward. On sale, claimed depreciation is recaptured at up to 25%, and gains may owe capital-gains tax (a 1031 exchange can defer both). Figures are a year-1 estimate at your 24.0% rate — not tax advice; consult a CPA.
Schools (NCES district)
- District
- Greenport Union Free School District
- NCES district ID
- 3612840
- Math proficiency
- 55% ▲ 5.00%
- Reading proficiency
- 45% ▼ -5.00%
- Median HH income
- $54,490
- Composite
- 45.25/100
- National rank
- #5759
- State rank
- #450 of 755 in NY
Livability — Greenport West
- Score
- 58/100
- State rank
- #1073
- US rank
- #21520
Category grades
Schools grade is shown separately in the Schools card above.
Census & demographics
- Census place
- Greenport West, NY
- Population (ZIP)
- 4,744
Population outlook (Suffolk County) Hauer SSP2
- Today (2025)
- 1,505,262 people
- By 2030
- 1,498,318 · -0.5%
- By 2040
- 1,471,101 · -2.3%
- By 2050
- 1,424,848 · -5.3%
- By 2075
- 1,337,157 · -11.2%
- By 2100
- 1,217,720 · -19.1%
Race, ethnicity, and origin ACS 2023
- Neighborhood character
- Predominantly White (69%)
- Race & ethnicity
- White 69% Hispanic / Latino 23% Two or more races 6% Black 4% Asian 2%
- Hispanic origin (detail)
- Mexican 5% Puerto Rican 2%
- Common ancestry
- Romanian 6% Lithuanian 2% Subsaharan African 2%
- Foreign-born
- 19% · Canada, China
- Languages at home
- 69% English-only · Spanish 22% German/W. Germanic 3% Russian/Polish/Slavic 2%
Political lean MEDSL · Suffolk
- 2024 margin
- Lean R (+10.0) · D 45.0% · R 55.0%
- 2008→2024 swing
- -16.0pp toward R · 2008: 6.0pp · 2024: -10.0pp
- All cycles
- 2024: R+10.0 2020: R+0.0 2016: R+8.2 2012: D+2.9 2008: D+6.0
Not yet ingested
- Civics
- —
Market trends
- HPI YoY
- ▼ -143.97%
- Current HPI
- 462.3431
- Rent YoY
- —
- Metro
- —
- State GDP YoY
- ▲ 2.60%
- F500 in state
- 92
Industry mix (Fortune 500 HQ in NY)
| Industry | F500 HQs | Revenue |
|---|---|---|
| Financial Services | 10 | $950B |
|
||
| Consumer Goods | 9 | $162B |
|
||
| Insurance | 4 | $225B |
|
||
| Telecommunications | 2 | $144B |
|
||
| Pharmaceuticals | 2 | $112B |
|
||
| Media / Entertainment | 2 | $69B |
|
||
Price history
-9.3% since first listed2 events — show timeline
- 2026-05-30 Price Changed $725,000 OneKey® MLS as Distributed by MLS Grid
- 2026-04-29 Listed $799,000 OneKey® MLS as Distributed by MLS Grid
Property tax history
+3.8%/yrLatest (2025): $6,961 · +0.0% YoY. Source: county tax records.
Cash-flow waterfall
monthlySold comps — $/sqft
last 12 mo · ≤1 miLoading sold comps…