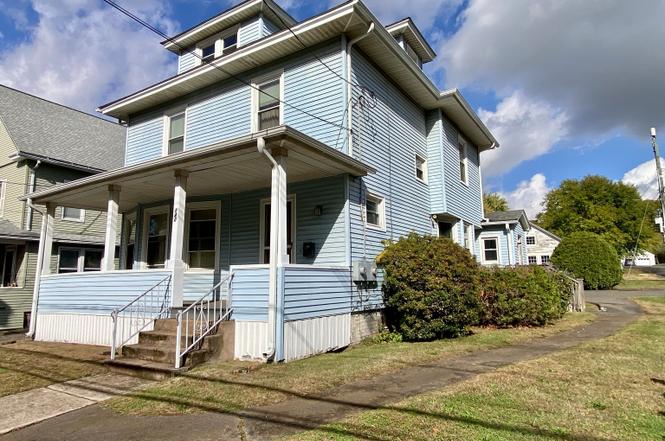
140 Union St · Vernon, CT
Flood risk No data
- FEMA flood zone
- —
- Chance of flooding over 30 yrs
- —
- Est. flood insurance / yr
- —
Fire risk No data
- Est. fire insurance / yr
- —
Heat risk No data
- Hot days now (above threshold)
- —
- Hot days in 30 yrs
- —
Wind risk No data
- Chance of severe wind over 30 yrs
- —
Air-quality risk No data
- Unhealthy air days now
- —
- Unhealthy air days in 30 yrs
- —
Risk factors via First Street. Map © Google.
Why this score? — see what drove the C- grade
The composite is a weighted blend of 9 inputs, each scored 0–100. Each bar is that input's sub-score; the figure is the points it added to the 100-point composite (weight × sub-score).
- Cash flow +15.4/30.0
- ARV discount +15.0/15.0
- DSCR +4.7/10.0
- 1% rule +4.2/10.0
- Rent growth +3.7/5.0
- Schools +3.6/10.0
- Livability +2.5/5.0
- Condition / age +2.5/5.0
- Appreciation +0.0/10.0
$290,000
🖨 Deal sheet (PDF) 📄 Offer letter ✓ Due diligence
Listing remarks MLS
Offers encouraged-can be used as single family or business owner occupant-some panelled offices on first floor/could be dr/lr-great home for large family-corner lot w/plenty of parking-bank of america prequl needed on all offers-free apprsl/crdt rpt- if financed thru bankof america-allow 2-3 days for response-bac addendum required
Key facts
- Covered front porch
- Walk up attic
- Off street parking
Tags
Property features AI
Exterior
- Parking: Detached garage; 3-car garage
- Utilities: Public water connected; Public sewer connected; Domestic hot water
- Home design: Single-family home
- Construction: Frame construction; Brick and stone foundation; Vinyl siding; Asphalt shingle roof; Light blue exterior
- Exterior features: Gutters; Corner lot
Interior
- Kitchen: Oven/Range; Microwave; Refrigerator
- Bedrooms: 4 bedrooms
- Bathrooms: 1 full bathroom; 1 half bathroom
- Heating & cooling: Hot water heating; Natural gas heating; Window unit cooling
- Interior features: 9 total rooms; Full unfinished basement; Walk-up attic
- Laundry & utility: Window unit cooling
Neighborhood map
What this means for you Summary
Snapshot
- This is a 4-bed/1.5-bath single-family listed at $290k.
Deal economics
- At list price, monthly cash flow is $109 ($1k/yr) — positive.
- The deal already cash-flows at list — no discount required.
- To meet the 1% rule (rent ≥ 1% of price), the offer needs to be $267k (7.8% below list).
- Recommended offer: $255k (12.0% below list) — sets the bar for market timing.
Location & tenants
- Location reads: area grade C — affects rentability + tenant quality, not the cash-flow math above.
- Vernon School District (suburban): math 34% / reading 48% proficiency, ranked #97 of 153 in CT (top 63%) — families likely to look elsewhere, expect single-tenant / working-renter base with shorter leases.
- Zoned schools: Maple Street School (math 22% / reading 32%, grade F, #401 of 553 statewide, top 74%, 257 students, 72% FRL); Vernon Center Middle School (math 29% / reading 45%, grade F, #116 of 175 statewide, top 67%, 678 students, 60% FRL); Rockville High School (math 22% / reading 52%, grade F, #112 of 194 statewide, top 60%, 932 students, 48% FRL) — zoned schools average 60% FRL vs 35% district-wide (25 pts higher); higher-poverty schools than district average — tighter screening recommended.
- Market conditions: Rents rising fast (+4.7%/yr); 83 active listings in the ZIP; 3 comparable units currently listed for rent nearby; rentals lingering (median 46d on market — plan ~5-8 weeks vacancy on turnover, expect pricing pressure); 67% of comp listings sitting > 30 days — soft ceiling on asking rent; solid renter incomes; 1,867 units permitted in Capitol Planning Region in 2024 (1,399 in 5+ unit buildings).
- This rent runs 38% of the median local income ($85k/yr) — at the standard rent-burdened threshold; future hikes will face affordability resistance.
Forward outlook
- Local home prices are declining (-3.0%/yr); year-one equity from $2k of loan paydown is wiped out by about $9k of value loss. Plan a longer hold.
Negotiation context
- It's been on market 143 days — a 12% lower offer ($255k) is reasonable based on typical stale-listing flexibility.
- 4 sale attempts since 18y ago with the ask held roughly flat each time — persistent listings suggest the price (not the market) is what's stuck; bring a comps-based counter.
Risks & watch-outs
- Watch-outs: built in 1925 — expect roof / HVAC / electrical / plumbing capex.
Questions for the listing agent
- It's been on market 143 days. Have you received any prior offers? Is the seller open to a 12% concession, seller financing, or rate buy-down credit?
- Built in 1925 — when were the roof, HVAC, electrical panel, plumbing, and water heater last replaced?
- Why hasn't it sold? Are there any deal-killer items the seller is aware of (foundation, flood, title, zoning, code violations)?
- Is there a deadline driving the sale (1031 exchange, divorce, estate, relocation)? That informs how much negotiation room exists.
- What's the average days-on-market for RENTAL listings here right now (not sales)? A rising rental-DOM trend means longer vacancies and softer asking-rent achievability than the comps imply.
- What's the recent tenant-quality profile in this submarket — average credit score on applications, eviction rate, late-payment / NSF rate, and stable-employment percentage? A property-management company in the area should have these aggregated.
- How much new for-sale + rental construction is in the pipeline within 1–3 miles? Heavy new supply typically softens prices + rents 12–24 months out; constrained supply supports both.
Investment metrics
- 1% rule
- 0.92% ✗
- Cap rate
- 6.74%
- Cash-on-cash
- 1.61%
- DSCR
- 1.07
- GRM
- 9.0
CMA / ARV
- ARV (on-the-fly)
- $363,991
- Comps found
- 11
Show comp detail 11 sales within ~0.75 mi
| Address | Dist | Beds/Ba | Sqft | Sold | Price | $/sf | Match |
|---|---|---|---|---|---|---|---|
| 140 Union St | 0.00mi | 4/1.5 | 2,011 (0%) | 1mo | $282,000 | $140 | 99 |
| 8 Harlow St | 0.03mi | 5/2.0 (+1) | 2,124 (+6%) | 22mo | $360,000 | $169 | 64 |
| 86 Talcott Ave | 0.20mi | 4/2.0 | 1,832 (-9%) | 14mo | $340,000 | $186 | 62 |
| 26 Davis Ave | 0.40mi | 3/1.5 (-1) | 2,061 (+2%) | 12mo | $368,000 | $179 | 62 |
| 9 Grant St | 0.19mi | 4/2.0 | 2,139 (+6%) | 22mo | $310,000 | $145 | 60 |
| 91 Orchard St | 0.13mi | 4/2.5 | 1,759 (-12%) | 14mo | $325,000 | $185 | 57 |
| 11 Valerie Dr | 0.73mi | 4/1.5 | 1,780 (-12%) | 4mo | $410,000 | $230 | 43 |
| 43 Pillsbury Hl | 0.57mi | 3/2.5 (-1) | 1,938 (-4%) | 21mo | $376,500 | $194 | 41 |
| 34 Prospect St | 0.73mi | 4/1.5 | 2,099 (+4%) | 23mo | $209,000 | $100 | 39 |
| 22 Elizabeth St | 0.43mi | 4/2.5 | 1,764 (-12%) | 22mo | $320,000 | $181 | 37 |
| 59 N Park St | 0.71mi | 3/2.5 (-1) | 2,192 (+9%) | 16mo | $460,000 | $210 | 29 |
Match score weights: distance 35% · size 25% · config 20% · recency 20%. Top-matched comps best support the ARV.
Projected returns pro-forma
-3.0% appreciation · 4.73% rent growth · sell at horizon
- IRR
- -11.8%
- Equity multiple
- 0.57×
- Total profit
- $-35,273
- Equity at exit
- $43,240
- IRR
- -0.2%
- Equity multiple
- 0.98×
- Total profit
- $-1,478
- Equity at exit
- $25,074
Cash invested: $81,200 (down + closing). Projections, not guarantees.
Landlord ↔ Tenant lean methodology
- Overall (STATE)
- 27 Tenant-Leaning
- State Connecticut
- 27 Tenant-Leaning · D+7
- County
- — inherits STATE
- City
- — inherits STATE
ZIP-level market 06066
- Rents YoY
- 4.7%
- Active inventory
- 83
- Price-to-rent
- 9.0×
Monthly cashflow live
- Estimated rent
- $2,675 medium interval (Pro) →
- Mortgage (P&I)
- −$1,521
- Tax est. 1.5%
- −$362 /mo · $4,350/yr
- Insurance
- −$121
- HOA
- −$0
- Vacancy / Maint / Mgmt
- −$562
- Net cashflow
- $109
Break-even live
Sensitivity live
| Price | -10% $309 | -5% $209 | +0% $109 | +5% $9 | +10% $-91 |
|---|---|---|---|---|---|
| Rent | -10% $-102 | -5% $3 | +0% $109 | +5% $215 | +10% $320 |
| Rate | -1.0pp $255 | -0.5pp $183 | base $109 | +0.5pp $34 | +1.0pp $-43 |
UW: 25.0% down · 7.5% · 30yr · 1.5% tax · 5.0% vac · 8.0% maint · 8.0% mgmt
Financing live
Cash to close
- Down payment
- $72,500
- Closing costs
- $8,700
- Reserves months
- —
- Total cash needed
- —
Loan-product check · same deal, 3 products live
Conventional
25% down · 7.5% · 30yr
- Down + closing
- —
- Monthly P&I
- —
- Monthly cashflow
- —
- DSCR
- —
- Eligible?
- —
Personal DTI + credit; lowest rate.
DSCR
20% down · 8.5% · 30yr
- Down + closing
- —
- Monthly P&I
- —
- Monthly cashflow
- —
- DSCR
- —
- Eligible?
- —
No personal income docs; deal must DSCR.
Hard money
10% down · 12.0% · 12mo
- Down + closing
- —
- Monthly P&I
- —
- Monthly cashflow
- —
- DSCR
- —
- Eligible?
- —
Short-term bridge; refi at stabilization.
Rent comps 3 comps
| Address | Beds | Baths | Sqft | Rent | $/sqft | DOM | Units | Dist |
|---|---|---|---|---|---|---|---|---|
| Woodland St Vernon, CT | 3.0 | 1.0 | 1500 | $2,675 | $1.78 | 5d | 1 | 0.17mi |
| 2 Eastview Dr Unit 1 Vernon, CT | 3.0 | 1.5 | 1480 | $2,550 | $1.72 | 45d | 1 | 0.80mi |
| 2 Eastview Dr Vernon, CT | 3.0 | 2.5 | 1480 | $2,550 | $1.72 | 45d | 1 | 0.85mi |
Listing history 10 events
-
2026-05-19soldstatus $282,000 Closed
-
2026-05-02status Under Contract
-
2026-04-11historical Under Contract - Continue to Show
-
2026-03-13status Active
-
2026-02-06status Under Contract
-
2025-11-04$290,000 Active
-
2009-08-28soldstatus $110,900 332-char remark
Show marketing remark (332 chars)
Offers encouraged-can be used as single family or business owner occupant-some panelled offices on first floor/could be dr/lr-great home for large family-corner lot w/plenty of parking-bank of america prequl needed on all offers-free apprsl/crdt rpt- if financed thru bankof america-allow 2-3 days for response-bac addendum required
-
2009-04-14$110,900 332-char remark
Show marketing remark (332 chars)
Offers encouraged-can be used as single family or business owner occupant-some panelled offices on first floor/could be dr/lr-great home for large family-corner lot w/plenty of parking-bank of america prequl needed on all offers-free apprsl/crdt rpt- if financed thru bankof america-allow 2-3 days for response-bac addendum required
-
2009-01-29historical
-
2008-08-27$159,900
ⓘ Source: listings_history table (triggers on properties + properties_extension) + one-shot
backfill from property_details.listing_events for pre-trigger history.
Nearby sold comps map
Loading sold comps map…
Walkable amenities ~0.75 mi
Loading nearby amenities…
Taxation est. · year 1
- Rental income
- $32,098
- − Mortgage interest
- −$16,245
- − Property taxes
- −$4,350
- − Insurance
- −$1,450
- − Repairs & maintenance
- −$2,568
- − Management
- −$2,568
- − Depreciation
- −$8,436
- Taxable loss
- −$3,518
- Est. tax savings @ 24.0%
- +$844
- After-tax cash flow
- $2,152/yr
For passive investors: Depreciation is non-cash, so a rental often shows a tax loss while cash-flowing — sheltering income. Rental losses are passive: they offset passive income freely, and up to $25,000/yr can offset ordinary (W-2) income if you actively participate and your MAGI is under $100k (phasing out to $0 by $150k); unused losses carry forward. On sale, claimed depreciation is recaptured at up to 25%, and gains may owe capital-gains tax (a 1031 exchange can defer both). Figures are a year-1 estimate at your 24.0% rate — not tax advice; consult a CPA.
Schools (NCES district)
- District
- Vernon School District
- NCES district ID
- 0904680
- Math proficiency
- 34% ▼ -11.00%
- Reading proficiency
- 48% ▼ -6.00%
- Median HH income
- $60,342
- Composite
- 36.26/100
- National rank
- #4704
- State rank
- #97 of 153 in CT
Livability — Vernon
No livability data for this city. (Only ~50 U.S. cities are tracked.)
Census & demographics
- Census place
- Rockville, CT
- County
- Tolland County · 46,815 people
- Metro
- Hartford-East Hartford-Middletown, CT
- Population (ZIP)
- 30,577
- Household income
- $85,356
- Rent vs Own
- Severe rent burden
- 1140.0
Population outlook (Capitol County) Hauer SSP2
- By 2040
- 1,063,519
Race, ethnicity, and origin ACS 2023
- Neighborhood character
- Predominantly White (71%)
- Race & ethnicity
- White 71% Hispanic / Latino 12% Two or more races 7% Asian 6% Black 5%
- Hispanic origin (detail)
- Mexican 1% Puerto Rican 9%
- Common ancestry
- Lithuanian 8% Romanian 7% Slovak 2%
- Foreign-born
- 11% · Canada, China, South Korea
- Languages at home
- 84% English-only · Spanish 6% Other Indo-European 5% Russian/Polish/Slavic 1%
Political lean MEDSL · Capitol
- 2024 margin
- Strong D (+21.9) · D 60.1% · R 38.2% · Other 1.7%
- All cycles
- 2024: D+21.9
Not yet ingested
- Civics
- —
Market trends
- HPI YoY
- ▼ -136.25%
- Current HPI
- 249.7888
- Rent YoY
- ▲ 4.73%
- Metro
- Hartford-East Hartford-Middletown, CT
- State GDP YoY
- ▲ 1.06%
- F500 in state
- 38
Industry mix (Fortune 500 HQ in CT)
| Industry | F500 HQs | Revenue |
|---|---|---|
| Industrial Machinery | 4 | $38B |
|
||
| Insurance | 3 | $71B |
|
||
| Financial Services | 2 | $25B |
|
||
| Transportation / Logistics | 2 | $18B |
|
||
| Healthcare | 1 | $247B |
|
||
| Telecommunications | 1 | $55B |
|
||
Price history
+76.4% since first listed10 events — show timeline
- 2026-05-19 Sold (MLS) $282,000 Smart MLS
- 2026-05-02 Pending — Smart MLS
- 2026-04-11 Contingent — Smart MLS
- 2026-03-13 Relisted — Smart MLS
- 2026-02-06 Pending — Smart MLS
- 2025-11-04 Listed $290,000 Smart MLS
- 2009-08-28 Sold (MLS) $110,900 Smart MLS
- 2009-04-14 Listed $110,900 Smart MLS
- 2009-01-29 Listing Removed — Smart MLS
- 2008-08-27 Listed $159,900 Smart MLS
Cash-flow waterfall
monthlySold comps — $/sqft
last 12 mo · ≤1 miLoading sold comps…