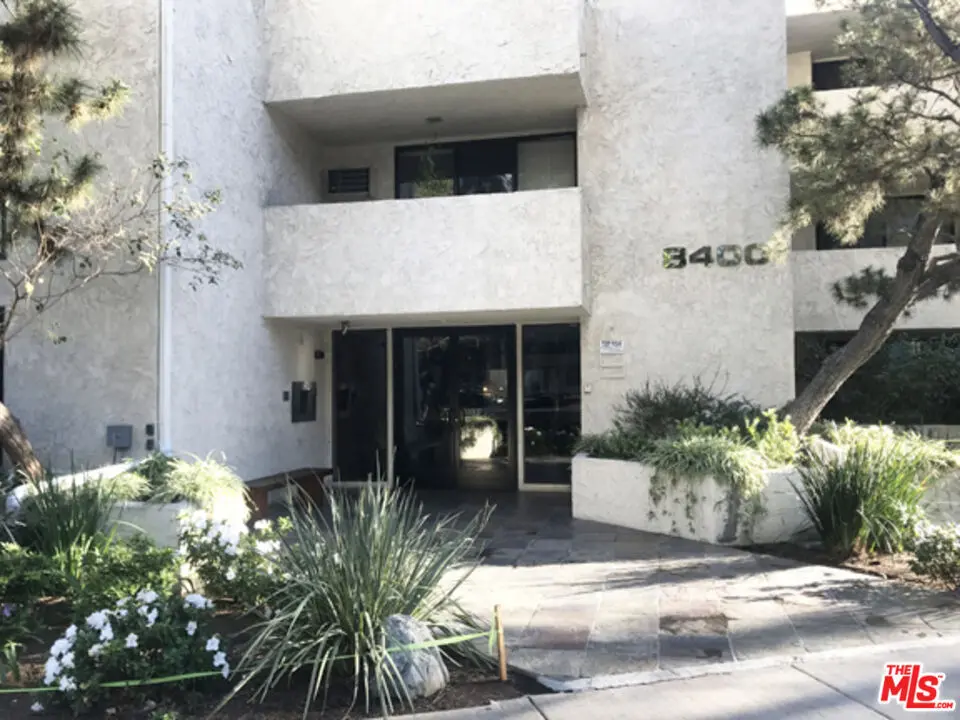
8400 De Longpre Ave #104 · West Hollywood, CA
Flood risk 1/10 · Minimal
- FEMA flood zone
- X (unshaded)
- Chance of flooding over 30 yrs
- 0.0%
- Est. flood insurance / yr
- $507 – $1,088
Fire risk 1/10 · Minimal
- Est. fire insurance / yr
- $659 – $1,223
Heat risk 6/10 · Moderate
- Hot days now (above 88°F)
- 7 days/yr
- Hot days in 30 yrs
- 22 days/yr
Wind risk 1/10 · Minimal
- Chance of severe wind over 30 yrs
- —
Air-quality risk 5/10 · Moderate
- Unhealthy air days now
- 7 days/yr
- Unhealthy air days in 30 yrs
- 7 days/yr
Risk factors via First Street. Map © Google.
Why this score? — see what drove the D grade
The composite is a weighted blend of 9 inputs, each scored 0–100. Each bar is that input's sub-score; the figure is the points it added to the 100-point composite (weight × sub-score).
- ARV discount +15.0/15.0
- Cash flow +6.1/30.0
- Appreciation +5.4/10.0
- Schools +3.6/10.0
- Livability +3.5/5.0
- Condition / age +2.5/5.0
- Rent growth +2.4/5.0
- 1% rule +1.6/10.0
- DSCR +0.4/10.0
$619,500
🖨 Deal sheet 📄 Offer letter ✓ Due diligence
Listing remarks MLS
As noted on photos some are virtually staged. This unit is a cosmetic fixer we will describe as a canvas ready for you to design and customize to your aesthetic. It has a southern greenbelt exposure with treetop views from living room and master bedroom. A 2 bedroom 2 bath unit featuring a spacious floor plan with bedrooms on opposite sides of the living room. 8400 is a much sought-after building on a tree-lined street; Beautiful landscaping; Community rooftop deck with 360 panoramic views; Community pool + spa on street level; Building is FHA approved. Buyer can also inquire about possible renovation / construction loan that can help with renovation costs. Fenced dog park across the street. Nearby: The Sunset Strip, The Sun Rose (formerly The Pendry), Saddle Ranch, Trader Joe's, Starbucks, Gelsens, Landmark Theaters, Equinox gym. Monthly HOA dues, $625.00, includes water, property maintenance + earthquake insurance for structure. Current HOA assessment has been paid off by Seller; zero balance owed. A second Special Assessment has been voted on and will begin in January 2027. Ask agent for details. Trust Sale - Trustee has never lived in the property and has limited information.
Key facts
- Treetop views
- Community pool
- Spacious floor plan
Tags
Neighborhood map
What this means for you Summary
Snapshot
- This is a 2-bed/2.0-bath condo listed at $620k.
Deal economics
- At list price, monthly cash flow is $-1k ($-14k/yr) — negative.
- To cash-flow at today's rent, offer at most $413k (33.3% below list).
- To meet the 1% rule (rent ≥ 1% of price), the offer needs to be $408k (34.1% below list).
- Recommended offer: $408k (34.1% below list) — sets the bar for 1% rule.
- Cap rate 4.0% vs local median 1.5% in West Hollywood — top-decile yield for the area; either an underpriced asset or a hidden risk that comps aren't pricing in. Stress-test before assuming the spread holds.
Location & tenants
- Location reads 70/100 on livability (#239 in CA) — a middle-class / working-renter tenant base. Strengths: schools A+, amenities A+, commute A+; Watch: health & safety C-, crime F, cost of living F.
- Los Angeles Unified (urban): math 29% / reading 54% proficiency, ranked #223 of 517 in CA (top 43%) — families likely to look elsewhere, expect single-tenant / working-renter base with shorter leases; 67% free/reduced lunch — lower-income household profile, screen leases tightly.
- Market conditions: Rents soft (-0.5%/yr); 379 active listings in the ZIP; 40 comparable units currently listed for rent nearby; rentals at typical pace (median 25d on market — plan ~3-4 weeks tenant-placement turnaround); solid renter incomes; 19,697 units permitted in Los Angeles County in 2024 (9,426 in 5+ unit buildings).
- At $4,081/mo this rent would consume 45% of the median local household income ($108k/yr) (locally 2412% of renters already pay >50% of income on rent) — very limited rent-growth headroom before tenants either downsize or default.
Forward outlook
- In year one you build about $9k of equity ($4k loan paydown + $5k appreciation (0.8% local appreciation)).
- Los Angeles County population projected at +9% by 2050 — modest demand growth; plan on rents tracking national, not racing it.
- By year 5, paydown + projected appreciation supports a ~$43k cash-out refi (75% LTV) — recoverable capital for the next deal without selling this one.
Negotiation context
- It's been on market 33 days — a 3% lower offer ($601k) is reasonable based on typical stale-listing flexibility.
- 5 sale attempts since 2y ago with the ask held roughly flat each time — persistent listings suggest the price (not the market) is what's stuck; bring a comps-based counter.
- Current owner paid $105k; list at $620k implies a 490% gain — meaningful room to come down on a strong offer.
Risks & watch-outs
- Climate carrying-cost: extreme-heat days projected 7→22/yr by 2055 (HVAC capex compounding) — expect insurance premiums to compound above CPI over the hold.
Questions for the listing agent
- What do current leases actually rent for vs. the listed asking? Can we see a recent rent roll and the last 12 months of T-12 income?
- It's been on market 33 days. Have you received any prior offers? Is the seller open to a 34% concession, seller financing, or rate buy-down credit?
- Built in 1973 — when were the roof, HVAC, electrical panel, plumbing, and water heater last replaced?
- What does the HOA fee cover, when was the last increase, and are there any pending special assessments or reserve-fund shortfalls?
- Any open or pending special assessments — roof, HVAC, plumbing, elevator, façade? What's the per-unit balance and payoff schedule, and is the seller paying it off at close or rolling it to the buyer?
- Is there a deadline driving the sale (1031 exchange, divorce, estate, relocation)? That informs how much negotiation room exists.
- Schools are A-rated — typically a magnet for longer-tenancy family renters. What's the average tenant stay here, and is there a school-zone premium baked into asking?
- Crime grade is F in this area — have there been break-ins, vandalism, or insurance claims at this property in the last 3 years? What carrier currently insures it and at what premium?
- The area grade is low — what's the realistic commute time and amenity access for the typical tenant pool here? Any planned neighborhood developments (good or bad) we should know about?
- What's the average days-on-market for RENTAL listings here right now (not sales)? A rising rental-DOM trend means longer vacancies and softer asking-rent achievability than the comps imply.
- What's the recent tenant-quality profile in this submarket — average credit score on applications, eviction rate, late-payment / NSF rate, and stable-employment percentage? A property-management company in the area should have these aggregated.
- How much new apartment / multifamily construction is in the pipeline within 1–3 miles? Heavy new supply (>2% of stock underway) typically softens rents 12–24 months out; light construction supports rent growth.
Investment metrics
- 1% rule
- 0.66% ✗
- Cap rate
- 4.03%
- Cash-on-cash
- -8.07%
- DSCR
- 0.64
- GRM
- 12.6
CMA / ARV
- ARV (median comp)
- $1,020,530
- List price
- $619,500
- Delta
- -38.37%
- Verdict
- UNDERPRICED
- Comps
- 20 within 2.0 mi
Projected returns pro-forma
0.76% appreciation · 0.0% rent growth · sell at horizon
- IRR
- -9.7%
- Equity multiple
- 0.53×
- Total profit
- $-81,688
- Equity at exit
- $203,862
- IRR
- -5.4%
- Equity multiple
- 0.40×
- Total profit
- $-104,875
- Equity at exit
- $265,113
Cash invested: $173,460 (down + closing). Projections, not guarantees.
Landlord ↔ Tenant lean methodology
- Overall (STATE)
- 18 Strongly Tenant-Friendly
- State California
- 18 Strongly Tenant-Friendly · D+13
- County
- — inherits STATE
- City
- — inherits STATE
ZIP-level market 90069
- Home prices YoY
- 0.2%
- Rents YoY
- -0.5%
- Active inventory
- 379
- Price-to-rent
- 12.6×
Monthly cashflow live
- Estimated rent
- $4,081 high interval (Pro) →
- Mortgage (P&I)
- −$3,249
- Tax from tax record
- −$258 /mo · $3,102/yr
- Insurance
- −$258
- HOA
- −$625
- Vacancy / Maint / Mgmt
- −$857
- Net cashflow
- $-1,166
Break-even live
UW: 25.0% down · 7.5% · 30yr · 1.5% tax · 5.0% vac · 8.0% maint · 8.0% mgmt
Financing live
Cash to close
- Down payment
- $154,875
- Closing costs
- $18,585
- Reserves months
- —
- Total cash needed
- —
Loan-product check · same deal, 3 products live
Conventional
25% down · 7.5% · 30yr
- Down + closing
- —
- Monthly P&I
- —
- Monthly cashflow
- —
- DSCR
- —
- Eligible?
- —
Personal DTI + credit; lowest rate.
DSCR
20% down · 8.5% · 30yr
- Down + closing
- —
- Monthly P&I
- —
- Monthly cashflow
- —
- DSCR
- —
- Eligible?
- —
No personal income docs; deal must DSCR.
Hard money
10% down · 12.0% · 12mo
- Down + closing
- —
- Monthly P&I
- —
- Monthly cashflow
- —
- DSCR
- —
- Eligible?
- —
Short-term bridge; refi at stabilization.
Rent comps 40 comps
| Address | Beds | Baths | Sqft | Rent | $/sqft | DOM | Units | Dist |
|---|---|---|---|---|---|---|---|---|
| 8400 De Longpre Ave #308 West Hollywood, CA | 1.0 | 1.0 | 882 | $3,245 | $3.68 | 24d | 1 | 0.02mi |
| 8450 De Longpre Ave West Hollywood, CA | 2.0 | 2.0 | 1049 | $4,100 | $3.91 | 1d | 1 | 0.07mi |
| 8397 Fountain Ave Unit 203 West Hollywood, CA | 1.0 | 1.0 | 1100 | $2,490 | $2.26 | 4d | 1 | 0.10mi |
| 1275 N Sweetzer Ave West Hollywood, CA | 2.0 | 2.0 | 1100 | $3,500 | $3.18 | 43d | 1 | 0.11mi |
| 1260 Flores St Unit 5 West Hollywood, CA | 2.0 | 1.0 | 1329 | $3,750 | $2.82 | 7d | 1 | 0.12mi |
| 1257 N Sweetzer Ave Unit 104 West Hollywood, CA | 1.0 | 1.0 | 752 | $3,650 | $4.85 | 24d | 1 | 0.14mi |
| 1257 N Sweetzer Ave Unit 202 West Hollywood, CA | 2.0 | 2.0 | 1156 | $5,795 | $5.01 | 24d | 1 | 0.14mi |
| 1257 N Sweetzer Ave Unit 202 West Hollywood, CA | 2.0 | 2.0 | 1156 | $5,795 | $5.01 | 43d | 1 | 0.14mi |
| 1245 N Kings Rd West Hollywood, CA | 1.0 | 1.0 | 1000 | $2,850 | $2.85 | 43d | 1 | 0.15mi |
| 1264 N Sweetzer Ave West Hollywood, CA | 2.0 | 2.0 | 725 | $3,545 | $4.89 | 4d | 1 | 0.15mi |
| 1233 N Flores St #104 West Hollywood, CA | 1.0 | 1.0 | 710 | $3,350 | $4.72 | 24d | 1 | 0.16mi |
| 1262 N Sweetzer Ave Unit 106 West Hollywood, CA | 1.0 | 1.0 | 800 | $3,200 | $4.00 | 43d | 1 | 0.16mi |
| 1262 N Sweetzer Ave Unit 109 West Hollywood, CA | 2.0 | 2.0 | 1080 | $4,600 | $4.26 | 24d | 1 | 0.16mi |
| 1262 N Sweetzer Ave Unit 105 West Hollywood, CA | 2.0 | 2.0 | 1050 | $4,400 | $4.19 | 24d | 1 | 0.16mi |
| 1323 N Harper Ave Los Angeles, CA | 1.0 | 1.0 | 850 | $2,933 | $3.45 | 43d | 1 | 0.16mi |
| 1232 N Kings Rd West Hollywood, CA | 2.0 | 2.0 | 1230 | $5,064 | $4.12 | 19d | 1 | 0.17mi |
| 8440 Fountain Ave West Hollywood, CA | 2.0 | 2.0 | 1304 | $3,795 | $2.91 | 24d | 1 | 0.19mi |
| 1222 N Olive Dr West Hollywood, CA | 1.0 | 1.0 | 596 | $3,100 | $5.20 | 18d | 2 | 0.19mi |
| 1222 N Olive Dr West Hollywood, CA | 1.0 | 1.0 | 793 | $3,100 | $3.91 | 4d | 1 | 0.19mi |
| 1330 N Harper Ave Unit 108 West Hollywood, CA | 2.0 | 2.0 | 1250 | $6,500 | $5.20 | 24d | 1 | 0.20mi |
| 1330 N Harper Ave Unit 180 West Hollywood, CA | 2.0 | 2.0 | 1250 | $6,200 | $4.96 | 24d | 1 | 0.20mi |
| 1230 N Sweetzer Ave #106 West Hollywood, CA | 1.0 | 1.0 | 750 | $2,950 | $3.93 | 24d | 1 | 0.21mi |
| 1230 N Sweetzer Ave West Hollywood, CA | 1.0 | 1.0 | 715 | $2,722 | $3.81 | 43d | 2 | 0.22mi |
| 1209 N Kings Rd #8 West Hollywood, CA | 2.0 | 1.5 | 1160 | $4,800 | $4.14 | 24d | 1 | 0.22mi |
| 1203 N Sweetzer Ave West Hollywood, CA | 1.0 | 1.0 | 863 | $2,700 | $3.13 | 24d | 2 | 0.23mi |
| 8210 Fountain Ave Unit 103 West Hollywood, CA | 2.0 | 2.0 | 1461 | $4,995 | $3.42 | 2d | 1 | 0.23mi |
| 8281 Norton Ave Unit 8281 1/2 West Hollywood, CA | 1.0 | 1.0 | 750 | $2,595 | $3.46 | 43d | 1 | 0.23mi |
| 1301 Havenhurst Dr West Hollywood, CA | 1.0–2.0 | 1.0–2.0 | 900 | $6,399 | $7.11 | 3d | 5 | 0.24mi |
| 1228 N La Cienega Blvd West Hollywood, CA | 2.0 | 2.0 | 1204 | $3,900 | $3.24 | 43d | 1 | 0.24mi |
| 1120 Flores St Unit 05 West Hollywood, CA | 1.0 | 1.0 | 800 | $2,895 | $3.62 | 2d | 1 | 0.25mi |
| 1283 Havenhurst Dr #204 West Hollywood, CA | 3.0 | 2.0 | 1320 | $5,850 | $4.43 | 24d | 1 | 0.25mi |
| 1283 Havenhurst Dr #306 West Hollywood, CA | 3.0 | 2.0 | 1480 | $6,200 | $4.19 | 43d | 1 | 0.25mi |
| 1121 N Olive Dr #209 West Hollywood, CA | 2.0 | 2.0 | 1193 | $3,750 | $3.14 | 43d | 1 | 0.26mi |
| 8491 Fountain Ave Unit I-2 West Hollywood, CA | 1.0 | 1.0 | 1320 | $4,327 | $3.28 | 2d | 1 | 0.26mi |
| 8491 Fountain Ave Unit B-2 West Hollywood, CA | 1.0 | 1.0 | 1200 | $4,500 | $3.75 | 2d | 1 | 0.26mi |
| 1114 Kings Rd Unit 05 (1/1) West Hollywood, CA | 1.0 | 1.0 | 1050 | $2,850 | $2.71 | 7d | 1 | 0.26mi |
| 1155 Hacienda Pl West Hollywood, CA | 1.0 | 1.0 | 854 | $2,350 | $2.75 | 43d | 1 | 0.26mi |
| 8500 W Sunset Blvd West Hollywood, CA | 2.0 | 1.0–2.5 | 1197 | $11,395 | $9.52 | 1d | 10 | 0.27mi |
| 8500 W Sunset Blvd Unit E602 West Hollywood, CA | 2.0 | 2.5 | 1215 | $9,350 | $7.70 | 43d | 1 | 0.27mi |
| 8500 W Sunset Blvd Unit E711 West Hollywood, CA | 1.0 | 1.0 | 885 | $6,500 | $7.34 | 43d | 1 | 0.27mi |
HOA detail condo
- Monthly dues
- $625 · $7,500/yr
- Likely covers
- waterlandscapingpoolgym
- ⚠ Special-assessment mentions
-
…+ earthquake insurance for structure. Current HOA assessment has been paid off by Seller; zero balance owed. A second Special Assessment has been voted on and will begin in January 2027. Ask agent for details. Trust Sale - Trustee has never lived in the…
Listing history 25 events
-
2026-06-18days on market $619,500 Active 33 DOM
-
2026-06-17days on market $619,500 Active 32 DOM
-
2026-06-16days on market $619,500 Active 31 DOM
-
2026-06-15days on market $619,500 Active 30 DOM
-
2026-06-13days on market $619,500 Active 28 DOM
-
2026-06-09days on market $619,500 Active 24 DOM
-
2026-06-08days on market $619,500 Active 23 DOM
-
2026-06-07days on market $619,500 Active 22 DOM
-
2026-06-04days on market $619,500 Active 19 DOM
-
2026-06-03days on market $619,500 Active 18 DOM
-
2026-06-02days on market $619,500 Active 17 DOM
-
2026-06-01days on market $619,500 Active 16 DOM
-
2026-05-31days on market $619,500 Active 15 DOM
-
2026-05-16$619,500 Active 1201-char remark
Show marketing remark (1201 chars)
As noted on photos some are virtually staged. This unit is a cosmetic fixer we will describe as a canvas ready for you to design and customize to your aesthetic. It has a southern greenbelt exposure with treetop views from living room and master bedroom. A 2 bedroom 2 bath unit featuring a spacious floor plan with bedrooms on opposite sides of the living room. 8400 is a much sought-after building on a tree-lined street; Beautiful landscaping; Community rooftop deck with 360 panoramic views; Community pool + spa on street level; Building is FHA approved. Buyer can also inquire about possible renovation / construction loan that can help with renovation costs. Fenced dog park across the street. Nearby: The Sunset Strip, The Sun Rose (formerly The Pendry), Saddle Ranch, Trader Joe's, Starbucks, Gelsens, Landmark Theaters, Equinox gym. Monthly HOA dues, $625.00, includes water, property maintenance + earthquake insurance for structure. Current HOA assessment has been paid off by Seller; zero balance owed. A second Special Assessment has been voted on and will begin in January 2027. Ask agent for details. Trust Sale - Trustee has never lived in the property and has limited information.
-
2026-04-21price
-
2026-03-18price
-
2026-02-19price
-
2026-01-21price
-
2025-11-13Active
-
2025-10-19price
-
2025-09-26price
-
2025-09-18Active
-
2025-02-13status Active
-
2024-12-21Active
-
1979-11-09soldstatus $105,000
ⓘ Source: listings_history table (triggers on properties + properties_extension) + one-shot
backfill from property_details.listing_events for pre-trigger history.
Tax reassessment forecast CA · Resets to sale price
- Current annual tax
- $3,102 · $258/mo
- Projected year-2 tax
- $4,708 · $392/mo
- Expected delta
- +$1,606/yr (+$134/mo · 51.8%)
ⓘ Screening estimate from a state-policy table — verify with the county assessor before closing.
Climate risk First Street
- Flood 1/10 Low FEMA zone X (unshaded) · 0% chance over 30 yrs
- Wildfire 1/10 Low
- Heat 6/10 Major 7 d/yr ≥88°F today · 22 d/yr by 30 yrs out
- Wind 1/10 Low
- Air quality 5/10 Major 7 unhealthy d/yr today · 7 by 30 yrs out
Nearby sold comps map
Loading sold comps map…
Walkable amenities ~0.75 mi
Loading nearby amenities…
Taxation est. · year 1
- Rental income
- $48,975
- − Mortgage interest
- −$34,702
- − Property taxes
- −$3,102
- − Insurance
- −$3,098
- − Repairs & maintenance
- −$3,918
- − Management
- −$3,918
- − HOA
- −$7,500
- − Depreciation
- −$18,022
- Taxable loss
- −$25,284
- Est. tax savings @ 24.0%
- +$6,068
- After-tax cash flow
- $-7,926/yr
For passive investors: Depreciation is non-cash, so a rental often shows a tax loss while cash-flowing — sheltering income. Rental losses are passive: they offset passive income freely, and up to $25,000/yr can offset ordinary (W-2) income if you actively participate and your MAGI is under $100k (phasing out to $0 by $150k); unused losses carry forward. On sale, claimed depreciation is recaptured at up to 25%, and gains may owe capital-gains tax (a 1031 exchange can defer both). Figures are a year-1 estimate at your 24.0% rate — not tax advice; consult a CPA.
Schools (NCES district)
- District
- Los Angeles Unified
- NCES district ID
- 0622710
- Math proficiency
- 29% ▼ -4.00%
- Reading proficiency
- 54% ▲ 10.00%
- Median HH income
- $50,403
- Composite
- 35.67/100
- National rank
- #4875
- State rank
- #223 of 517 in CA
Livability — West Hollywood
- Score
- 70/100
- State rank
- #239
- US rank
- #7852
Category grades
Schools grade is shown separately in the Schools card above.
Census & demographics
- Census place
- West Hollywood, CA
- County
- Los Angeles County · 9,444,647 people
- City population
- 20,961
- Metro
- Los Angeles-Long Beach-Anaheim, CA
- Population (ZIP)
- 20,961
- Household income
- $107,987
- Rent vs Own
- Severe rent burden
- 2412.0
Population outlook (Los Angeles County) Hauer SSP2
- Today (2025)
- 10,940,515 people
- By 2030
- 11,256,481 · +2.9%
- By 2040
- 11,729,929 · +7.2%
- By 2050
- 11,948,407 · +9.2%
- By 2075
- 11,818,114 · +8.0%
- By 2100
- 10,842,928 · -0.9%
Race, ethnicity, and origin ACS 2023
- Neighborhood character
- Predominantly White (77%)
- Race & ethnicity
- White 77% Hispanic / Latino 8% Two or more races 8% Asian 6% Black 3%
- Hispanic origin (detail)
- Mexican 4%
- Common ancestry
- Scotch-Irish 6% Lithuanian 4% Italian 4%
- Foreign-born
- 21% · Canada, China, Jamaica
- Languages at home
- 77% English-only · Spanish 7% Other Indo-European 4% Russian/Polish/Slavic 3%
Political lean MEDSL · Los Angeles
- 2024 margin
- Solid D (+32.9) · D 64.8% · R 31.9% · Other 3.3%
- 2008→2024 swing
- -7.4pp toward R · 2008: 40.4pp · 2024: 32.9pp
- All cycles
- 2024: D+32.9 2020: D+44.2 2016: D+48.0 2012: D+40.0 2008: D+40.4
Not yet ingested
- Civics
- —
Market trends
- HPI YoY
- ▲ 0.76%
- Current HPI
- 323.1842
- Rent YoY
- ▼ -0.54%
- Metro
- Los Angeles-Long Beach-Anaheim, CA
- State GDP YoY
- ▲ 3.21%
- F500 in state
- 116
Industry mix (Fortune 500 HQ in CA)
| Industry | F500 HQs | Revenue |
|---|---|---|
| Technology | 27 | $1,492B |
|
||
| Financial Services | 3 | $174B |
|
||
| Retail | 3 | $44B |
|
||
| Insurance | 3 | $26B |
|
||
| Media / Entertainment | 2 | $115B |
|
||
| Pharmaceuticals / Biotech | 2 | $62B |
|
||
Price history
+490.0% since first listed12 events — show timeline
- 2026-05-16 Listed $619,500 TheMLS
- 2026-04-21 Price Changed — TheMLS
- 2026-03-18 Price Changed — TheMLS
- 2026-02-19 Price Changed — TheMLS
- 2026-01-21 Price Changed — TheMLS
- 2025-11-13 Listed — TheMLS
- 2025-10-19 Price Changed — TheMLS
- 2025-09-26 Price Changed — TheMLS
- 2025-09-18 Listed — TheMLS
- 2025-02-13 Relisted — TheMLS
- 2024-12-21 Listed — TheMLS
- 1979-11-09 Sold (Public Records) $105,000 Public Records
Property tax history
+1.8%/yrLatest (2025): $3,102 · +3.0% YoY. Source: county tax records.
Cash-flow waterfall
monthlySold comps — $/sqft
last 12 mo · ≤1 miLoading sold comps…