14 Elwood Ct · Florissant, MO
Flood risk 1/10 · Minimal
- FEMA flood zone
- X (unshaded)
- Chance of flooding over 30 yrs
- 0.0%
- Est. flood insurance / yr
- $507 – $1,088
Fire risk 1/10 · Minimal
- Est. fire insurance / yr
- $1,054 – $1,958
Heat risk 5/10 · Moderate
- Hot days now (above 105°F)
- 7 days/yr
- Hot days in 30 yrs
- 21 days/yr
Wind risk 2/10 · Minimal
- Chance of severe wind over 30 yrs
- 1.0%
Air-quality risk 3/10 · Minor
- Unhealthy air days now
- 3 days/yr
- Unhealthy air days in 30 yrs
- 5 days/yr
Risk factors via First Street. Map © Google.
Why this score? — see what drove the D+ grade
The composite is a weighted blend of 9 inputs, each scored 0–100. Each bar is that input's sub-score; the figure is the points it added to the 100-point composite (weight × sub-score).
- Cash flow +21.6/30.0
- DSCR +6.9/10.0
- 1% rule +5.2/10.0
- ARV discount +4.5/15.0
- Livability +3.7/5.0
- Rent growth +3.6/5.0
- Condition / age +2.5/5.0
- Schools +1.7/10.0
- Appreciation +0.0/10.0
$165,000
🖨 Deal sheet (PDF) 📄 Offer letter ✓ Due diligence
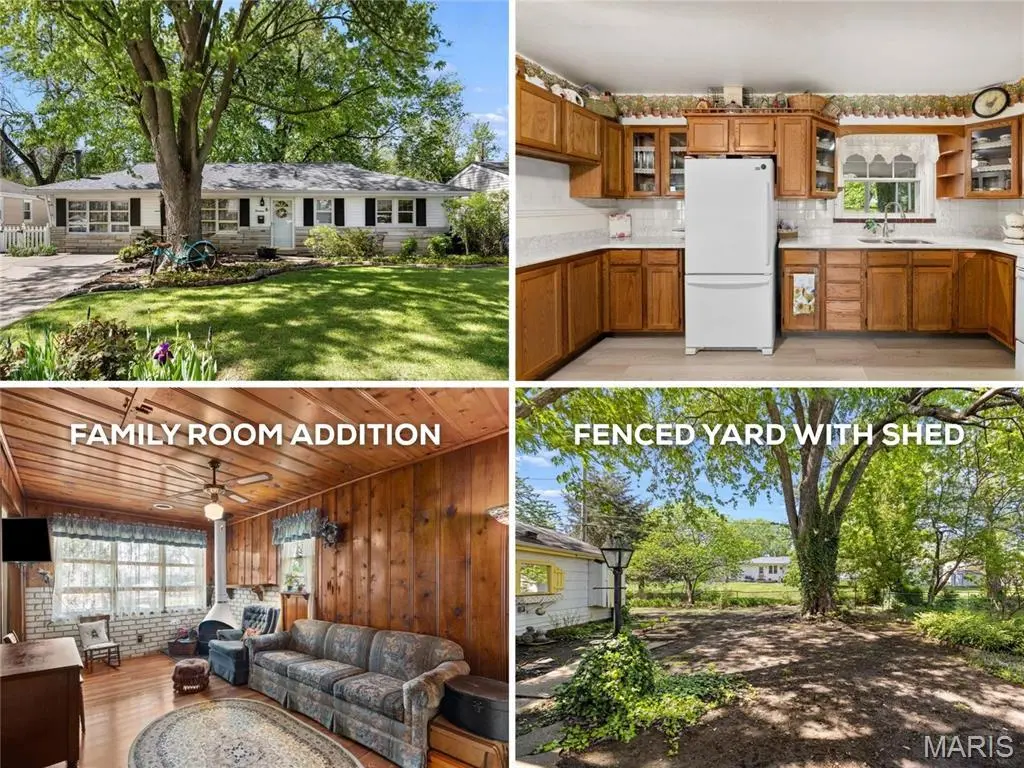
Listing remarks
First time on market! Adorable 3-bedroom ranch with family room addition in QUIET COURT, with park-like backyard - short walk to Behlmann Park with playground, near KOCH PARK Aquatic Center. Classic CURB APPEAL with brick/stone detail, vinyl siding soffit/fascia, post light, front porch sitting area, lush landscaping and DOUBLE DRIVEWAY. Bright open living room with HARDWOOD flooring steps down to cozy family room with pine-clad walls, woodburning Zircon-style RETRO FIREPLACE, breezy ceiling fan and easy-care laminate flooring. Eat-in kitchen with generous wood custom cabinets, glass door accents and tile backsplash. Lots of COUNTER SPACE, storage pantry, gas range and microwave hood. Step
Key facts
- 7,627 sq ft lot
- 4 parking spots
- Community pool
Property features AI
Finance
- Other: Private ownership; Located on a cul-de-sac; lot is level, landscaped and near public transit
- Financial info: Lease not considered
- HOA & community: Community amenities include park, playground, pool, sidewalks, street lights, trails, and public bus access; Suburban neighborhood
Exterior
- Parking: Parking for four vehicles; Concrete driveway, paved parking pad and off-street parking; Private parking with RV access
- Security: Storm door(s)
- Utilities: Public water; Public sewer; Single-phase electric; Electricity, natural gas, sewer and water connected
- Home design: Single-family residence (attached property); One story; Slab foundation
- Construction: Brick veneer and vinyl siding; Architectural shingle roof
- Exterior features: Covered patio and porch; Screened porch; Private yard with garden and landscaping; Outdoor lighting; Private entrance; Storage shed; Back yard fencing with chain link and gate
Interior
- Kitchen: Gas range; Microwave; Water heater
- Bedrooms: Three bedrooms on the main level
- Flooring: Carpet; Laminate; Simulated wood; Vinyl; Wood
- Bathrooms: One full bathroom; One half bathroom (main level)
- Heating & cooling: Forced air heating; Central air conditioning; Ceiling fans
- Interior features: Ceiling fans; Eat-in kitchen; Open floorplan; Pantry; Storage; Whirlpool
- Laundry & utility: Main-level laundry room with washer and electric dryer hookups; Laundry located inside
Neighborhood map
What this means for you Summary
Snapshot
- This is a 3-bed/1.0-bath single-family listed at $165k.
Deal economics
- At list price, monthly cash flow is $251 ($3k/yr) — positive.
- The deal already cash-flows at list — no discount required.
- Meets the 1% rule at list price ($2k rent vs $165k).
- Cap rate 8.1% vs local median 6.2% in Florissant — top-decile yield for the area; either an underpriced asset or a hidden risk that comps aren't pricing in. Stress-test before assuming the spread holds.
Location & tenants
- Location reads 73/100 on livability (#82 in MO) — a middle-class / working-renter tenant base. Strengths: cost of living A+, housing A+, health & safety B+; Watch: crime C-, amenities D+, commute F.
- Hazelwood (suburban): math 11% / reading 26% proficiency, ranked #306 of 324 in MO (top 94%) — low school quality limits family demand, transient renter base, plan for 1-2y turnover.
- Zoned schools: Lawson Elem. (math 12% / reading 27%, grade F, #941 of 1,115 statewide, top 86%, 348 students, 65% FRL); Northwest Middle (math 18% / reading 26%, grade F, #332 of 391 statewide, top 86%, 767 students, 62% FRL); Hazelwood West High (math 16% / reading 42%, grade F, #407 of 521 statewide, top 78%, 2,042 students, 54% FRL).
- Market conditions: Rents rising fast (+4.3%/yr); 273 active listings in the ZIP; 40 comparable units currently listed for rent nearby; rentals at typical pace (median 15d on market — plan ~3-4 weeks tenant-placement turnaround); 920 units permitted in St. Louis County in 2024 (250 in 5+ unit buildings).
Forward outlook
- Local home prices are declining (-3.0%/yr); year-one equity from $1k of loan paydown is wiped out by about $5k of value loss. Plan a longer hold.
Negotiation context
- Only 13 days on market — expect competitive offers; lowballing is unlikely to land.
- 2 sale attempts with the ask held roughly flat each time — persistent listings suggest the price (not the market) is what's stuck; bring a comps-based counter.
Risks & watch-outs
- Watch-outs: built in 1954 — expect roof / HVAC / electrical / plumbing capex.
- Climate carrying-cost: extreme-heat days projected 7→21/yr by 2055 (HVAC capex compounding) — expect insurance premiums to compound above CPI over the hold.
Questions for the listing agent
- Built in 1954 — when were the roof, HVAC, electrical panel, plumbing, and water heater last replaced?
- Is there a deadline driving the sale (1031 exchange, divorce, estate, relocation)? That informs how much negotiation room exists.
- Schools are D-rated, which usually means shorter tenancies and higher turnover. Who's the typical renter profile here, and what's been the actual vacancy rate?
- The area grade is low — what's the realistic commute time and amenity access for the typical tenant pool here? Any planned neighborhood developments (good or bad) we should know about?
- What's the average days-on-market for RENTAL listings here right now (not sales)? A rising rental-DOM trend means longer vacancies and softer asking-rent achievability than the comps imply.
- What's the recent tenant-quality profile in this submarket — average credit score on applications, eviction rate, late-payment / NSF rate, and stable-employment percentage? A property-management company in the area should have these aggregated.
- How much new for-sale + rental construction is in the pipeline within 1–3 miles? Heavy new supply typically softens prices + rents 12–24 months out; constrained supply supports both.
Investment metrics
- 1% rule
- 1.02% ✓
- Cap rate
- 8.12%
- Cash-on-cash
- 6.52%
- DSCR
- 1.29
- GRM
- 8.2
CMA / ARV
- ARV (median comp)
- $154,604
- List price
- $165,000
- Delta
- 6.72%
- Verdict
- FAIR
- Comps
- 20 within 1.0 mi
Show comp detail 12 sales within ~0.75 mi
| Address | Dist | Beds/Ba | Sqft | Sold | Price | $/sf | Match |
|---|---|---|---|---|---|---|---|
| 14 Elwood Ct | 0.00mi | 3/1.5 | 1,272 (0%) | 0mo | $165,000 | $130 | 98 |
| 22 Blanchette Dr | 0.21mi | 4/2.0 (+1) | 1,282 (+1%) | 4mo | $165,000 | $129 | 77 |
| 335 Gerald Ave | 0.45mi | 3/2.0 | 1,210 (-5%) | 1mo | $189,900 | $157 | 66 |
| 19 Blanchette Dr | 0.18mi | 3/2.0 | 1,118 (-12%) | 2mo | $169,900 | $152 | 66 |
| 1954 Tealwood Cove Dr | 0.49mi | 3/2.0 | 1,323 (+4%) | 2mo | $220,000 | $166 | 65 |
| 737 Charbonier Rd | 0.41mi | 3/2.0 | 1,171 (-8%) | 2mo | $79,900 | $68 | 62 |
| 1973 Tealwood Cove Dr | 0.54mi | 3/2.0 | 1,195 (-6%) | 2mo | $220,000 | $184 | 59 |
| 290 Francisca Dr | 0.64mi | 3/1.5 | 1,092 (-14%) | 1mo | $145,000 | $133 | 44 |
| 695 Loyola Dr | 0.61mi | 3/1.5 | 1,092 (-14%) | 3mo | $156,000 | $143 | 43 |
| 715 Gonzaga Ln | 0.59mi | 3/2.5 | 1,092 (-14%) | 2mo | $200,000 | $183 | 42 |
| 770 Kostka Ln | 0.72mi | 3/1.5 | 1,444 (+14%) | 1mo | $199,900 | $138 | 41 |
| 1215 Kostka Ln | 0.60mi | 3/2.5 | 1,437 (+13%) | 4mo | $239,900 | $167 | 41 |
Match score weights: distance 35% · size 25% · config 20% · recency 20%. Top-matched comps best support the ARV.
Projected returns pro-forma
-3.0% appreciation · 4.27% rent growth · sell at horizon
- IRR
- -4.9%
- Equity multiple
- 0.81×
- Total profit
- $-8,591
- Equity at exit
- $24,602
- IRR
- 6.1%
- Equity multiple
- 1.48×
- Total profit
- $22,211
- Equity at exit
- $14,266
Cash invested: $46,200 (down + closing). Projections, not guarantees.
Landlord ↔ Tenant lean methodology
- Overall (STATE)
- 81 Strongly Landlord-Friendly
- State Missouri
- 81 Strongly Landlord-Friendly · R+10
- County
- — inherits STATE
- City
- — inherits STATE
ZIP-level market 63031
- Rents YoY
- 4.3%
- Active inventory
- 273
- Price-to-rent
- 8.2×
Monthly cashflow live
- Estimated rent
- $1,682 high interval (Pro) →
- Mortgage (P&I)
- −$865
- Tax from tax record
- −$144 /mo · $1,725/yr
- Insurance
- −$69
- HOA
- −$0
- Lot rent
- −$0
- Vacancy / Maint / Mgmt
- −$353
- Net cashflow
- $251
Break-even live
Sensitivity live
| Price | -10% $344 | -5% $298 | +0% $251 | +5% $204 | +10% $158 |
|---|---|---|---|---|---|
| Rent | -10% $118 | -5% $185 | +0% $251 | +5% $317 | +10% $384 |
| Rate | -1.0pp $334 | -0.5pp $293 | base $251 | +0.5pp $208 | +1.0pp $165 |
UW: 25.0% down · 7.5% · 30yr · 1.5% tax · 5.0% vac · 8.0% maint · 8.0% mgmt
Financing live
Cash to close
- Down payment
- $41,250
- Closing costs
- $4,950
- Reserves months
- —
- Total cash needed
- —
Loan-product check · same deal, 3 products live
Conventional
25% down · 7.5% · 30yr
- Down + closing
- —
- Monthly P&I
- —
- Monthly cashflow
- —
- DSCR
- —
- Eligible?
- —
Personal DTI + credit; lowest rate.
DSCR
20% down · 8.5% · 30yr
- Down + closing
- —
- Monthly P&I
- —
- Monthly cashflow
- —
- DSCR
- —
- Eligible?
- —
No personal income docs; deal must DSCR.
Hard money
10% down · 12.0% · 12mo
- Down + closing
- —
- Monthly P&I
- —
- Monthly cashflow
- —
- DSCR
- —
- Eligible?
- —
Short-term bridge; refi at stabilization.
Rent comps 40 comps
| Address | Beds | Baths | Sqft | Rent | $/sqft | DOM | Units | Dist |
|---|---|---|---|---|---|---|---|---|
| 17 Elwood Ct Florissant, MO | 3.0 | 2.0 | 1572 | $1,945 | $1.24 | 4d | 1 | 0.04mi |
| 1015 Lindsay Ln Florissant, MO | 3.0 | 2.0 | 988 | $1,600 | $1.62 | 26d | 1 | 0.42mi |
| 785 Florland Dr Florissant, MO | 3.0 | 1.0 | 1100 | $1,700 | $1.55 | 20d | 1 | 0.46mi |
| 9 Charlotte Dr Florissant, MO | 3.0 | 1.5 | 1404 | $1,561 | $1.11 | 1d | 1 | 0.56mi |
| 1505 Miller Dr Florissant, MO | 3.0 | 3.0 | 1246 | $1,750 | $1.40 | 0d | 1 | 0.63mi |
| 13 Bruce Dr Unit Bruce 13-2 Florissant, MO | 2.0 | 1.0 | 880 | $975 | $1.11 | 46d | 1 | 0.66mi |
| 13 Bruce Dr Florissant, MO | 2.0 | 1.0 | 880 | $975 | $1.11 | 26d | 1 | 0.66mi |
| 14 Bruce Dr Unit Bruce 14-4 Florissant, MO | 2.0 | 1.0 | 880 | $975 | $1.11 | 46d | 1 | 0.66mi |
| 858 Hazelvalley Dr Hazelwood, MO | 3.0 | 1.5 | 912 | $1,450 | $1.59 | 46d | 1 | 0.68mi |
| 765 Babler Dr Florissant, MO | 3.0 | 2.0 | 888 | $1,700 | $1.91 | 10d | 1 | 0.73mi |
| 855 Daniel Boone Dr Florissant, MO | 3.0 | 1.0 | 964 | $1,400 | $1.45 | 46d | 1 | 0.75mi |
| 1540 Aspen Dr Florissant, MO | 3.0 | 2.0 | 912 | $1,395 | $1.53 | 10d | 1 | 0.78mi |
| 1540 Aspen Dr Florissant, MO | 3.0 | 2.0 | 912 | $1,395 | $1.53 | 1d | 1 | 0.78mi |
| 4 Sharon Ct Florissant, MO | 3.0 | 2.0 | 1108 | $1,800 | $1.62 | 0d | 1 | 0.82mi |
| 14 Rivermeadows Dr Florissant, MO | 3.0 | 2.0 | 1587 | $2,386 | $1.50 | 17d | 1 | 0.87mi |
| 1145 Swallow Ln Florissant, MO | 3.0 | 2.0 | 1288 | $1,645 | $1.28 | 5d | 1 | 0.90mi |
| 1725 Fernbrook Ln Florissant, MO | 3.0 | 1.0 | 925 | $1,485 | $1.61 | 1d | 1 | 0.93mi |
| 1395 Bluebird Dr Florissant, MO | 3.0 | 2.0 | 1168 | $1,599 | $1.37 | 18d | 1 | 0.95mi |
| 2280 Keeven Ln Florissant, MO | 1.0–3.0 | 1.0–1.5 | 805 | $1,290 | $1.60 | 0d | 14 | 1.02mi |
| 446 Olian Dr Hazelwood, MO | 2.0 | 1.0 | 880 | $975 | $1.11 | 4d | 1 | 1.03mi |
| 116 Graham Rd Florissant, MO | 3.0 | 2.0 | 1578 | $1,495 | $0.95 | 4d | 1 | 1.04mi |
| 2245 Lindsay Ln Florissant, MO | 4.0 | 2.0 | 1466 | $1,800 | $1.23 | 18d | 1 | 1.05mi |
| 470 Hundley Dr Florissant, MO | 3.0 | 2.0 | 962 | $1,595 | $1.66 | 46d | 1 | 1.05mi |
| 7323 Landi Ct Hazelwood, MO | 3.0 | 1.5 | 1032 | $1,495 | $1.45 | 1d | 1 | 1.07mi |
| 2400 Teakwood Manor Dr Florissant, MO | 3.0 | 2.0 | 1380 | $1,725 | $1.25 | 46d | 1 | 1.11mi |
| 1315 Bobolink Dr Florissant, MO | 3.0 | 2.0 | 1025 | $1,700 | $1.66 | 14d | 1 | 1.13mi |
| 240 Chez Vant Ct Hazelwood, MO | 2.0 | 1.5 | 1440 | $1,350 | $0.94 | 46d | 1 | 1.13mi |
| 2485 Jenkee Dr Florissant, MO | 3.0 | 1.0 | 960 | $1,376 | $1.43 | 0d | 1 | 1.14mi |
| 1095 Humes Ln Florissant, MO | 3.0 | 1.5 | 1100 | $1,650 | $1.50 | 6d | 1 | 1.18mi |
| 750 Carriage Ln Hazelwood, MO | 4.0 | 2.0 | 1701 | $2,026 | $1.19 | 14d | 1 | 1.18mi |
| 1095 Cedar Pl Florissant, MO | 3.0 | 1.5 | 1107 | $1,710 | $1.54 | 1d | 1 | 1.18mi |
| 537 Lynn Haven Ln Hazelwood, MO | 3.0 | 2.0 | 1242 | $1,675 | $1.35 | 26d | 1 | 1.28mi |
| 16 Mary Rose Ct Hazelwood, MO | 3.0 | 2.0 | 1506 | $1,706 | $1.13 | 17d | 1 | 1.33mi |
| 2160 Splendor Dr Florissant, MO | 3.0 | 2.0 | 1100 | $1,800 | $1.64 | 5d | 1 | 1.34mi |
| 623 Holiday Ave Hazelwood, MO | 3.0 | 2.0 | 1176 | $1,591 | $1.35 | 14d | 1 | 1.34mi |
| 532 Holiday Ave Hazelwood, MO | 3.0 | 1.0 | 912 | $1,350 | $1.48 | 46d | 1 | 1.36mi |
| 3 Champlain Ct Florissant, MO | 3.0 | 1.0 | 1100 | $1,600 | $1.45 | 46d | 1 | 1.39mi |
| 1545 Swan Dr Florissant, MO | 3.0 | 1.0 | 1064 | $1,590 | $1.49 | 10d | 1 | 1.41mi |
| 9 Saint Celeste Dr Florissant, MO | 3.0 | 1.0 | 992 | $1,450 | $1.46 | 46d | 1 | 1.42mi |
| 1939 Suns Up Way Florissant, MO | 2.0 | 2.5 | 1544 | $1,700 | $1.10 | 5d | 1 | 1.47mi |
Listing history 5 events
-
2026-05-19status Pending 1161-char remark
-
2026-05-09status Active 1161-char remark
-
2026-04-29status Pending 1161-char remark
-
2026-04-26$165,000 Active 1161-char remark
-
2026-04-20historical $165,000 1161-char remark
ⓘ Source: listings_history table (triggers on properties + properties_extension) + one-shot
backfill from property_details.listing_events for pre-trigger history.
Tax reassessment forecast MO · Resets to sale price
- Current annual tax
- $1,725 · $144/mo
- Projected year-2 tax
- $1,725 · $144/mo
- Expected delta
- $0/yr ($0/mo · -0.0%)
ⓘ Screening estimate from a state-policy table — verify with the county assessor before closing.
Climate risk First Street
- Flood 1/10 Low FEMA zone X (unshaded) · 0% chance over 30 yrs
- Wildfire 1/10 Low
- Heat 5/10 Major 7 d/yr ≥105°F today · 21 d/yr by 30 yrs out
- Wind 2/10 Low 100% chance of damaging wind over 30 yrs
- Air quality 3/10 Moderate 3 unhealthy d/yr today · 5 by 30 yrs out
Nearby sold comps map
Loading sold comps map…
Walkable amenities ~0.75 mi
Loading nearby amenities…
Taxation est. · year 1
- Rental income
- $20,183
- − Mortgage interest
- −$9,243
- − Property taxes
- −$1,725
- − Insurance
- −$825
- − Repairs & maintenance
- −$1,615
- − Management
- −$1,615
- − Depreciation
- −$4,800
- Taxable income
- $361
- Est. tax owed @ 24.0%
- −$87
- After-tax cash flow
- $2,925/yr
For passive investors: Depreciation is non-cash, so a rental often shows a tax loss while cash-flowing — sheltering income. Rental losses are passive: they offset passive income freely, and up to $25,000/yr can offset ordinary (W-2) income if you actively participate and your MAGI is under $100k (phasing out to $0 by $150k); unused losses carry forward. On sale, claimed depreciation is recaptured at up to 25%, and gains may owe capital-gains tax (a 1031 exchange can defer both). Figures are a year-1 estimate at your 24.0% rate — not tax advice; consult a CPA.
Schools (NCES district)
- District
- Hazelwood
- NCES district ID
- 2913830
- Math proficiency
- 11% ▼ -13.00%
- Reading proficiency
- 26% ▼ -6.00%
- Median HH income
- $51,621
- Composite
- 16.77/100
- National rank
- #9156
- State rank
- #306 of 324 in MO
Livability — Florissant
- Score
- 73/100
- State rank
- #82
- US rank
- #5406
Category grades
Schools grade is shown separately in the Schools card above.
Census & demographics
- Census place
- Florissant, MO
- County
- Saint Louis County · 888,823 people
- City population
- 69,104
- Metro
- St. Louis, MO-IL
- Population (ZIP)
- 50,196
- Household income
- $70,811
- Rent vs Own
- Severe rent burden
- 1279.0
Population outlook (St. Louis County) Hauer SSP2
- Today (2025)
- 1,025,227 people
- By 2030
- 1,028,023 · +0.3%
- By 2040
- 1,020,940 · -0.4%
- By 2050
- 1,007,280 · -1.8%
- By 2075
- 987,277 · -3.7%
- By 2100
- 921,984 · -10.1%
Race, ethnicity, and origin ACS 2023
- Neighborhood character
- Diverse neighborhood (Simpson 0.58)
- Race & ethnicity
- White 49% Black 41% Two or more races 7% Hispanic / Latino 2%
- Common ancestry
- Romanian 3% Lithuanian 3% Swedish 1%
- Foreign-born
- 5% · Canada, Jamaica
- Languages at home
- 94% English-only · Spanish 2% Arabic 1%
Political lean MEDSL · St. Louis
- 2024 margin
- Strong D (+23.4) · D 60.8% · R 37.4% · Other 1.7%
- 2008→2024 swing
- +3.5pp toward D · 2008: 19.9pp · 2024: 23.4pp
- All cycles
- 2024: D+23.4 2020: D+24.0 2016: D+16.2 2012: D+13.7 2008: D+19.9
Not yet ingested
- Civics
- —
Market trends
- HPI YoY
- ▼ -223.57%
- Current HPI
- 202.7192
- Rent YoY
- ▲ 4.27%
- Metro
- St. Louis, MO-IL
- State GDP YoY
- ▲ 1.84%
- F500 in state
- 20
Industry mix (Fortune 500 HQ in MO)
| Industry | F500 HQs | Revenue |
|---|---|---|
| Healthcare | 1 | $163B |
|
||
| Insurance | 1 | $21B |
|
||
| Industrial Technology | 1 | $17B |
|
||
| Retail | 1 | $16B |
|
||
| Industrial Distribution | 1 | $10B |
|
||
| Utilities | 1 | $9B |
|
||
Price history
+0.0% since first listed6 events — show timeline
- 2026-06-17 Sold (MLS) — MARIS as Distributed by MLS Grid
- 2026-05-19 Pending — MARIS as Distributed by MLS Grid
- 2026-05-09 Relisted — MARIS as Distributed by MLS Grid
- 2026-04-29 Pending — MARIS as Distributed by MLS Grid
- 2026-04-26 Listed $165,000 MARIS as Distributed by MLS Grid
- 2026-04-20 Coming Soon $165,000 MARIS as Distributed by MLS Grid
Property tax history
+2.6%/yrLatest (2022): $1,725 · +2.6% YoY. Source: county tax records.
Cash-flow waterfall
monthlySold comps — $/sqft
last 12 mo · ≤1 miLoading sold comps…