400 N Main St · North Baltimore, OH
Flood risk 1/10 · Minimal
- FEMA flood zone
- X (unshaded)
- Chance of flooding over 30 yrs
- 0.0%
- Est. flood insurance / yr
- $507 – $1,088
Fire risk 1/10 · Minimal
- Est. fire insurance / yr
- $713 – $1,323
Heat risk 3/10 · Minor
- Hot days now (above 99°F)
- 7 days/yr
- Hot days in 30 yrs
- 17 days/yr
Wind risk 2/10 · Minimal
- Chance of severe wind over 30 yrs
- —
Air-quality risk 2/10 · Minimal
- Unhealthy air days now
- 1 days/yr
- Unhealthy air days in 30 yrs
- 2 days/yr
Risk factors via First Street. Map © Google.
Why this score? — see what drove the C- grade
The composite is a weighted blend of 9 inputs, each scored 0–100. Each bar is that input's sub-score; the figure is the points it added to the 100-point composite (weight × sub-score).
- ARV discount +15.0/15.0
- Cash flow +14.7/30.0
- DSCR +4.5/10.0
- Schools +4.4/10.0
- Livability +3.9/5.0
- 1% rule +3.5/10.0
- Rent growth +2.5/5.0
- Condition / age +2.5/5.0
- Appreciation +0.0/10.0
$175,000
🖨 Deal sheet (PDF) 📄 Offer letter ✓ Due diligence
Listing remarks
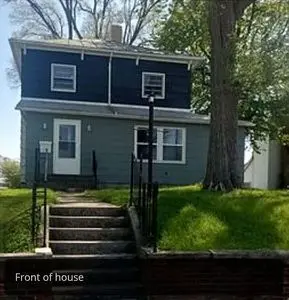
This is a large family home with 4 to 6 bedrooms and two full bathrooms. Most of the house has been recently painted, there are many new floors as well as mama in the bathroom and entryway. The built-in storage and display cabin tree really looks great with the updated paint colors throughout the house. It has a very flexible floor plan and can be set up in a variety of ways including also as a mother-in-law suite or teenager area. There is a master bedroom downstairs or you could use as a master bedroom upstairs depending upon your needs. There& apos; s a large l-shaped enclosed front porch and the house sits on the hill on main Street between the library and Powell School. This was a
Key facts
- Flexible floor plan
- Private parking
- Display cabinetry
Tags
Neighborhood map
What this means for you Summary
Snapshot
- This is a 4-bed/2.0-bath single-family listed at $175k.
Deal economics
- At list price, monthly cash flow is $46 ($555/yr) — positive.
- The deal already cash-flows at list — no discount required.
- To meet the 1% rule (rent ≥ 1% of price), the offer needs to be $148k (15.5% below list).
- Recommended offer: $148k (15.5% below list) — sets the bar for 1% rule.
Location & tenants
- Location reads 78/100 on livability (#159 in OH, #2,395 nationally) — a middle-class / working-renter tenant base. Strengths: cost of living A+, housing A+, health & safety A+; Watch: amenities F, commute F.
- North Baltimore Local (town): math 45% / reading 58% proficiency, ranked #424 of 656 in OH (top 65%) — acceptable for families but not a draw, mixed tenant base, ~2y average lease.
- Zoned schools: E A Powell Elementary School (math 47% / reading 57%, grade C-, #851 of 1,584 statewide, top 56%, 367 students, 46% FRL); North Baltimore Middle School (math 52% / reading 57%, grade B-, #342 of 654 statewide, top 54%, 95 students, 0% FRL); North Baltimore High School (math 34% / reading 74%, grade C-, #303 of 781 statewide, top 42%, 136 students, 84% FRL) — zoned schools at 43% FRL track the district average.
- Market conditions: 33 active listings in the ZIP; 493 units permitted in Wood County in 2024 (48 in 5+ unit buildings).
Forward outlook
- Local home prices are declining (-3.0%/yr); year-one equity from $1k of loan paydown is wiped out by about $5k of value loss. Plan a longer hold.
- Wood County population projected at +14% by 2050 — modest demand growth; plan on rents tracking national, not racing it.
Negotiation context
- Only 1 days on market — expect competitive offers; lowballing is unlikely to land.
- 7 sale attempts since 13y ago; this cycle's ask is 6% above the opening price — seller raised mid-cycle; expect resistance to lowballs.
- Current owner paid $58k; list at $175k implies a 202% gain — meaningful room to come down on a strong offer.
Risks & watch-outs
- Watch-outs: built in 1900 — expect roof / HVAC / electrical / plumbing capex.
Questions for the listing agent
- Built in 1900 — when were the roof, HVAC, electrical panel, plumbing, and water heater last replaced?
- Is there a deadline driving the sale (1031 exchange, divorce, estate, relocation)? That informs how much negotiation room exists.
- Schools are B-rated — typically a magnet for longer-tenancy family renters. What's the average tenant stay here, and is there a school-zone premium baked into asking?
- What's the average days-on-market for RENTAL listings here right now (not sales)? A rising rental-DOM trend means longer vacancies and softer asking-rent achievability than the comps imply.
- What's the recent tenant-quality profile in this submarket — average credit score on applications, eviction rate, late-payment / NSF rate, and stable-employment percentage? A property-management company in the area should have these aggregated.
- How much new for-sale + rental construction is in the pipeline within 1–3 miles? Heavy new supply typically softens prices + rents 12–24 months out; constrained supply supports both.
Investment metrics
- 1% rule
- 0.85% ✗
- Cap rate
- 6.61%
- Cash-on-cash
- 1.13%
- DSCR
- 1.05
- GRM
- 9.9
CMA / ARV
- ARV (on-the-fly)
- $215,424
- Comps found
- 9
Show comp detail 9 sales within ~0.75 mi
| Address | Dist | Beds/Ba | Sqft | Sold | Price | $/sf | Match |
|---|---|---|---|---|---|---|---|
| 305 N Main St | 0.08mi | 4/1.5 | 2,202 (+1%) | 4mo | $240,500 | $109 | 89 |
| 403 W Broadway St | 0.30mi | 4/2.0 | 2,154 (-1%) | 11mo | $128,000 | $59 | 75 |
| 227 E Broadway St | 0.29mi | 3/2.0 (-1) | 2,208 (+2%) | 6mo | $222,000 | $101 | 74 |
| 315 E Walnut St | 0.22mi | 4/3.0 | 2,304 (+6%) | 22mo | $132,000 | $57 | 57 |
| 313 S Main St | 0.60mi | 3/2.0 (-1) | 2,064 (-5%) | 4mo | $205,000 | $99 | 56 |
| 401 N 3rd St | 0.17mi | 3/1.0 (-1) | 1,852 (-15%) | 13mo | $208,088 | $112 | 47 |
| 318 S Main St | 0.61mi | 5/2.0 (+1) | 2,018 (-7%) | 8mo | $154,900 | $77 | 47 |
| 317 W Water St | 0.50mi | 3/2.0 (-1) | 2,014 (-7%) | 16mo | $180,000 | $89 | 46 |
| 300 Rudolph Rd | 0.51mi | 3/3.5 (-1) | 1,934 (-11%) | 23mo | $301,000 | $156 | 27 |
Match score weights: distance 35% · size 25% · config 20% · recency 20%. Top-matched comps best support the ARV.
Projected returns pro-forma
-3.0% appreciation · 3.0% rent growth · sell at horizon
- IRR
- -14.5%
- Equity multiple
- 0.48×
- Total profit
- $-25,445
- Equity at exit
- $26,093
- IRR
- -5.8%
- Equity multiple
- 0.62×
- Total profit
- $-18,493
- Equity at exit
- $15,131
Cash invested: $49,000 (down + closing). Projections, not guarantees.
Landlord ↔ Tenant lean methodology
- Overall (STATE)
- 73 Landlord-Friendly
- State Ohio
- 73 Landlord-Friendly · R+6
- County
- — inherits STATE
- City
- — inherits STATE
ZIP-level market 45872
- Home prices YoY
- -11.5%
- Active inventory
- 33
- Price-to-rent
- 9.9×
Monthly cashflow live
- Estimated rent
- $1,479 medium interval (Pro) →
- Mortgage (P&I)
- −$918
- Tax from tax record
- −$132 /mo · $1,580/yr
- Insurance
- −$73
- HOA
- −$0
- Vacancy / Maint / Mgmt
- −$311
- Net cashflow
- $46
Break-even live
Sensitivity live
| Price | -10% $145 | -5% $96 | +0% $46 | +5% $-3 | +10% $-53 |
|---|---|---|---|---|---|
| Rent | -10% $-71 | -5% $-12 | +0% $46 | +5% $105 | +10% $163 |
| Rate | -1.0pp $134 | -0.5pp $91 | base $46 | +0.5pp $1 | +1.0pp $-45 |
UW: 25.0% down · 7.5% · 30yr · 1.5% tax · 5.0% vac · 8.0% maint · 8.0% mgmt
Financing live
Cash to close
- Down payment
- $43,750
- Closing costs
- $5,250
- Reserves months
- —
- Total cash needed
- —
Loan-product check · same deal, 3 products live
Conventional
25% down · 7.5% · 30yr
- Down + closing
- —
- Monthly P&I
- —
- Monthly cashflow
- —
- DSCR
- —
- Eligible?
- —
Personal DTI + credit; lowest rate.
DSCR
20% down · 8.5% · 30yr
- Down + closing
- —
- Monthly P&I
- —
- Monthly cashflow
- —
- DSCR
- —
- Eligible?
- —
No personal income docs; deal must DSCR.
Hard money
10% down · 12.0% · 12mo
- Down + closing
- —
- Monthly P&I
- —
- Monthly cashflow
- —
- DSCR
- —
- Eligible?
- —
Short-term bridge; refi at stabilization.
Listing history 22 events
-
2024-11-10historical
-
2024-10-31price $163,400
-
2024-10-04price $163,900
-
2024-09-13$164,900 Active
-
2024-09-11historical
-
2024-05-20historical
-
2024-04-22price $171,900
-
2024-04-11price $174,900
-
2024-03-14$174,999 Active
-
2023-08-21price $163,900
-
2023-08-21status Active
-
2023-08-16historical
-
2023-08-16historical
-
2023-03-23$164,900 Active
-
2023-02-24historical
-
2023-01-26$164,900 Active
-
2022-08-16historical
-
2022-06-26price $144,000
-
2022-03-10$145,000 Active
-
2013-11-04soldstatus $58,000
-
2013-10-31historical
-
2013-10-08$62,000
ⓘ Source: listings_history table (triggers on properties + properties_extension) + one-shot
backfill from property_details.listing_events for pre-trigger history.
Tax reassessment forecast OH · Partial reset (capped growth)
- Current annual tax
- $1,580 · $132/mo
- Projected year-2 tax
- $2,155 · $180/mo
- Expected delta
- +$575/yr (+$48/mo · 36.4%)
ⓘ Screening estimate from a state-policy table — verify with the county assessor before closing.
Climate risk First Street
- Flood 1/10 Low FEMA zone X (unshaded) · 0% chance over 30 yrs
- Wildfire 1/10 Low
- Heat 3/10 Moderate 7 d/yr ≥99°F today · 17 d/yr by 30 yrs out
- Wind 2/10 Low
- Air quality 2/10 Low 1 unhealthy d/yr today · 2 by 30 yrs out
Nearby sold comps map
Loading sold comps map…
Walkable amenities ~0.75 mi
Loading nearby amenities…
Taxation est. · year 1
- Rental income
- $17,750
- − Mortgage interest
- −$9,803
- − Property taxes
- −$1,580
- − Insurance
- −$875
- − Repairs & maintenance
- −$1,420
- − Management
- −$1,420
- − Depreciation
- −$5,091
- Taxable loss
- −$2,439
- Est. tax savings @ 24.0%
- +$585
- After-tax cash flow
- $1,140/yr
For passive investors: Depreciation is non-cash, so a rental often shows a tax loss while cash-flowing — sheltering income. Rental losses are passive: they offset passive income freely, and up to $25,000/yr can offset ordinary (W-2) income if you actively participate and your MAGI is under $100k (phasing out to $0 by $150k); unused losses carry forward. On sale, claimed depreciation is recaptured at up to 25%, and gains may owe capital-gains tax (a 1031 exchange can defer both). Figures are a year-1 estimate at your 24.0% rate — not tax advice; consult a CPA.
Schools (NCES district)
- District
- North Baltimore Local
- NCES district ID
- 3905070
- Math proficiency
- 45% ▼ -21.00%
- Reading proficiency
- 58% ▼ -12.00%
- Median HH income
- $47,242
- Composite
- 43.72/100
- National rank
- #2951
- State rank
- #424 of 656 in OH
Livability — North Baltimore
- Score
- 78/100
- State rank
- #159
- US rank
- #2395
Category grades
Schools grade is shown separately in the Schools card above.
Census & demographics
- Census place
- North Baltimore, OH
- County
- Wood · 127,168 people
- City population
- 4,572
- Metro
- Toledo, OH
- Population (ZIP)
- 4,572
- Household income
- $62,380
- Rent vs Own
- Severe rent burden
- 3.8
Population outlook (Wood County) Hauer SSP2
- Today (2025)
- 138,744 people
- By 2030
- 143,189 · +3.2%
- By 2040
- 150,896 · +8.8%
- By 2050
- 158,589 · +14.3%
- By 2075
- 182,166 · +31.3%
- By 2100
- 196,533 · +41.7%
Race, ethnicity, and origin ACS 2023
- Neighborhood character
- Predominantly White (94%)
- Race & ethnicity
- White 94% Hispanic / Latino 4% Two or more races 2% Black 2%
- Common ancestry
- Iranian 4% Romanian 2% Slovak 1%
- Foreign-born
- 0%
- Languages at home
- 98% English-only · Spanish 2%
Political lean MEDSL · Wood
- 2024 margin
- R (+10.2) · D 44.4% · R 54.6%
- 2008→2024 swing
- -17.3pp toward R · 2008: 7.1pp · 2024: -10.2pp
- All cycles
- 2024: R+10.2 2020: R+7.6 2016: R+8.5 2012: D+4.2 2008: D+7.1
Not yet ingested
- Civics
- —
Market trends
- HPI YoY
- ▼ -29.19%
- Current HPI
- 225.1072
- Rent YoY
- —
- Metro
- —
- State GDP YoY
- ▲ 1.98%
- F500 in state
- 48
Industry mix (Fortune 500 HQ in OH)
| Industry | F500 HQs | Revenue |
|---|---|---|
| Insurance | 3 | $145B |
|
||
| Industrial Machinery | 3 | $49B |
|
||
| Financial Services | 3 | $24B |
|
||
| Consumer Goods | 2 | $93B |
|
||
| Aerospace / Defense | 2 | $47B |
|
||
| Utilities | 2 | $33B |
|
||
Price history
+163.5% since first listed22 events — show timeline
- 2024-11-10 Listing Removed — NORIS
- 2024-10-31 Price Changed $163,400 NORIS
- 2024-10-04 Price Changed $163,900 NORIS
- 2024-09-13 Listed $164,900 NORIS
- 2024-09-11 Coming Soon — NORIS
- 2024-05-20 Listing Removed — CBRMLS
- 2024-04-22 Price Changed $171,900 CBRMLS
- 2024-04-11 Price Changed $174,900 CBRMLS
- 2024-03-14 Listed $174,999 CBRMLS
- 2023-08-21 Price Changed $163,900 NORIS
- 2023-08-21 Relisted — NORIS
- 2023-08-16 Listing Removed — NORIS
- 2023-08-16 Listing Removed — NORIS
- 2023-03-23 Listed $164,900 NORIS
- 2023-02-24 Listing Removed — NORIS
- 2023-01-26 Listed $164,900 NORIS
- 2022-08-16 Listing Removed — NORIS
- 2022-06-26 Price Changed $144,000 NORIS
- 2022-03-10 Listed $145,000 NORIS
- 2013-11-04 Sold (Public Records) $58,000 Public Records
- 2013-10-31 Listing Removed — NORIS
- 2013-10-08 Listed $62,000 NORIS
Property tax history
+0.2%/yrLatest (2025): $1,580 · +1.0% YoY. Source: county tax records.
Cash-flow waterfall
monthlySold comps — $/sqft
last 12 mo · ≤1 miLoading sold comps…