39 Hawley St · Plainfield, MA
Flood risk 1/10 · Minimal
- FEMA flood zone
- X
- Chance of flooding over 30 yrs
- 0.0%
- Est. flood insurance / yr
- $507 – $1,088
Fire risk 3/10 · Minor
- Est. fire insurance / yr
- $915 – $1,699
Heat risk 1/10 · Minimal
- Hot days now (above 87°F)
- 7 days/yr
- Hot days in 30 yrs
- 15 days/yr
Wind risk 4/10 · Minor
- Chance of severe wind over 30 yrs
- 9.0%
Air-quality risk 2/10 · Minimal
- Unhealthy air days now
- 1 days/yr
- Unhealthy air days in 30 yrs
- 1 days/yr
Risk factors via First Street. Map © Google.
Why this score? — see what drove the B grade
The composite is a weighted blend of 9 inputs, each scored 0–100. Each bar is that input's sub-score; the figure is the points it added to the 100-point composite (weight × sub-score).
- Cash flow +22.3/30.0
- ARV discount +15.0/15.0
- Appreciation +9.7/10.0
- DSCR +7.1/10.0
- 1% rule +6.3/10.0
- Schools +3.1/10.0
- Rent growth +2.5/5.0
- Livability +2.5/5.0
- Condition / age +2.5/5.0
$99,900
🖨 Deal sheet 📄 Offer letter ✓ Due diligence
Listing remarks MLS
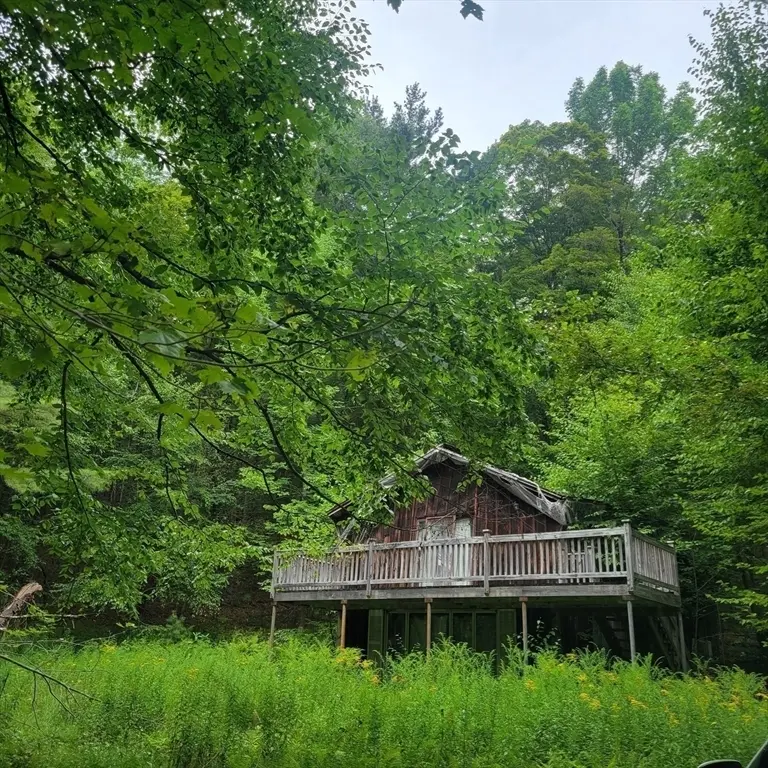
7 acres. Quiet street. Solitude, woods and mature trees wrap this one-owner home that has been vacant for years. No heat, no utilities running. Buyers and brokers enter strictly at that their own risk-- substantive mold throughout and collapsed roof is apparent. Septic and well are present -- both are Buyer's responsibility. This property is a demolition -- and also a great opportunity for and best suited for investor Buyers. Roof in places is partially collapsed. Detached garage looks stable and solid. Home looks to be on a cement pad (rather than a basement). Walking and hiking trails nearby. Just a couple minutes' drive from the center of town.
Key facts
- 7 acre lot
- 6 parking spots
- Built 1960
Neighborhood map
What this means for you Summary
Snapshot
- This is a 2-bed/1.5-bath single-family listed at $100k.
Deal economics
- At list price, monthly cash flow is $165 ($2k/yr) — positive.
- The deal already cash-flows at list — no discount required.
- Meets the 1% rule at list price ($1k rent vs $100k).
- Recommended offer: $88k (12.0% below list) — sets the bar for market timing.
Location & tenants
- Location reads: area grade B — affects rentability + tenant quality, not the cash-flow math above.
- Mohawk Trail (rural): math 25% / reading 45% proficiency, ranked #235 of 302 in MA (top 78%) — families likely to look elsewhere, expect single-tenant / working-renter base with shorter leases.
- Market conditions: 6 active listings in the ZIP; 349 units permitted in Hampshire County in 2024 (185 in 5+ unit buildings).
Forward outlook
- In year one you build about $10k of equity ($691 loan paydown + $9k appreciation (9.4% local appreciation)).
- Hampshire County population projected at +5% by 2050 — modest demand growth; plan on rents tracking national, not racing it.
- At projected returns (9.4% appreciation + 3.0% rent growth), your $28k cash investment doubles in ~3 years — after that, you're playing with house money.
- By year 4, paydown + projected appreciation supports a ~$36k cash-out refi (75% LTV) — recoverable capital for the next deal without selling this one.
Negotiation context
- It's been on market 121 days — a 12% lower offer ($88k) is reasonable based on typical stale-listing flexibility.
Questions for the listing agent
- It's been on market 121 days. Have you received any prior offers? Is the seller open to a 12% concession, seller financing, or rate buy-down credit?
- Built in 1960 — when were the roof, HVAC, electrical panel, plumbing, and water heater last replaced?
- Why hasn't it sold? Are there any deal-killer items the seller is aware of (foundation, flood, title, zoning, code violations)?
- Is there a deadline driving the sale (1031 exchange, divorce, estate, relocation)? That informs how much negotiation room exists.
- What's the average days-on-market for RENTAL listings here right now (not sales)? A rising rental-DOM trend means longer vacancies and softer asking-rent achievability than the comps imply.
- What's the recent tenant-quality profile in this submarket — average credit score on applications, eviction rate, late-payment / NSF rate, and stable-employment percentage? A property-management company in the area should have these aggregated.
- How much new for-sale + rental construction is in the pipeline within 1–3 miles? Heavy new supply typically softens prices + rents 12–24 months out; constrained supply supports both.
Investment metrics
- 1% rule
- 1.13% ✓
- Cap rate
- 8.27%
- Cash-on-cash
- 7.07%
- DSCR
- 1.31
- GRM
- 7.3
CMA / ARV
- ARV (median comp)
- $149,603
- List price
- $99,900
- Delta
- -33.22%
- Verdict
- UNDERPRICED
- Comps
- 2 within 2.0 mi
Projected returns pro-forma
9.41% appreciation · 3.0% rent growth · sell at horizon
- IRR
- 28.3%
- Equity multiple
- 3.18×
- Total profit
- $60,963
- Equity at exit
- $85,758
- IRR
- 24.8%
- Equity multiple
- 7.09×
- Total profit
- $170,422
- Equity at exit
- $180,606
Cash invested: $27,972 (down + closing). Projections, not guarantees.
Landlord ↔ Tenant lean methodology
- Overall (STATE)
- 20 Strongly Tenant-Friendly
- State Massachusetts
- 20 Strongly Tenant-Friendly · D+15
- County
- — inherits STATE
- City
- — inherits STATE
ZIP-level market 01070
- Home prices YoY
- 3.9%
- Active inventory
- 6
- Price-to-rent
- 7.3×
Monthly cashflow live
- Estimated rent
- $1,133 medium interval (Pro) →
- Mortgage (P&I)
- −$524
- Tax from tax record
- −$165 /mo · $1,981/yr
- Insurance
- −$42
- HOA
- −$0
- Vacancy / Maint / Mgmt
- −$238
- Net cashflow
- $165
Break-even live
UW: 25.0% down · 7.5% · 30yr · 1.5% tax · 5.0% vac · 8.0% maint · 8.0% mgmt
Financing live
Cash to close
- Down payment
- $24,975
- Closing costs
- $2,997
- Reserves months
- —
- Total cash needed
- —
Loan-product check · same deal, 3 products live
Conventional
25% down · 7.5% · 30yr
- Down + closing
- —
- Monthly P&I
- —
- Monthly cashflow
- —
- DSCR
- —
- Eligible?
- —
Personal DTI + credit; lowest rate.
DSCR
20% down · 8.5% · 30yr
- Down + closing
- —
- Monthly P&I
- —
- Monthly cashflow
- —
- DSCR
- —
- Eligible?
- —
No personal income docs; deal must DSCR.
Hard money
10% down · 12.0% · 12mo
- Down + closing
- —
- Monthly P&I
- —
- Monthly cashflow
- —
- DSCR
- —
- Eligible?
- —
Short-term bridge; refi at stabilization.
Listing history 16 events
-
2026-06-18days on market $99,900 Active 121 DOM
-
2026-06-17days on market $99,900 Active 120 DOM
-
2026-06-16days on market $99,900 Active 119 DOM
-
2026-06-15days on market $99,900 Active 118 DOM
-
2026-06-14days on market $99,900 Active 116 DOM
-
2026-06-10days on market $99,900 Active 113 DOM
-
2026-06-09days on market $99,900 Active 112 DOM
-
2026-06-08days on market $99,900 Active 111 DOM
-
2026-06-07days on market $99,900 Active 110 DOM
-
2026-06-03days on market $99,900 Active 106 DOM
-
2026-06-02days on market $99,900 Active 105 DOM
-
2026-06-01days on market $99,900 Active 104 DOM
-
2026-05-31days on market $99,900 Active 103 DOM
-
2026-05-30days on market $99,900 Active 102 DOM
-
2026-04-23price $99,900 671-char remark
Show marketing remark (671 chars)
7 acres. Quiet street. Solitude, woods and mature trees wrap this one-owner home that has been vacant for years. No heat, no utilities running. Buyers and brokers enter strictly at that their own risk-- substantive mold throughout and collapsed roof is apparent. Septic and well are present -- both are Buyer's responsibility. This property is a demolition -- and also a great opportunity for and best suited for investor Buyers. Roof in places is partially collapsed. Detached garage looks stable and solid. Home looks to be on a cement pad (rather than a basement). Walking and hiking trails nearby. Just a couple minutes' drive from the center of town.
-
2026-02-17$125,000 New 671-char remark
Show marketing remark (671 chars)
7 acres. Quiet street. Solitude, woods and mature trees wrap this one-owner home that has been vacant for years. No heat, no utilities running. Buyers and brokers enter strictly at that their own risk-- substantive mold throughout and collapsed roof is apparent. Septic and well are present -- both are Buyer's responsibility. This property is a demolition -- and also a great opportunity for and best suited for investor Buyers. Roof in places is partially collapsed. Detached garage looks stable and solid. Home looks to be on a cement pad (rather than a basement). Walking and hiking trails nearby. Just a couple minutes' drive from the center of town.
ⓘ Source: listings_history table (triggers on properties + properties_extension) + one-shot
backfill from property_details.listing_events for pre-trigger history.
Tax reassessment forecast MA · Partial reset (capped growth)
- Current annual tax
- $1,981 · $165/mo
- Projected year-2 tax
- $1,981 · $165/mo
- Expected delta
- $0/yr ($0/mo · 0.0%)
ⓘ Screening estimate from a state-policy table — verify with the county assessor before closing.
Climate risk First Street
- Flood 1/10 Low FEMA zone X · 0% chance over 30 yrs
- Wildfire 3/10 Moderate
- Heat 1/10 Low 7 d/yr ≥87°F today · 15 d/yr by 30 yrs out
- Wind 4/10 Moderate 9% chance of damaging wind over 30 yrs
- Air quality 2/10 Low 1 unhealthy d/yr today · 1 by 30 yrs out
Nearby sold comps map
Loading sold comps map…
Walkable amenities ~0.75 mi
Loading nearby amenities…
Taxation est. · year 1
- Rental income
- $13,602
- − Mortgage interest
- −$5,596
- − Property taxes
- −$1,981
- − Insurance
- −$500
- − Repairs & maintenance
- −$1,088
- − Management
- −$1,088
- − Depreciation
- −$2,906
- Taxable income
- $443
- Est. tax owed @ 24.0%
- −$106
- After-tax cash flow
- $1,872/yr
For passive investors: Depreciation is non-cash, so a rental often shows a tax loss while cash-flowing — sheltering income. Rental losses are passive: they offset passive income freely, and up to $25,000/yr can offset ordinary (W-2) income if you actively participate and your MAGI is under $100k (phasing out to $0 by $150k); unused losses carry forward. On sale, claimed depreciation is recaptured at up to 25%, and gains may owe capital-gains tax (a 1031 exchange can defer both). Figures are a year-1 estimate at your 24.0% rate — not tax advice; consult a CPA.
Schools (NCES district)
- District
- Mohawk Trail
- NCES district ID
- 2507990
- Math proficiency
- 25% ▼ -15.00%
- Reading proficiency
- 45% ▼ -7.00%
- Median HH income
- $56,668
- Composite
- 30.91/100
- National rank
- #6114
- State rank
- #235 of 302 in MA
Livability — Plainfield
No livability data for this city. (Only ~50 U.S. cities are tracked.)
Census & demographics
- Population (ZIP)
- 593
Population outlook (Hampshire County) Hauer SSP2
- Today (2025)
- 166,577 people
- By 2030
- 168,928 · +1.4%
- By 2040
- 171,197 · +2.8%
- By 2050
- 175,542 · +5.4%
- By 2075
- 199,884 · +20.0%
- By 2100
- 211,819 · +27.2%
Race, ethnicity, and origin ACS 2023
- Neighborhood character
- Predominantly White (88%)
- Race & ethnicity
- White 88% Two or more races 10% Hispanic / Latino 2% Native American 1%
- Common ancestry
- Romanian 14% Lithuanian 12% Slovak 4%
- Foreign-born
- 4% · Canada
- Languages at home
- 92% English-only · Other Indo-European 5% French/Haitian/Cajun 1%
Political lean MEDSL · Hampshire
- 2024 margin
- Solid D (+41.9) · D 69.5% · R 27.6% · Other 2.9%
- 2008→2024 swing
- -3.6pp toward R · 2008: 45.6pp · 2024: 41.9pp
- All cycles
- 2024: D+41.9 2020: D+46.8 2016: D+39.5 2012: D+43.8 2008: D+45.6
Not yet ingested
- Civics
- —
Market trends
- HPI YoY
- ▲ 9.41%
- Current HPI
- 254.1715
- Rent YoY
- —
- Metro
- —
- State GDP YoY
- ▲ 2.28%
- F500 in state
- 38
Industry mix (Fortune 500 HQ in MA)
| Industry | F500 HQs | Revenue |
|---|---|---|
| Technology | 3 | $17B |
|
||
| Insurance | 2 | $84B |
|
||
| Retail | 2 | $76B |
|
||
| Life Sciences | 1 | $43B |
|
||
| Energy Technology | 1 | $31B |
|
||
| Aerospace / Defense | 1 | $18B |
|
||
Price history
-20.1% since first listed2 events — show timeline
- 2026-04-23 Price Changed $99,900 MLS PIN
- 2026-02-17 Listed $125,000 MLS PIN
Property tax history
+0.2%/yrLatest (2023): $1,981 · +3.9% YoY. Source: county tax records.
Cash-flow waterfall
monthlySold comps — $/sqft
last 12 mo · ≤1 miLoading sold comps…