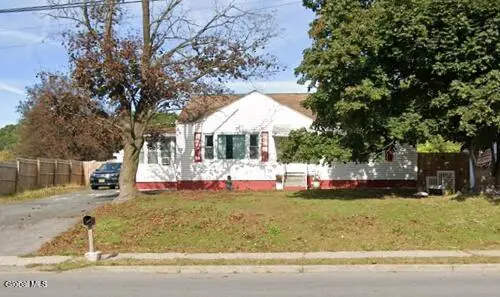
825 Troy-schenectady Rd · Latham, NY
Flood risk 1/10 · Minimal
- FEMA flood zone
- X (unshaded)
- Chance of flooding over 30 yrs
- 0.0%
- Est. flood insurance / yr
- $473 – $860
Fire risk 1/10 · Minimal
- Est. fire insurance / yr
- $691 – $1,283
Heat risk 4/10 · Minor
- Hot days now (above 97°F)
- 7 days/yr
- Hot days in 30 yrs
- 17 days/yr
Wind risk 3/10 · Minor
- Chance of severe wind over 30 yrs
- 6.0%
Air-quality risk 1/10 · Minimal
- Unhealthy air days now
- 0 days/yr
- Unhealthy air days in 30 yrs
- 0 days/yr
Risk factors via First Street. Map © Google.
Why this score? — see what drove the C grade
The composite is a weighted blend of 9 inputs, each scored 0–100. Each bar is that input's sub-score; the figure is the points it added to the 100-point composite (weight × sub-score).
- Cash flow +18.6/30.0
- ARV discount +15.0/15.0
- Schools +6.4/10.0
- DSCR +5.8/10.0
- 1% rule +4.7/10.0
- Rent growth +2.5/5.0
- Livability +2.5/5.0
- Condition / age +2.5/5.0
- Appreciation +0.0/10.0
$250,000
🖨 Deal sheet (PDF) 📄 Offer letter ✓ Due diligence
Listing remarks
Multiple offers received. Highest and best offers to be presented by 5/27 at 3:00 PM. Opportunity knocks at 825 Troy Schenectady Road in Latham! This 3-bedroom, 2-bath single-family home offers solid bones and tremendous upside for the savvy occupant or investor willing to add their personal touch. Cosmetic updates throughout would allow you to quickly build equity in the sought-after N Colonie School district. The full basement features a convenient walkout staircase, offering great potential for additional living space, storage, or a workshop. 2nd bath is in the basement. Don't miss this chance to create something special or get a variance and start over with commercial use in mind on a s
Key facts
- Storage
- Full basement
- Walkout staircase
Tags
Property features AI
Finance
- Other: Above-ground pool
Exterior
- Parking: Detached garage; One garage space; Four total parking spaces; Off-street paved parking
- Security: Smoke detectors; Carbon monoxide detectors
- Utilities: Public water; Public sewer; Cable available
- Home design: Single-family residence; Property listed as fixer
- Construction: Vinyl siding; Block foundation
- Exterior features: Asphalt roof; Wood fenced backyard; Leveled and cleared lot with some slope; Road frontage
Interior
- Kitchen: Gas oven; Range; Refrigerator
- Bedrooms: Three bedrooms on the first floor
- Flooring: Tile; Wood; Carpet
- Bathrooms: Two full bathrooms (one on the first floor, one in the basement)
- Heating & cooling: Baseboard hot water heating (natural gas); Window air conditioning unit(s)
- Interior features: Ceiling paddle fan; Ceramic tile in bathrooms; Double-pane windows; 9 total rooms; Finished full basement with bath stubbed
- Laundry & utility: Washer and dryer included; Laundry area on the first floor; Basement has plumbing stubbed for an additional bath/utility
Neighborhood map
What this means for you Summary
Snapshot
- This is a 3-bed/2.0-bath single-family listed at $250k.
Deal economics
- At list price, monthly cash flow is $242 ($3k/yr) — positive.
- The deal already cash-flows at list — no discount required.
- To meet the 1% rule (rent ≥ 1% of price), the offer needs to be $243k (2.9% below list).
- Recommended offer: $243k (2.9% below list) — sets the bar for 1% rule.
- Cap rate 7.5% vs local median 2.4% in Latham — top-decile yield for the area; either an underpriced asset or a hidden risk that comps aren't pricing in. Stress-test before assuming the spread holds.
Location & tenants
- Location reads: area grade C — affects rentability + tenant quality, not the cash-flow math above.
- North Colonie CSD (suburban): math 70% / reading 76% proficiency, ranked #102 of 590 in NY (top 17%) — strong family-tenant draw, lease renewals of 3-5y typical; only 13% free/reduced lunch — higher-income household profile.
- Zoned schools: Shaker High School (math 98% / reading 93%, grade A+, #76 of 1,100 statewide, top 7%, 2,018 students, 25% FRL).
- Zoned-school proficiency averages 96% at this address vs 73% district-wide (+22 pts) — the actual schools serving this property are materially stronger than the North Colonie CSD average implies; a family-tenant draw the district grade alone would hide.
- Market conditions: 103 active listings in the ZIP; 9 comparable units currently listed for rent nearby; rentals at typical pace (median 15d on market — plan ~3-4 weeks tenant-placement turnaround); solid renter incomes; 675 units permitted in Albany County in 2024 (451 in 5+ unit buildings).
Forward outlook
- Local home prices are declining (-3.0%/yr); year-one equity from $2k of loan paydown is wiped out by about $8k of value loss. Plan a longer hold.
- Albany County population projected at +9% by 2050 — modest demand growth; plan on rents tracking national, not racing it.
Negotiation context
- It's been on market 15 days — a 2% lower offer ($246k) is reasonable based on typical stale-listing flexibility.
- 6 sale attempts since 25y ago with the ask held roughly flat each time — persistent listings suggest the price (not the market) is what's stuck; bring a comps-based counter.
- Current owner paid $150k; list at $250k implies a 67% gain — meaningful room to come down on a strong offer.
Risks & watch-outs
- Watch-outs: built in 1946 — expect roof / HVAC / electrical / plumbing capex.
Questions for the listing agent
- Built in 1946 — when were the roof, HVAC, electrical panel, plumbing, and water heater last replaced?
- Is there a deadline driving the sale (1031 exchange, divorce, estate, relocation)? That informs how much negotiation room exists.
- What's the average days-on-market for RENTAL listings here right now (not sales)? A rising rental-DOM trend means longer vacancies and softer asking-rent achievability than the comps imply.
- What's the recent tenant-quality profile in this submarket — average credit score on applications, eviction rate, late-payment / NSF rate, and stable-employment percentage? A property-management company in the area should have these aggregated.
- How much new for-sale + rental construction is in the pipeline within 1–3 miles? Heavy new supply typically softens prices + rents 12–24 months out; constrained supply supports both.
Investment metrics
- 1% rule
- 0.97% ✗
- Cap rate
- 7.46%
- Cash-on-cash
- 4.16%
- DSCR
- 1.18
- GRM
- 8.6
CMA / ARV
- ARV (on-the-fly)
- $329,589
- Comps found
- 12
Show comp detail 12 sales within ~0.75 mi
| Address | Dist | Beds/Ba | Sqft | Sold | Price | $/sf | Match |
|---|---|---|---|---|---|---|---|
| 10 Knadler Dr | 0.06mi | 3/1.0 | 1,025 (-3%) | 1mo | $335,000 | $327 | 88 |
| 829 Troy-schenectady Rd | 0.03mi | 3/2.0 | 1,152 (+9%) | 3mo | $222,000 | $193 | 80 |
| 32 Dover Dr | 0.21mi | 3/2.0 | 1,000 (-5%) | 4mo | $312,000 | $312 | 79 |
| 8 Harold Ave | 0.15mi | 2/1.0 (-1) | 1,105 (+5%) | 2mo | $220,000 | $199 | 74 |
| 38 Dover Dr | 0.18mi | 3/2.0 | 1,179 (+12%) | 12mo | $385,000 | $327 | 62 |
| 65 Mill Rd | 0.51mi | 3/1.0 | 1,056 (+0%) | 13mo | $330,000 | $313 | 61 |
| 34 Perry Ave | 0.46mi | 4/2.0 (+1) | 1,060 (+1%) | 13mo | $380,000 | $358 | 61 |
| 7 David Rd | 0.23mi | 2/1.0 (-1) | 1,125 (+7%) | 15mo | $250,000 | $222 | 56 |
| 9 Nelson Ave | 0.40mi | 3/1.0 | 932 (-12%) | 3mo | $310,000 | $333 | 56 |
| 11 Luella Rd | 0.34mi | 3/1.0 | 1,162 (+10%) | 10mo | $210,000 | $181 | 54 |
| 18 Luella Rd | 0.34mi | 3/1.0 | 1,170 (+11%) | 9mo | $240,000 | $205 | 54 |
| 7 Pleasant View Dr | 0.70mi | 3/1.0 | 1,200 (+14%) | 13mo | $420,000 | $350 | 29 |
Match score weights: distance 35% · size 25% · config 20% · recency 20%. Top-matched comps best support the ARV.
Projected returns pro-forma
-3.0% appreciation · 3.0% rent growth · sell at horizon
- IRR
- -9.8%
- Equity multiple
- 0.64×
- Total profit
- $-25,068
- Equity at exit
- $37,276
- IRR
- -0.4%
- Equity multiple
- 0.97×
- Total profit
- $-1,932
- Equity at exit
- $21,615
Cash invested: $70,000 (down + closing). Projections, not guarantees.
Landlord ↔ Tenant lean methodology
- Overall (STATE)
- 15 Strongly Tenant-Friendly
- State New York
- 15 Strongly Tenant-Friendly · D+10
- County
- — inherits STATE
- City
- — inherits STATE
ZIP-level market 12110
- Home prices YoY
- -34.1%
- Active inventory
- 103
- Price-to-rent
- 8.6×
Monthly cashflow live
- Estimated rent
- $2,426 high interval (Pro) →
- Mortgage (P&I)
- −$1,311
- Tax from tax record
- −$259 /mo · $3,111/yr
- Insurance
- −$104
- HOA
- −$0
- Vacancy / Maint / Mgmt
- −$510
- Net cashflow
- $242
Break-even live
Sensitivity live
| Price | -10% $384 | -5% $313 | +0% $242 | +5% $172 | +10% $101 |
|---|---|---|---|---|---|
| Rent | -10% $51 | -5% $147 | +0% $242 | +5% $338 | +10% $434 |
| Rate | -1.0pp $368 | -0.5pp $306 | base $242 | +0.5pp $178 | +1.0pp $112 |
UW: 25.0% down · 7.5% · 30yr · 1.5% tax · 5.0% vac · 8.0% maint · 8.0% mgmt
Financing live
Cash to close
- Down payment
- $62,500
- Closing costs
- $7,500
- Reserves months
- —
- Total cash needed
- —
Loan-product check · same deal, 3 products live
Conventional
25% down · 7.5% · 30yr
- Down + closing
- —
- Monthly P&I
- —
- Monthly cashflow
- —
- DSCR
- —
- Eligible?
- —
Personal DTI + credit; lowest rate.
DSCR
20% down · 8.5% · 30yr
- Down + closing
- —
- Monthly P&I
- —
- Monthly cashflow
- —
- DSCR
- —
- Eligible?
- —
No personal income docs; deal must DSCR.
Hard money
10% down · 12.0% · 12mo
- Down + closing
- —
- Monthly P&I
- —
- Monthly cashflow
- —
- DSCR
- —
- Eligible?
- —
Short-term bridge; refi at stabilization.
Rent comps 9 comps
| Address | Beds | Baths | Sqft | Rent | $/sqft | DOM | Units | Dist |
|---|---|---|---|---|---|---|---|---|
| 18 Whitney Rd Latham, NY | 3.0 | 1.5 | 1425 | $2,750 | $1.93 | 44d | 1 | 0.26mi |
| 485 Old Niskayuna Rd Unit A Latham, NY | 2.0 | 1.5 | 1000 | $1,925 | $1.93 | 20d | 1 | 0.52mi |
| 31 Pollock Rd Latham, NY | 1.0–3.0 | 1.0–2.0 | 1069 | $2,447 | $2.29 | 15d | 16 | 0.89mi |
| 13 Residence Inn Dr Latham, NY | 2.0 | 2.0 | 854 | $1,764 | $2.07 | 44d | 1 | 1.16mi |
| 11 Residence Inn Dr Latham, NY | 2.0 | 2.0 | 854 | $1,686 | $1.97 | 15d | 1 | 1.18mi |
| 8 Residence Inn Dr Latham, NY | 2.0 | 2.0 | 854 | $1,686 | $1.97 | 15d | 1 | 1.21mi |
| 2 Residence Inn Dr Latham, NY | 2.0 | 2.0 | 854 | $1,686 | $1.97 | 15d | 1 | 1.22mi |
| 1 Broom Shop Ln Latham, NY | 1.0–2.0 | 1.0–2.0 | 1124 | $2,347 | $2.09 | 20d | 9 | 1.35mi |
| 173 Doorstone Dr Latham, NY | 1.0–3.0 | 1.0–2.0 | 978 | $2,946 | $3.01 | 15d | 8 | 1.37mi |
Listing history 25 events
-
2026-06-02days on market $250,000 Active 15 DOM
-
2026-06-01days on market $250,000 Active 14 DOM
-
2026-05-31days on market $250,000 Active 13 DOM
-
2026-05-31days on market $250,000 Active 12 DOM
-
2026-05-18$250,000 Active
-
2024-12-17historical
-
2024-12-10price $335,000
-
2024-11-22price $340,000
-
2024-11-06price $345,000
-
2024-10-29price $350,000
-
2024-10-25price $360,000
-
2024-10-10price $365,000
-
2024-09-26price $370,000
-
2024-09-25$370,002 Active
-
2011-10-10historical
-
2010-12-31$155,000
-
2010-04-12historical
-
2010-02-15$169,000
-
2008-03-20soldstatus $150,000
-
2008-02-15historical
-
2007-08-13$150,000
-
2001-08-09soldstatus $69,000
-
2001-07-31soldstatus $69,000
-
2001-06-19historical
-
2001-06-07$72,000
ⓘ Source: listings_history table (triggers on properties + properties_extension) + one-shot
backfill from property_details.listing_events for pre-trigger history.
Tax reassessment forecast NY · Partial reset (capped growth)
- Current annual tax
- $3,111 · $259/mo
- Projected year-2 tax
- $3,668 · $306/mo
- Expected delta
- +$557/yr (+$46/mo · 17.9%)
ⓘ Screening estimate from a state-policy table — verify with the county assessor before closing.
Climate risk First Street
- Flood 1/10 Low FEMA zone X (unshaded) · 0% chance over 30 yrs
- Wildfire 1/10 Low
- Heat 4/10 Moderate 7 d/yr ≥97°F today · 17 d/yr by 30 yrs out
- Wind 3/10 Moderate 6% chance of damaging wind over 30 yrs
- Air quality 1/10 Low 0 unhealthy d/yr today · 0 by 30 yrs out
Nearby sold comps map
Loading sold comps map…
Walkable amenities ~0.75 mi
Loading nearby amenities…
Taxation est. · year 1
- Rental income
- $29,117
- − Mortgage interest
- −$14,004
- − Property taxes
- −$3,111
- − Insurance
- −$1,250
- − Repairs & maintenance
- −$2,329
- − Management
- −$2,329
- − Depreciation
- −$7,273
- Taxable loss
- −$1,179
- Est. tax savings @ 24.0%
- +$283
- After-tax cash flow
- $3,192/yr
For passive investors: Depreciation is non-cash, so a rental often shows a tax loss while cash-flowing — sheltering income. Rental losses are passive: they offset passive income freely, and up to $25,000/yr can offset ordinary (W-2) income if you actively participate and your MAGI is under $100k (phasing out to $0 by $150k); unused losses carry forward. On sale, claimed depreciation is recaptured at up to 25%, and gains may owe capital-gains tax (a 1031 exchange can defer both). Figures are a year-1 estimate at your 24.0% rate — not tax advice; consult a CPA.
Schools (NCES district)
- District
- North Colonie CSD
- NCES district ID
- 3621000
- Math proficiency
- 70% ▼ -5.00%
- Reading proficiency
- 76% ▲ 8.00%
- Median HH income
- $74,762
- Composite
- 64.2/100
- National rank
- #565
- State rank
- #102 of 590 in NY
Livability — Latham
No livability data for this city. (Only ~50 U.S. cities are tracked.)
Census & demographics
- County
- Albany County · 196,626 people
- City population
- 20,081
- Metro
- Albany-Schenectady-Troy, NY
- Population (ZIP)
- 20,081
- Household income
- $105,024
- Rent vs Own
- Severe rent burden
- 517.0
Population outlook (Albany County) Hauer SSP2
- Today (2025)
- 320,794 people
- By 2030
- 327,401 · +2.1%
- By 2040
- 338,218 · +5.4%
- By 2050
- 348,467 · +8.6%
- By 2075
- 381,693 · +19.0%
- By 2100
- 393,809 · +22.8%
Race, ethnicity, and origin ACS 2023
- Neighborhood character
- Predominantly White (75%)
- Race & ethnicity
- White 75% Asian 11% Two or more races 6% Black 5% Hispanic / Latino 3%
- Common ancestry
- Romanian 5% Lithuanian 4% Iranian 2%
- Foreign-born
- 12% · Canada, China, Vietnam
- Languages at home
- 84% English-only · Other Indo-European 5% Chinese 2% Other Asian/Pacific 2%
Political lean MEDSL · Albany
- 2024 margin
- Strong D (+25.8) · D 62.9% · R 37.1%
- 2008→2024 swing
- -3.6pp toward R · 2008: 29.4pp · 2024: 25.8pp
- All cycles
- 2024: D+25.8 2020: D+31.4 2016: D+24.3 2012: D+31.0 2008: D+29.4
Not yet ingested
- Civics
- —
Market trends
- HPI YoY
- ▼ -160.69%
- Current HPI
- 310.884
- Rent YoY
- —
- Metro
- Albany-Schenectady-Troy, NY
- State GDP YoY
- ▲ 2.60%
- F500 in state
- 92
Industry mix (Fortune 500 HQ in NY)
| Industry | F500 HQs | Revenue |
|---|---|---|
| Financial Services | 10 | $950B |
|
||
| Consumer Goods | 9 | $162B |
|
||
| Insurance | 4 | $225B |
|
||
| Telecommunications | 2 | $144B |
|
||
| Pharmaceuticals | 2 | $112B |
|
||
| Media / Entertainment | 2 | $69B |
|
||
Price history
+247.2% since first listed21 events — show timeline
- 2026-05-18 Listed $250,000 Global MLS
- 2024-12-17 Listing Removed — Global MLS
- 2024-12-10 Price Changed $335,000 Global MLS
- 2024-11-22 Price Changed $340,000 Global MLS
- 2024-11-06 Price Changed $345,000 Global MLS
- 2024-10-29 Price Changed $350,000 Global MLS
- 2024-10-25 Price Changed $360,000 Global MLS
- 2024-10-10 Price Changed $365,000 Global MLS
- 2024-09-26 Price Changed $370,000 Global MLS
- 2024-09-25 Listed $370,002 Global MLS
- 2011-10-10 Listing Removed — Global MLS
- 2010-12-31 Listed $155,000 Global MLS
- 2010-04-12 Listing Removed — Global MLS
- 2010-02-15 Listed $169,000 Global MLS
- 2008-03-20 Sold (MLS) $150,000 Global MLS
- 2008-02-15 Listing Removed — Global MLS
- 2007-08-13 Listed $150,000 Global MLS
- 2001-08-09 Sold (Public Records) $69,000 Public Records
- 2001-07-31 Sold (MLS) $69,000 Global MLS
- 2001-06-19 Listing Removed — Global MLS
- 2001-06-07 Listed $72,000 Global MLS
Property tax history
-3.3%/yrLatest (2025): $3,111 · -5.2% YoY. Source: county tax records.
Cash-flow waterfall
monthlySold comps — $/sqft
last 12 mo · ≤1 miLoading sold comps…