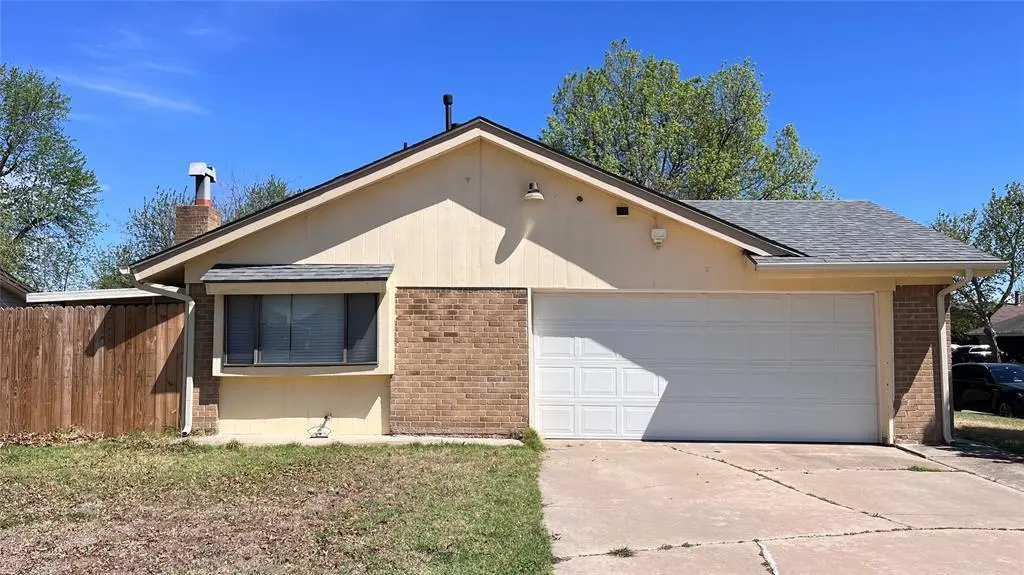
6609 Evergreen Canyon Rd · Oklahoma City, OK
Flood risk 1/10 · Minimal
- FEMA flood zone
- X (unshaded)
- Chance of flooding over 30 yrs
- 0.0%
- Est. flood insurance / yr
- $507 – $1,088
Fire risk 3/10 · Minor
- Est. fire insurance / yr
- $2,463 – $4,575
Heat risk 6/10 · Moderate
- Hot days now (above 107°F)
- 7 days/yr
- Hot days in 30 yrs
- 20 days/yr
Wind risk 2/10 · Minimal
- Chance of severe wind over 30 yrs
- 2.0%
Air-quality risk 2/10 · Minimal
- Unhealthy air days now
- 1 days/yr
- Unhealthy air days in 30 yrs
- 1 days/yr
Risk factors via First Street. Map © Google.
Why this score? — see what drove the C grade
The composite is a weighted blend of 9 inputs, each scored 0–100. Each bar is that input's sub-score; the figure is the points it added to the 100-point composite (weight × sub-score).
- Cash flow +18.8/30.0
- ARV discount +15.0/15.0
- DSCR +5.9/10.0
- 1% rule +4.9/10.0
- Livability +4.0/5.0
- Rent growth +3.9/5.0
- Condition / age +2.5/5.0
- Schools +1.3/10.0
- Appreciation +0.0/10.0
$157,000
🖨 Deal sheet 📄 Offer letter ✓ Due diligence
Listing remarks
Great Opportunity on a corner lot in the popular Putnam City School District. This home sits in a super convenient spot. Close to schools, shopping, restaurants, and turnpike. This 3 bed, 2 bath, 2 car garage home needs some TLC but it has so much potential! Perfect for someone with a vision who loves a project. Whether you want to create a cozy family home or a smart investment property, this is your chance to bring your ideas to life. Recent upgrades include two big ticket item: brand-new roof and water heater from 2024, plus a remodeled primary bathroom.
Key facts
- Recent upgrades
- Water heater
- Brand-new roof
Tags
Property features AI
Finance
- Other: Occupied by owner; Property listed as existing (not new build)
- Financial info: Current list price $167,000; Not assumable
- HOA & community: No mandatory association dues
Exterior
- Parking: 2-car garage
- Home design: Single family residence; One-story; South-facing
- Construction: Brick and frame construction; Shingle roof (replaced/updated in 2024); Slab foundation
- Exterior features: Corner lot
Interior
- Bedrooms: Three bedrooms
- Bathrooms: One full bathroom; One half bathroom
- Interior features: Living area includes one living area; One dining area; Gas log fireplace
Neighborhood map
What this means for you Summary
Snapshot
- This is a 3-bed/2.0-bath single-family listed at $157k.
Deal economics
- At list price, monthly cash flow is $159 ($2k/yr) — positive.
- The deal already cash-flows at list — no discount required.
- To meet the 1% rule (rent ≥ 1% of price), the offer needs to be $155k (1.1% below list).
- Recommended offer: $148k (6.0% below list) — sets the bar for market timing.
- Cap rate 7.5% vs local median 3.7% in Oklahoma City — top-decile yield for the area; either an underpriced asset or a hidden risk that comps aren't pricing in. Stress-test before assuming the spread holds.
Location & tenants
- Location reads 80/100 on livability (#3 in OK, #1,635 nationally) — a professional / high-income tenant draw. Strengths: amenities A+, commute A+, cost of living A+; Watch: crime F.
- Putnam City (urban): math 12% / reading 16% proficiency, ranked #227 of 270 in OK (top 84%) — low school quality limits family demand, transient renter base, plan for 1-2y turnover; 65% free/reduced lunch — lower-income household profile, screen leases tightly.
- Zoned schools: Wiley Post Es (math 9% / reading 8%, grade F, #737 of 845 statewide, top 87%, 634 students, 0% FRL); Putnam City North Hs (math 18% / reading 29%, grade F, #218 of 447 statewide, top 49%, 1,579 students, 0% FRL) — zoned schools average 0% FRL vs 65% district-wide (65 pts lower); this property's tenant base skews higher-income than the district average.
- Market conditions: Rents rising fast (+5.6%/yr); 166 active listings in the ZIP; 40 comparable units currently listed for rent nearby; rentals at typical pace (median 15d on market — plan ~3-4 weeks tenant-placement turnaround); solid renter incomes; 5,365 units permitted in Oklahoma County in 2024 (569 in 5+ unit buildings).
Forward outlook
- Local home prices are declining (-3.0%/yr); year-one equity from $1k of loan paydown is wiped out by about $5k of value loss. Plan a longer hold.
- Oklahoma County population projected at +41% by 2050 — long-run rental-demand tailwind backs the buy-and-hold thesis.
Negotiation context
- It's been on market 68 days — a 6% lower offer ($148k) is reasonable based on typical stale-listing flexibility.
- 4 sale attempts since 23y ago; this cycle's ask has dropped $10k (6%) from the opening price — seller is motivated, your offer sets the floor, not the list.
- Current owner paid $52k; list at $157k implies a 199% gain — meaningful room to come down on a strong offer.
Risks & watch-outs
- Climate carrying-cost: extreme-heat days projected 7→20/yr by 2055 (HVAC capex compounding) — expect insurance premiums to compound above CPI over the hold.
Questions for the listing agent
- It's been on market 68 days. Have you received any prior offers? Is the seller open to a 6% concession, seller financing, or rate buy-down credit?
- Built in 1976 — when were the roof, HVAC, electrical panel, plumbing, and water heater last replaced?
- Why hasn't it sold? Are there any deal-killer items the seller is aware of (foundation, flood, title, zoning, code violations)?
- Is there a deadline driving the sale (1031 exchange, divorce, estate, relocation)? That informs how much negotiation room exists.
- Schools are F-rated, which usually means shorter tenancies and higher turnover. Who's the typical renter profile here, and what's been the actual vacancy rate?
- Crime grade is F in this area — have there been break-ins, vandalism, or insurance claims at this property in the last 3 years? What carrier currently insures it and at what premium?
- What's the average days-on-market for RENTAL listings here right now (not sales)? A rising rental-DOM trend means longer vacancies and softer asking-rent achievability than the comps imply.
- What's the recent tenant-quality profile in this submarket — average credit score on applications, eviction rate, late-payment / NSF rate, and stable-employment percentage? A property-management company in the area should have these aggregated.
- How much new for-sale + rental construction is in the pipeline within 1–3 miles? Heavy new supply typically softens prices + rents 12–24 months out; constrained supply supports both.
Investment metrics
- 1% rule
- 0.99% ✗
- Cap rate
- 7.51%
- Cash-on-cash
- 4.33%
- DSCR
- 1.19
- GRM
- 8.4
CMA / ARV
- ARV (on-the-fly)
- $194,403
- Comps found
- 10
Show comp detail 10 sales within ~0.75 mi
| Address | Dist | Beds/Ba | Sqft | Sold | Price | $/sf | Match |
|---|---|---|---|---|---|---|---|
| 10709 Admiral Dr | 0.28mi | 3/2.0 | 1,419 (0%) | 13mo | $212,500 | $150 | 76 |
| 6624 Laurel Dr | 0.24mi | 3/2.0 | 1,488 (+5%) | 8mo | $165,000 | $111 | 74 |
| 6636 Laurel Rd | 0.19mi | 3/2.0 | 1,572 (+11%) | 8mo | $220,000 | $140 | 67 |
| 6608 Fawn Canyon Dr | 0.09mi | 3/2.0 | 1,595 (+12%) | 11mo | $215,000 | $135 | 66 |
| 10500 Blue Spruce Rd | 0.09mi | 3/2.0 | 1,575 (+11%) | 22mo | $215,000 | $137 | 59 |
| 6637 Laurel Rd | 0.22mi | 3/2.0 | 1,582 (+12%) | 15mo | $206,000 | $130 | 58 |
| 6628 Fawn Canyon Dr | 0.11mi | 3/2.0 | 1,589 (+12%) | 20mo | $210,000 | $132 | 58 |
| 9908 Harbor Dr | 0.32mi | 2/2.0 (-1) | 1,227 (-14%) | 10mo | $255,000 | $208 | 49 |
| 6605 Laurel Dr | 0.26mi | 3/2.0 | 1,605 (+13%) | 21mo | $210,000 | $131 | 48 |
| 10309 Bacardy Pl | 0.59mi | 3/2.0 | 1,616 (+14%) | 13mo | $245,100 | $152 | 38 |
Match score weights: distance 35% · size 25% · config 20% · recency 20%. Top-matched comps best support the ARV.
Projected returns pro-forma
-3.0% appreciation · 5.59% rent growth · sell at horizon
- IRR
- -6.7%
- Equity multiple
- 0.75×
- Total profit
- $-11,168
- Equity at exit
- $23,409
- IRR
- 5.8%
- Equity multiple
- 1.48×
- Total profit
- $21,310
- Equity at exit
- $13,574
Cash invested: $43,960 (down + closing). Projections, not guarantees.
Landlord ↔ Tenant lean methodology
- Overall (STATE)
- 83 Strongly Landlord-Friendly
- State Oklahoma
- 83 Strongly Landlord-Friendly · R+20
- County
- — inherits STATE
- City
- — inherits STATE
ZIP-level market 73162
- Rents YoY
- 5.6%
- Active inventory
- 166
- Price-to-rent
- 8.4×
Monthly cashflow live
- Estimated rent
- $1,553 high interval (Pro) →
- Mortgage (P&I)
- −$823
- Tax from tax record
- −$179 /mo · $2,153/yr
- Insurance
- −$65
- HOA
- −$0
- Vacancy / Maint / Mgmt
- −$326
- Net cashflow
- $159
Break-even live
UW: 25.0% down · 7.5% · 30yr · 1.5% tax · 5.0% vac · 8.0% maint · 8.0% mgmt
Financing live
Cash to close
- Down payment
- $39,250
- Closing costs
- $4,710
- Reserves months
- —
- Total cash needed
- —
Loan-product check · same deal, 3 products live
Conventional
25% down · 7.5% · 30yr
- Down + closing
- —
- Monthly P&I
- —
- Monthly cashflow
- —
- DSCR
- —
- Eligible?
- —
Personal DTI + credit; lowest rate.
DSCR
20% down · 8.5% · 30yr
- Down + closing
- —
- Monthly P&I
- —
- Monthly cashflow
- —
- DSCR
- —
- Eligible?
- —
No personal income docs; deal must DSCR.
Hard money
10% down · 12.0% · 12mo
- Down + closing
- —
- Monthly P&I
- —
- Monthly cashflow
- —
- DSCR
- —
- Eligible?
- —
Short-term bridge; refi at stabilization.
Rent comps 40 comps
| Address | Beds | Baths | Sqft | Rent | $/sqft | DOM | Units | Dist |
|---|---|---|---|---|---|---|---|---|
| 6804 Elk Canyon Rd Oklahoma City, OK | 3.0 | 2.0 | 1725 | $1,400 | $0.81 | 4d | 1 | 0.21mi |
| 6913 Fawn Canyon Dr Oklahoma City, OK | 3.0 | 2.0 | 1572 | $1,699 | $1.08 | 21d | 1 | 0.26mi |
| 10411 White Oak Canyon Rd Oklahoma City, OK | 2.0 | 2.0 | 1158 | $1,225 | $1.06 | 4d | 1 | 0.40mi |
| 7028 Elk Canyon Rd Oklahoma City, OK | 3.0 | 2.0 | 1404 | $1,495 | $1.06 | 17d | 1 | 0.40mi |
| 5924 W Hefner Rd Oklahoma City, OK | 2.0 | 1.0 | 1200 | $1,200 | $1.00 | 2d | 1 | 0.63mi |
| 5920 W Hefner Rd Oklahoma City, OK | 2.0 | 1.0 | 1000 | $1,425 | $1.43 | 23d | 1 | 0.63mi |
| 5757 W Hefner Rd Oklahoma City, OK | 2.0 | 1.0–2.0 | 825 | $1,425 | $1.73 | 3d | 20 | 0.79mi |
| 7000 W Britton Rd Oklahoma City, OK | 2.0 | 2.0 | 951 | $1,210 | $1.27 | 14d | 1 | 0.80mi |
| 7000 W Britton Rd Oklahoma City, OK | 2.0 | 2.0 | 951 | $1,210 | $1.27 | 23d | 1 | 0.80mi |
| 7000 W Britton Rd Oklahoma City, OK | 2.0 | 2.0 | 951 | $1,210 | $1.27 | 2d | 1 | 0.80mi |
| 9301 N MacArthur Blvd Oklahoma City, OK | 1.0–2.0 | 1.0–2.0 | 800 | $1,050 | $1.31 | 2d | 9 | 0.82mi |
| 9605 Hefner Village Blvd Oklahoma City, OK | 3.0 | 2.5 | 1474 | $1,600 | $1.09 | 3d | 1 | 0.85mi |
| 9020 N Rockwell Dr Oklahoma City, OK | 2.0 | 2.5 | 1244 | $1,250 | $1.00 | 11d | 1 | 0.96mi |
| 9023 N Rockwell Dr Oklahoma City, OK | 3.0 | 2.0 | 1400 | $1,500 | $1.07 | 20d | 1 | 0.96mi |
| 9021 N Rockwell Dr Unit 9023 Oklahoma City, OK | 3.0 | 2.0 | 1400 | $1,500 | $1.07 | 21d | 1 | 0.96mi |
| 9006 N Rockwell Dr Oklahoma City, OK | 2.0 | 2.5 | 1635 | $1,295 | $0.79 | 2d | 1 | 1.00mi |
| 7136 NW 115th St Unit 7138 Oklahoma City, OK | 3.0 | 2.0 | 1489 | $1,325 | $0.89 | 23d | 1 | 1.01mi |
| 9200 N MacArthur Blvd Oklahoma City, OK | 1.0–3.0 | 1.0–2.0 | 975 | $1,399 | $1.43 | 1d | 2 | 1.02mi |
| 9003 N Rockwell Dr Oklahoma City, OK | 2.0 | 2.0 | 1431 | $1,250 | $0.87 | 23d | 1 | 1.02mi |
| 7137 NW 116th St Unit 7137 Oklahoma City, OK | 3.0 | 2.0 | 1465 | $1,350 | $0.92 | 23d | 1 | 1.08mi |
| 5816 NW 90th St Oklahoma City, OK | 4.0 | 2.0 | 1760 | $1,795 | $1.02 | 10d | 1 | 1.12mi |
| 8522 Candlewood Dr Oklahoma City, OK | 3.0 | 2.0 | 1527 | $1,495 | $0.98 | 3d | 1 | 1.16mi |
| 8510 Candlewood Dr Oklahoma City, OK | 3.0 | 2.5 | 1527 | $1,395 | $0.91 | 23d | 1 | 1.19mi |
| 8508 Candlewood Dr Oklahoma City, OK | 3.0 | 2.5 | 1527 | $1,395 | $0.91 | 2d | 1 | 1.20mi |
| 8501 Candlewood Dr Oklahoma City, OK | 3.0 | 2.0 | 1325 | $1,275 | $0.96 | 20d | 1 | 1.28mi |
| 8501 Candlewood Dr Oklahoma City, OK | 3.0 | 2.0 | 1325 | $1,275 | $0.96 | 11d | 1 | 1.28mi |
| 8501 Candlewood Dr Oklahoma City, OK | 2.0 | 2.0 | 1025 | $1,115 | $1.09 | 16d | 1 | 1.28mi |
| 5825 NW 86th St Oklahoma City, OK | 3.0 | 2.0 | 1846 | $2,500 | $1.35 | 23d | 1 | 1.28mi |
| 10800 N Council Rd Oklahoma City, OK | 2.0 | 2.0 | 900 | $899 | $1.00 | 14d | 1 | 1.38mi |
| 10400 N Council Rd Unit 315 Oklahoma City, OK | 2.0 | 2.0 | 962 | $1,000 | $1.04 | 23d | 1 | 1.40mi |
| 10400 N Council Rd Apt 323 Oklahoma City, OK | 2.0 | 2.0 | 962 | $1,000 | $1.04 | 20d | 1 | 1.40mi |
| 10400 N Council Rd Unit 321 Oklahoma City, OK | 2.0 | 2.0 | 885 | $949 | $1.07 | 23d | 1 | 1.40mi |
| 7501 NW 115th St Oklahoma City, OK | 3.0 | 2.0 | 1387 | $1,560 | $1.12 | 2d | 1 | 1.41mi |
| 6801 NW 122nd St Oklahoma City, OK | 1.0–3.0 | 1.0–2.0 | 952 | $1,350 | $1.42 | 1d | 7 | 1.43mi |
| 12405 Bannockburn Pl Oklahoma City, OK | 3.0 | 2.0 | 1642 | $1,450 | $0.88 | 23d | 1 | 1.45mi |
| 10526 Utica Dr Oklahoma City, OK | 3.0 | 2.0 | 1200 | $1,545 | $1.29 | 23d | 1 | 1.45mi |
| 8002 NW 105th Ter Unit A Oklahoma City, OK | 3.0 | 2.0 | 1200 | $1,495 | $1.25 | 14d | 1 | 1.47mi |
| 6001 Glencove Pl Oklahoma City, OK | 3.0 | 2.0 | 1727 | $4,500 | $2.61 | 2d | 1 | 1.49mi |
| 8027 NW 104th St Oklahoma City, OK | 2.0 | 2.0 | 1570 | $1,395 | $0.89 | 3d | 1 | 1.49mi |
| 6701 NW 124th Ter Oklahoma City, OK | 4.0 | 2.0 | 1384 | $1,650 | $1.19 | 2d | 1 | 1.49mi |
Listing history 29 events
-
2026-06-18days on market $157,000 Active 68 DOM
-
2026-06-17days on market $157,000 Active 67 DOM
-
2026-06-16days on market $157,000 Active 66 DOM
-
2026-06-15days on market $157,000 Active 65 DOM
-
2026-06-13days on market $157,000 Active 63 DOM
-
2026-06-13days on market $157,000 Active 62 DOM
-
2026-06-09days on market $157,000 Active 59 DOM
-
2026-06-08days on market $157,000 Active 58 DOM
-
2026-06-07days on market $157,000 Active 57 DOM
-
2026-06-03days on market $157,000 Active 53 DOM
-
2026-06-02days on market $157,000 Active 52 DOM
-
2026-06-01days on market $157,000 Active 51 DOM
-
2026-06-01price $157,000 Active 50 DOM
-
2026-05-31days on market $162,000 Active 50 DOM
-
2026-05-05price $162,000
-
2026-04-11$167,000 Active
-
2026-02-10historical
-
2025-11-29price $170,000
-
2025-10-31price $175,000
-
2025-10-12price $182,000
-
2025-09-23price $187,000
-
2025-08-13price $192,000
-
2025-07-24status Active
-
2025-05-17status Pending
-
2025-04-20price $195,000
-
2025-04-15$197,000 Active
-
2003-12-15historical
-
2003-11-01$84,900
-
1978-12-01soldstatus $52,500
ⓘ Source: listings_history table (triggers on properties + properties_extension) + one-shot
backfill from property_details.listing_events for pre-trigger history.
Tax reassessment forecast OK · Resets to sale price
- Current annual tax
- $2,153 · $179/mo
- Projected year-2 tax
- $2,153 · $179/mo
- Expected delta
- $0/yr ($0/mo · 0.0%)
ⓘ Screening estimate from a state-policy table — verify with the county assessor before closing.
Climate risk First Street
- Flood 1/10 Low FEMA zone X (unshaded) · 0% chance over 30 yrs
- Wildfire 3/10 Moderate
- Heat 6/10 Major 7 d/yr ≥107°F today · 20 d/yr by 30 yrs out
- Wind 2/10 Low 2% chance of damaging wind over 30 yrs
- Air quality 2/10 Low 1 unhealthy d/yr today · 1 by 30 yrs out
Nearby sold comps map
Loading sold comps map…
Walkable amenities ~0.75 mi
Loading nearby amenities…
Taxation est. · year 1
- Rental income
- $18,636
- − Mortgage interest
- −$8,794
- − Property taxes
- −$2,153
- − Insurance
- −$785
- − Repairs & maintenance
- −$1,491
- − Management
- −$1,491
- − Depreciation
- −$4,567
- Taxable loss
- −$646
- Est. tax savings @ 24.0%
- +$155
- After-tax cash flow
- $2,059/yr
For passive investors: Depreciation is non-cash, so a rental often shows a tax loss while cash-flowing — sheltering income. Rental losses are passive: they offset passive income freely, and up to $25,000/yr can offset ordinary (W-2) income if you actively participate and your MAGI is under $100k (phasing out to $0 by $150k); unused losses carry forward. On sale, claimed depreciation is recaptured at up to 25%, and gains may owe capital-gains tax (a 1031 exchange can defer both). Figures are a year-1 estimate at your 24.0% rate — not tax advice; consult a CPA.
Schools (NCES district)
- District
- Putnam City
- NCES district ID
- 4025290
- Math proficiency
- 12% ▼ -18.00%
- Reading proficiency
- 16% ▼ -14.00%
- Median HH income
- $46,657
- Composite
- 12.61/100
- National rank
- #9614
- State rank
- #227 of 270 in OK
Livability — Oklahoma City
- Score
- 80/100
- State rank
- #3
- US rank
- #1635
Category grades
Schools grade is shown separately in the Schools card above.
Census & demographics
- Census place
- Oklahoma City, OK
- County
- Oklahoma County · 771,644 people
- City population
- 498,656
- Metro
- Oklahoma City, OK
- Population (ZIP)
- 28,728
- Household income
- $88,031
- Rent vs Own
- Severe rent burden
- 913.0
Population outlook (Oklahoma County) Hauer SSP2
- Today (2025)
- 911,875 people
- By 2030
- 982,413 · +7.7%
- By 2040
- 1,130,468 · +24.0%
- By 2050
- 1,288,422 · +41.3%
- By 2075
- 1,711,482 · +87.7%
- By 2100
- 2,088,448 · +129.0%
Race, ethnicity, and origin ACS 2023
- Neighborhood character
- Diverse neighborhood (Simpson 0.59)
- Race & ethnicity
- White 62% Black 14% Two or more races 11% Hispanic / Latino 8% Asian 6% Native American 2%
- Hispanic origin (detail)
- Mexican 5%
- Common ancestry
- Slovak 4% Italian 2% Serbian 1%
- Foreign-born
- 8% · Vietnam, Canada, China
- Languages at home
- 90% English-only · Spanish 4% Vietnamese 2% Other Asian/Pacific 1%
Political lean MEDSL · Oklahoma
- 2024 margin
- Toss-up / Even · D 48.0% · R 49.7% · Other 2.3%
- 2008→2024 swing
- +15.1pp toward D · 2008: -16.8pp · 2024: -1.7pp
- All cycles
- 2024: R+1.7 2020: R+1.1 2016: R+10.5 2012: R+16.7 2008: R+16.8
Not yet ingested
- Civics
- —
Market trends
- HPI YoY
- ▼ -172.35%
- Current HPI
- 205.6639
- Rent YoY
- ▲ 5.59%
- Metro
- Oklahoma City, OK
- State GDP YoY
- ▲ 1.55%
- F500 in state
- 6
Industry mix (Fortune 500 HQ in OK)
| Industry | F500 HQs | Revenue |
|---|---|---|
| Energy | 3 | $48B |
|
||
Price history
+208.6% since first listed15 events — show timeline
- 2026-05-05 Price Changed $162,000 MLSOK
- 2026-04-11 Listed $167,000 MLSOK
- 2026-02-10 Listing Removed — MLSOK
- 2025-11-29 Price Changed $170,000 MLSOK
- 2025-10-31 Price Changed $175,000 MLSOK
- 2025-10-12 Price Changed $182,000 MLSOK
- 2025-09-23 Price Changed $187,000 MLSOK
- 2025-08-13 Price Changed $192,000 MLSOK
- 2025-07-24 Relisted — MLSOK
- 2025-05-17 Pending — MLSOK
- 2025-04-20 Price Changed $195,000 MLSOK
- 2025-04-15 Listed $197,000 MLSOK
- 2003-12-15 Listing Removed — MLSOK
- 2003-11-01 Listed $84,900 MLSOK
- 1978-12-01 Sold (Public Records) $52,500 Public Records
Property tax history
+4.5%/yrLatest (2025): $2,153 · +5.8% YoY. Source: county tax records.
Cash-flow waterfall
monthlySold comps — $/sqft
last 12 mo · ≤1 miLoading sold comps…