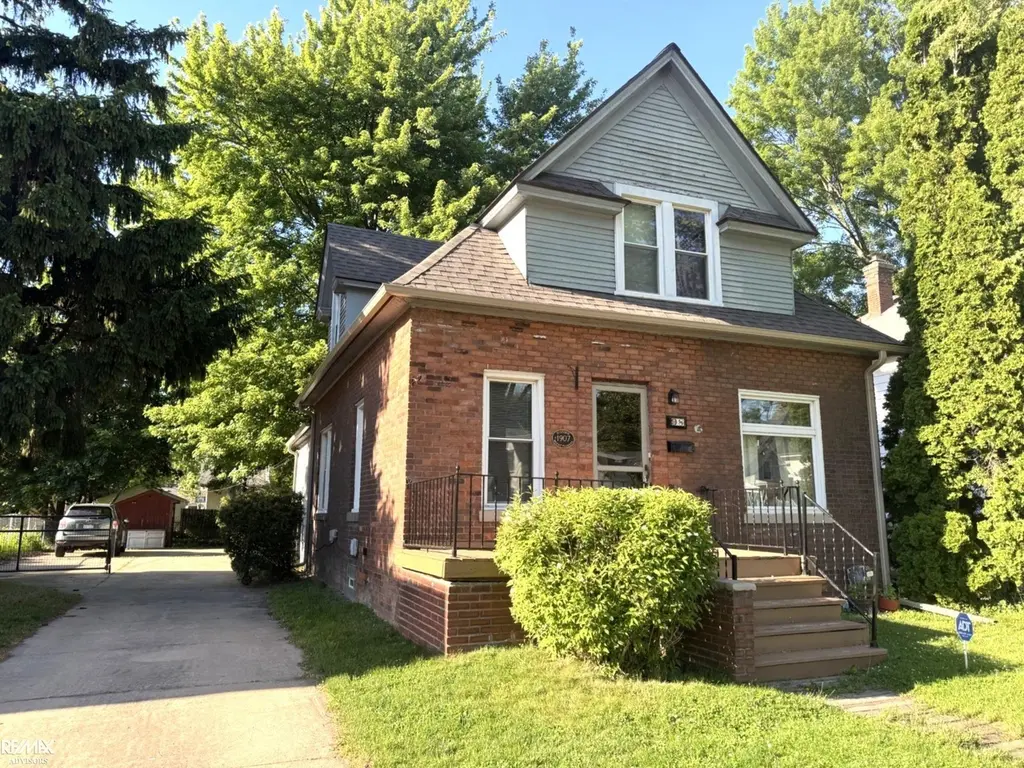
98 Gallup St · Mount Clemens, MI
Flood risk 1/10 · Minimal
- FEMA flood zone
- X (unshaded)
- Chance of flooding over 30 yrs
- 0.0%
- Est. flood insurance / yr
- $473 – $860
Fire risk 1/10 · Minimal
- Est. fire insurance / yr
- $784 – $1,456
Heat risk 3/10 · Minor
- Hot days now (above 96°F)
- 7 days/yr
- Hot days in 30 yrs
- 15 days/yr
Wind risk 1/10 · Minimal
- Chance of severe wind over 30 yrs
- —
Air-quality risk 4/10 · Minor
- Unhealthy air days now
- 4 days/yr
- Unhealthy air days in 30 yrs
- 6 days/yr
Risk factors via First Street. Map © Google.
Why this score? — see what drove the D grade
The composite is a weighted blend of 9 inputs, each scored 0–100. Each bar is that input's sub-score; the figure is the points it added to the 100-point composite (weight × sub-score).
- Cash flow +12.9/30.0
- ARV discount +10.9/15.0
- Rent growth +5.0/5.0
- 1% rule +4.7/10.0
- DSCR +3.9/10.0
- Livability +3.9/5.0
- Condition / age +2.5/5.0
- Schools +0.6/10.0
- Appreciation +0.0/10.0
$185,000
🖨 Deal sheet (PDF) 📄 Offer letter ✓ Due diligence
Listing remarks MLS
Historic home full of timeless charm and character! Featuring oak hardwood flooring throughout the main level, beautiful wood staircase, and original elm/oak doors throughout. Kitchen with cozy breakfast nook. Main floor bedroom and full bath offer flexible living options. Upstairs features gorgeous pine flooring, three additional bedrooms, and a full bath with classic clawfoot tub. Additional highlights include ADT security , newer roof (approx. 1 year), and newer hot water tank (approx. . 1-2 years). A rare opportunity to own a character-filled home with historic detail and modern updates!
Key facts
- Newer roof
- Wood staircase
- Full bath
Tags
Property features AI
Finance
- HOA & community: Homeowners association present
Exterior
- Utilities: Public water; Public sewer
- Home design: Single-family residence; One and one-half stories
- Construction: Brick and vinyl siding exterior
- Exterior features: Patio; Shed(s); Private maintained road access; Private road frontage; Lot dimensions approximately 60 x 140; Zoned residential
Interior
- Bathrooms: 2 full bathrooms
- Heating & cooling: Forced air heating (natural gas); No cooling
- Interior features: Partial finished basement; 8 total rooms
Neighborhood map
What this means for you Summary
Snapshot
- This is a 4-bed/2.0-bath single-family listed at $185k.
Deal economics
- At list price, monthly cash flow is $-12 ($-146/yr) — negative.
- To cash-flow at today's rent, offer at most $183k (1.2% below list).
- To meet the 1% rule (rent ≥ 1% of price), the offer needs to be $179k (3.2% below list).
- Recommended offer: $179k (3.2% below list) — sets the bar for 1% rule.
- Cap rate 6.2% vs local median 3.0% in Mount Clemens — top-decile yield for the area; either an underpriced asset or a hidden risk that comps aren't pricing in. Stress-test before assuming the spread holds.
Location & tenants
- Location reads 77/100 on livability (#120 in MI, #2,918 nationally) — a middle-class / working-renter tenant base. Strengths: commute A+, cost of living A+, housing A+; Watch: crime D+, amenities D+, employment D-.
- Mount Clemens Community School District (suburban): math 4% / reading 11% proficiency, ranked #532 of 540 in MI (top 98%) — low school quality limits family demand, transient renter base, plan for 1-2y turnover; 80% free/reduced lunch — lower-income household profile, screen leases tightly.
- Zoned schools: Seminole Academy (math 2% / reading 8%, grade F, #1,325 of 1,397 statewide, top 99%, 370 students, 94% FRL); Mount Clemens Middle School (math 2% / reading 12%, grade F, #481 of 493 statewide, top 98%, 151 students, 94% FRL); Mount Clemens High School (math 10% / reading 30%, grade F, #596 of 713 statewide, top 86%, 203 students, 90% FRL).
- Market conditions: Rents rising fast (+10.8%/yr); 69 active listings in the ZIP; 3 comparable units currently listed for rent nearby; rentals leasing fast (median 6d on market — plan ~1-2 weeks tenant-placement turnaround); 1,321 units permitted in Macomb County in 2024 (86 in 5+ unit buildings).
- This rent runs 41% of the median local income ($52k/yr) — at the standard rent-burdened threshold; future hikes will face affordability resistance.
Forward outlook
- Local home prices are declining (-3.0%/yr); year-one equity from $1k of loan paydown is wiped out by about $6k of value loss. Plan a longer hold.
- Macomb County population projected at +9% by 2050 — modest demand growth; plan on rents tracking national, not racing it.
Negotiation context
- It's been on market 16 days — a 2% lower offer ($182k) is reasonable based on typical stale-listing flexibility.
- 10 sale attempts since 23y ago with the ask held roughly flat each time — persistent listings suggest the price (not the market) is what's stuck; bring a comps-based counter.
- Current owner paid $129k; 43% above their basis — modest negotiation headroom, anchor on the comps not their cost.
Risks & watch-outs
- Watch-outs: built in 1907 — expect roof / HVAC / electrical / plumbing capex.
Questions for the listing agent
- What do current leases actually rent for vs. the listed asking? Can we see a recent rent roll and the last 12 months of T-12 income?
- Built in 1907 — when were the roof, HVAC, electrical panel, plumbing, and water heater last replaced?
- Is there a deadline driving the sale (1031 exchange, divorce, estate, relocation)? That informs how much negotiation room exists.
- Schools are D-rated, which usually means shorter tenancies and higher turnover. Who's the typical renter profile here, and what's been the actual vacancy rate?
- Crime grade is D in this area — have there been break-ins, vandalism, or insurance claims at this property in the last 3 years? What carrier currently insures it and at what premium?
- The area grade is low — what's the realistic commute time and amenity access for the typical tenant pool here? Any planned neighborhood developments (good or bad) we should know about?
- What's the average days-on-market for RENTAL listings here right now (not sales)? A rising rental-DOM trend means longer vacancies and softer asking-rent achievability than the comps imply.
- What's the recent tenant-quality profile in this submarket — average credit score on applications, eviction rate, late-payment / NSF rate, and stable-employment percentage? A property-management company in the area should have these aggregated.
- How much new for-sale + rental construction is in the pipeline within 1–3 miles? Heavy new supply typically softens prices + rents 12–24 months out; constrained supply supports both.
Investment metrics
- 1% rule
- 0.97% ✗
- Cap rate
- 6.21%
- Cash-on-cash
- -0.28%
- DSCR
- 0.99
- GRM
- 8.6
CMA / ARV
- ARV (on-the-fly)
- $199,958
- Comps found
- 12
Show comp detail 12 sales within ~0.75 mi
| Address | Dist | Beds/Ba | Sqft | Sold | Price | $/sf | Match |
|---|---|---|---|---|---|---|---|
| 111 Scott Blvd | 0.21mi | 4/2.0 | 1,612 (-2%) | 1mo | $265,000 | $164 | 87 |
| 40 Moser Pl | 0.19mi | 4/2.0 | 1,593 (-3%) | 1mo | $200,000 | $126 | 86 |
| 130 Gallup St | 0.11mi | 4/1.5 | 1,728 (+5%) | 5mo | $90,000 | $52 | 80 |
| 53 Englewood St | 0.28mi | 5/2.0 (+1) | 1,656 (+1%) | 7mo | $188,000 | $114 | 74 |
| 90 Scott Blvd | 0.25mi | 5/1.5 (+1) | 1,702 (+4%) | 1mo | $192,000 | $113 | 74 |
| 165 Washington St | 0.34mi | 3/2.0 (-1) | 1,732 (+6%) | 2mo | $212,000 | $122 | 68 |
| 254 Euclid St | 0.24mi | 4/2.0 | 1,456 (-11%) | 3mo | $192,500 | $132 | 68 |
| 33 Ferrin Pl | 0.29mi | 3/1.0 (-1) | 1,525 (-7%) | 2mo | $125,000 | $82 | 64 |
| 183 Washington St | 0.33mi | 3/1.5 (-1) | 1,445 (-12%) | 2mo | $250,000 | $173 | 56 |
| 59 Canfield Dr | 0.54mi | 3/2.0 (-1) | 1,826 (+11%) | 2mo | $245,000 | $134 | 50 |
| 43529 Medea Drive Dr | 0.71mi | 3/2.0 (-1) | 1,728 (+5%) | 6mo | $30,000 | $17 | 48 |
| 220 Cass Ave | 0.66mi | 3/1.0 (-1) | 1,462 (-11%) | 1mo | $165,000 | $113 | 42 |
Match score weights: distance 35% · size 25% · config 20% · recency 20%. Top-matched comps best support the ARV.
Projected returns pro-forma
-3.0% appreciation · 8.0% rent growth · sell at horizon
- IRR
- -10.7%
- Equity multiple
- 0.59×
- Total profit
- $-21,167
- Equity at exit
- $27,584
- IRR
- 5.1%
- Equity multiple
- 1.47×
- Total profit
- $24,140
- Equity at exit
- $15,995
Cash invested: $51,800 (down + closing). Projections, not guarantees.
Landlord ↔ Tenant lean methodology
- Overall (STATE)
- 62 Landlord-Friendly
- State Michigan
- 62 Landlord-Friendly · EVEN
- County
- — inherits STATE
- City
- — inherits STATE
ZIP-level market 48043
- Rents YoY
- 10.8%
- Active inventory
- 69
- Price-to-rent
- 8.6×
Monthly cashflow live
- Estimated rent
- $1,791 medium interval (Pro) →
- Mortgage (P&I)
- −$970
- Tax from tax record
- −$380 /mo · $4,561/yr
- Insurance
- −$77
- HOA
- −$0
- Vacancy / Maint / Mgmt
- −$376
- Net cashflow
- $-12
Break-even live
Sensitivity live
| Price | -10% $93 | -5% $40 | +0% $-12 | +5% $-65 | +10% $-117 |
|---|---|---|---|---|---|
| Rent | -10% $-154 | -5% $-83 | +0% $-12 | +5% $59 | +10% $129 |
| Rate | -1.0pp $81 | -0.5pp $35 | base $-12 | +0.5pp $-60 | +1.0pp $-109 |
UW: 25.0% down · 7.5% · 30yr · 1.5% tax · 5.0% vac · 8.0% maint · 8.0% mgmt
Financing live
Cash to close
- Down payment
- $46,250
- Closing costs
- $5,550
- Reserves months
- —
- Total cash needed
- —
Loan-product check · same deal, 3 products live
Conventional
25% down · 7.5% · 30yr
- Down + closing
- —
- Monthly P&I
- —
- Monthly cashflow
- —
- DSCR
- —
- Eligible?
- —
Personal DTI + credit; lowest rate.
DSCR
20% down · 8.5% · 30yr
- Down + closing
- —
- Monthly P&I
- —
- Monthly cashflow
- —
- DSCR
- —
- Eligible?
- —
No personal income docs; deal must DSCR.
Hard money
10% down · 12.0% · 12mo
- Down + closing
- —
- Monthly P&I
- —
- Monthly cashflow
- —
- DSCR
- —
- Eligible?
- —
Short-term bridge; refi at stabilization.
Rent comps 3 comps
| Address | Beds | Baths | Sqft | Rent | $/sqft | DOM | Units | Dist |
|---|---|---|---|---|---|---|---|---|
| 40 Ferrin Pl Mount Clemens, MI | 3.0 | 1.0 | 1400 | $1,700 | $1.21 | 0d | 1 | 0.27mi |
| 15 Washington St Unit 2 Mt Clemens, MI | 3.0 | 1.0 | 1396 | $1,400 | $1.00 | 45d | 1 | 0.58mi |
| 42510 Pinehurst Dr Clinton Twp, MI | 3.0 | 2.5 | 1845 | $2,600 | $1.41 | 6d | 1 | 1.26mi |
Listing history 11 events
-
2026-06-21days on market $185,000 Active 16 DOM
-
2026-06-18days on market $185,000 Active 13 DOM
-
2026-06-17days on market $185,000 Active 12 DOM
-
2026-06-16days on market $185,000 Active 11 DOM
-
2026-06-15days on market $185,000 Active 10 DOM
-
2026-06-13days on market $185,000 Active 8 DOM
-
2026-06-13days on market $185,000 Active 7 DOM
-
2026-06-09days on market $185,000 Active 4 DOM
-
2026-06-08days on market $185,000 Active 3 DOM
-
2026-06-07remarks 598-char remark
-
2026-06-07$185,000 Active 2 DOM
ⓘ Source: listings_history table (triggers on properties + properties_extension) + one-shot
backfill from property_details.listing_events for pre-trigger history.
Tax reassessment forecast MI · Partial reset (capped growth)
- Current annual tax
- $4,561 · $380/mo
- Projected year-2 tax
- $4,561 · $380/mo
- Expected delta
- $0/yr ($0/mo · 0.0%)
ⓘ Screening estimate from a state-policy table — verify with the county assessor before closing.
Climate risk First Street
- Flood 1/10 Low FEMA zone X (unshaded) · 0% chance over 30 yrs
- Wildfire 1/10 Low
- Heat 3/10 Moderate 7 d/yr ≥96°F today · 15 d/yr by 30 yrs out
- Wind 1/10 Low
- Air quality 4/10 Moderate 4 unhealthy d/yr today · 6 by 30 yrs out
Nearby sold comps map
Loading sold comps map…
Walkable amenities ~0.75 mi
Loading nearby amenities…
Taxation est. · year 1
- Rental income
- $21,496
- − Mortgage interest
- −$10,363
- − Property taxes
- −$4,561
- − Insurance
- −$925
- − Repairs & maintenance
- −$1,720
- − Management
- −$1,720
- − Depreciation
- −$5,382
- Taxable loss
- −$3,174
- Est. tax savings @ 24.0%
- +$762
- After-tax cash flow
- $616/yr
For passive investors: Depreciation is non-cash, so a rental often shows a tax loss while cash-flowing — sheltering income. Rental losses are passive: they offset passive income freely, and up to $25,000/yr can offset ordinary (W-2) income if you actively participate and your MAGI is under $100k (phasing out to $0 by $150k); unused losses carry forward. On sale, claimed depreciation is recaptured at up to 25%, and gains may owe capital-gains tax (a 1031 exchange can defer both). Figures are a year-1 estimate at your 24.0% rate — not tax advice; consult a CPA.
Schools (NCES district)
- District
- Mount Clemens Community School District
- NCES district ID
- 2624690
- Math proficiency
- 4% ▼ -9.00%
- Reading proficiency
- 11% ▼ -7.00%
- Median HH income
- $36,632
- Composite
- 6.25/100
- National rank
- #10005
- State rank
- #532 of 540 in MI
Livability — Mount Clemens
- Score
- 77/100
- State rank
- #120
- US rank
- #2918
Category grades
Schools grade is shown separately in the Schools card above.
Census & demographics
- Census place
- Mount Clemens, MI
- County
- Macomb County · 638,552 people
- City population
- 15,429
- Metro
- Detroit-Warren-Dearborn, MI
- Population (ZIP)
- 15,429
- Household income
- $52,161
- Rent vs Own
- Severe rent burden
- 610.0
Population outlook (Macomb County) Hauer SSP2
- Today (2025)
- 925,296 people
- By 2030
- 948,226 · +2.5%
- By 2040
- 983,961 · +6.3%
- By 2050
- 1,010,200 · +9.2%
- By 2075
- 1,076,222 · +16.3%
- By 2100
- 1,077,065 · +16.4%
Race, ethnicity, and origin ACS 2023
- Neighborhood character
- Majority White (65%)
- Race & ethnicity
- White 65% Black 22% Two or more races 10% Hispanic / Latino 4%
- Common ancestry
- Romanian 10% Lithuanian 4% Slovak 2%
- Foreign-born
- 2% · Canada
- Languages at home
- 96% English-only · Spanish 2% Russian/Polish/Slavic 1%
Political lean MEDSL · Macomb
- 2024 margin
- R (+13.7) · D 42.2% · R 55.9% · Other 1.9%
- 2008→2024 swing
- -22.3pp toward R · 2008: 8.6pp · 2024: -13.7pp
- All cycles
- 2024: R+13.7 2020: R+8.1 2016: R+11.6 2012: D+4.0 2008: D+8.6
Not yet ingested
- Civics
- —
Market trends
- HPI YoY
- ▼ -194.74%
- Current HPI
- 260.7139
- Rent YoY
- ▲ 10.82%
- Metro
- Detroit-Warren-Dearborn, MI
- State GDP YoY
- ▲ 1.37%
- F500 in state
- 28
Industry mix (Fortune 500 HQ in MI)
| Industry | F500 HQs | Revenue |
|---|---|---|
| Automotive Parts | 3 | $48B |
|
||
| Automotive | 2 | $372B |
|
||
| Chemicals | 1 | $45B |
|
||
| Automotive Retail | 1 | $29B |
|
||
| Healthcare / Medical Devices | 1 | $23B |
|
||
| Automotive Technology | 1 | $20B |
|
||
Price history
+15.7% since first listed22 events — show timeline
- 2026-06-05 Listed $185,000 MiRealSource-MiMLS
- 2026-06-05 Listed $185,000 REALCOMP
- 2021-05-05 Sold (Public Records) $129,000 Public Records
- 2021-04-21 Sold (MLS) $129,000 REALCOMP
- 2021-04-21 Sold (MLS) $129,000 MiRealSource-MiMLS
- 2021-03-17 Pending — MiRealSource-MiMLS
- 2021-03-12 Relisted — MiRealSource-MiMLS
- 2021-03-11 Pending — MiRealSource-MiMLS
- 2021-03-01 Listed $129,900 REALCOMP
- 2021-03-01 Listed $129,900 MiRealSource-MiMLS
- 2008-05-13 Listing Removed — REALCOMP
- 2008-05-13 Listing Removed — MiRealSource-MiMLS
- 2007-05-10 Listed $150,000 REALCOMP
- 2007-05-10 Listed $150,000 MiRealSource-MiMLS
- 2004-08-10 Sold (Public Records) $154,640 Public Records
- 2004-07-07 Sold (MLS) $154,640 MiRealSource-MiMLS
- 2004-07-07 Sold (MLS) $150,000 REALCOMP
- 2004-05-12 Listing Removed — MiRealSource-MiMLS
- 2003-12-03 Listed $159,900 REALCOMP
- 2003-12-02 Listed $159,900 MiRealSource-MiMLS
- 2003-11-26 Listing Removed — REALCOMP
- 2003-08-26 Listed $159,900 REALCOMP
Property tax history
+7.1%/yrLatest (2025): $4,561 · +0.6% YoY. Source: county tax records.
Cash-flow waterfall
monthlySold comps — $/sqft
last 12 mo · ≤1 miLoading sold comps…