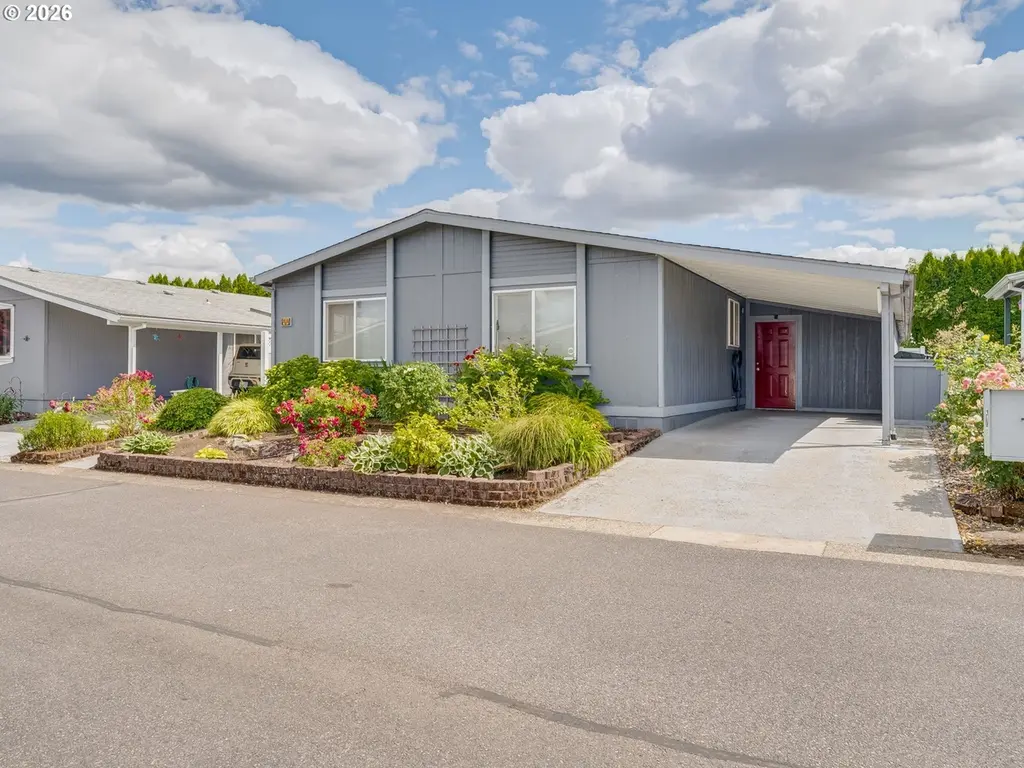
507 NE 99th St #44 · Hazel Dell, WA
Flood risk No data
- FEMA flood zone
- —
- Chance of flooding over 30 yrs
- —
- Est. flood insurance / yr
- —
Fire risk No data
- Est. fire insurance / yr
- —
Heat risk No data
- Hot days now (above threshold)
- —
- Hot days in 30 yrs
- —
Wind risk No data
- Chance of severe wind over 30 yrs
- —
Air-quality risk No data
- Unhealthy air days now
- —
- Unhealthy air days in 30 yrs
- —
Risk factors via First Street. Map © Google.
Why this score? — see what drove the B+ grade
The composite is a weighted blend of 9 inputs, each scored 0–100. Each bar is that input's sub-score; the figure is the points it added to the 100-point composite (weight × sub-score).
- Cash flow +30.0/30.0
- ARV discount +15.0/15.0
- 1% rule +10.0/10.0
- DSCR +10.0/10.0
- Schools +4.3/10.0
- Livability +4.1/5.0
- Rent growth +3.0/5.0
- Condition / age +2.5/5.0
- Appreciation +0.0/10.0
$95,000
🖨 Deal sheet (PDF) 📄 Offer letter ✓ Due diligence
Listing remarks
Welcome to this spacious manufactured home in the desirable, gated 55+ Meadow Verde community! Great layout and a clean slate to make your own. Enjoy the comfort of A/C during the hotter days of summer. Beautiful colorful landscape in the front and decking all around with no grass to mow! All appliances stay and tons of extra storage/work space added behind the carport. Monthly space rent for Unit 44 is $1089. Act soon as this is truly a terrific value!
Key facts
- Gated community
- Decking all around
- Extra storage
Tags
Property features AI
Finance
- Other: Located in a park setting (manufactured home in park); Parcel number available
- Financial info: Lot rent (monthly)
- HOA & community: Community amenities include commons and utilities; Park name: Meadow Verde; Pet approval required by park; Land lease in place (lease expires June 30, 2027) and monthly lot rent applies
Exterior
- Parking: Carport; Driveway
- Security: Gated community (park amenities)
- Utilities: Public water; Public sewer; Electric service
- Home design: Manufactured home in a park; Residential property; Resale; Single-story living; Built in 1989; No significant view
- Construction: Composition roof; Manufacturer: Country Estates; Built in 1989
- Exterior features: Deck; Garden; Workshop; T-111 siding; Paved road access
Interior
- Kitchen: Built-in oven; Cooktop; Dishwasher; Freestanding refrigerator
- Bedrooms: Primary bedroom (main level); Second bedroom (main level)
- Flooring: Laminate flooring; Vinyl flooring
- Bathrooms: 2 full bathrooms (both on main level)
- Heating & cooling: Heat pump for heating and cooling
- Interior features: One-level accessibility; Skylights; Double-pane windows; Electric fireplace
- Laundry & utility: Washer/Dryer included; Electric hot water
Neighborhood map
What this means for you Summary
Snapshot
- This is a 2-bed/2.0-bath manufactured listed at $95k.
Deal economics
- At list price, monthly cash flow is $1k ($15k/yr) — positive.
- The deal already cash-flows at list — no discount required.
- Meets the 1% rule at list price ($2k rent vs $95k).
- Cap rate 22.4% vs local median 3.3% in Hazel Dell — top-decile yield for the area; either an underpriced asset or a hidden risk that comps aren't pricing in. Stress-test before assuming the spread holds.
Location & tenants
- Location reads 82/100 on livability (#67 in WA, #1,216 nationally) — a professional / high-income tenant draw. Strengths: amenities A+, commute A+, housing A+; Watch: crime D+, cost of living D.
- Vancouver School District (suburban): math 43% / reading 53% proficiency, ranked #156 of 291 in WA (top 54%) — families likely to look elsewhere, expect single-tenant / working-renter base with shorter leases.
- Zoned schools: Dwight D Eisenhower Elementary (475 students, 48% FRL); Thomas Jefferson Middle School (743 students, 36% FRL); Columbia River High (1,134 students, 32% FRL).
- Market conditions: Rents rising (+2.0%/yr); 188 active listings in the ZIP; 19 comparable units currently listed for rent nearby; rentals at typical pace (median 17d on market — plan ~3-4 weeks tenant-placement turnaround); solid renter incomes; 3,547 units permitted in Clark County in 2024 (1,361 in 5+ unit buildings).
- This rent runs 32% of the median local income ($89k/yr) — at the standard rent-burdened threshold; future hikes will face affordability resistance.
Forward outlook
- Local home prices are declining (-3.0%/yr); year-one equity from $657 of loan paydown is wiped out by about $3k of value loss. Plan a longer hold.
- Clark County population projected at +29% by 2050 — long-run rental-demand tailwind backs the buy-and-hold thesis.
- At projected returns (-3.0% appreciation + 2.0% rent growth), your $27k cash investment doubles in ~2 years — after that, you're playing with house money.
Negotiation context
- Only 9 days on market — expect competitive offers; lowballing is unlikely to land.
Questions for the listing agent
- Is there a deadline driving the sale (1031 exchange, divorce, estate, relocation)? That informs how much negotiation room exists.
- Schools are F-rated, which usually means shorter tenancies and higher turnover. Who's the typical renter profile here, and what's been the actual vacancy rate?
- Crime grade is D in this area — have there been break-ins, vandalism, or insurance claims at this property in the last 3 years? What carrier currently insures it and at what premium?
- What's the average days-on-market for RENTAL listings here right now (not sales)? A rising rental-DOM trend means longer vacancies and softer asking-rent achievability than the comps imply.
- What's the recent tenant-quality profile in this submarket — average credit score on applications, eviction rate, late-payment / NSF rate, and stable-employment percentage? A property-management company in the area should have these aggregated.
- How much new for-sale + rental construction is in the pipeline within 1–3 miles? Heavy new supply typically softens prices + rents 12–24 months out; constrained supply supports both.
Investment metrics
- 1% rule
- 2.45% ✓
- Cap rate
- 22.36%
- Cash-on-cash
- 57.39%
- DSCR
- 3.55
- GRM
- 3.4
CMA / ARV
- ARV (on-the-fly)
- $139,950
- Comps found
- 12
Show comp detail 12 sales within ~0.75 mi
| Address | Dist | Beds/Ba | Sqft | Sold | Price | $/sf | Match |
|---|---|---|---|---|---|---|---|
| 507 NE 99th St #20 | 0.00mi | 2/2.0 | 1,511 (-3%) | 1mo | $24,000 | $16 | 94 |
| 507 NE 99th St #60 | 0.00mi | 2/2.0 | 1,512 (-3%) | 6mo | $125,000 | $83 | 91 |
| 507 NE 99th St #58 | 0.00mi | 2/2.0 | 1,505 (-3%) | 15mo | $145,000 | $96 | 82 |
| 507 NE 99th St #8 | 0.00mi | 3/2.0 (+1) | 1,640 (+6%) | 7mo | $125,000 | $76 | 80 |
| 507 NE 99th St #71 | 0.00mi | 2/2.0 | 1,502 (-3%) | 18mo | $120,000 | $80 | 79 |
| 507 NE 99th St #15 | 0.00mi | 3/2.0 (+1) | 1,422 (-9%) | 4mo | $117,000 | $82 | 78 |
| 507 NE 99th St #7 | 0.00mi | 3/2.0 (+1) | 1,351 (-13%) | 3mo | $125,000 | $93 | 70 |
| 507 NE 99th St #39 | 0.00mi | 2/2.0 | 1,718 (+10%) | 18mo | $107,500 | $63 | 67 |
| 1805 NE 94th St #37 | 0.73mi | 3/2.0 (+1) | 1,617 (+4%) | 4mo | $162,500 | $100 | 50 |
| 1805 NE 94th St #4 | 0.73mi | 3/2.0 (+1) | 1,610 (+4%) | 9mo | $155,000 | $96 | 47 |
| 1805 NE 94th St #33 | 0.73mi | 3/2.0 (+1) | 1,666 (+7%) | 4mo | $150,000 | $90 | 46 |
| 1805 NE 94th St #5 | 0.73mi | 3/2.0 (+1) | 1,636 (+5%) | 9mo | $155,000 | $95 | 44 |
Match score weights: distance 35% · size 25% · config 20% · recency 20%. Top-matched comps best support the ARV.
Projected returns pro-forma
-3.0% appreciation · 2.0% rent growth · sell at horizon
- IRR
- 54.8%
- Equity multiple
- 3.38×
- Total profit
- $63,293
- Equity at exit
- $14,165
- IRR
- 59.5%
- Equity multiple
- 6.64×
- Total profit
- $150,041
- Equity at exit
- $8,214
Cash invested: $26,600 (down + closing). Projections, not guarantees.
Landlord ↔ Tenant lean methodology
- Overall (STATE)
- 28 Tenant-Leaning
- State Washington
- 28 Tenant-Leaning · D+8
- County
- — inherits STATE
- City
- — inherits STATE
ZIP-level market 98665
- Rents YoY
- 2.0%
- Active inventory
- 188
- Price-to-rent
- 3.4×
Monthly cashflow live
- Estimated rent
- $2,327 high interval (Pro) →
- Mortgage (P&I)
- −$498
- Tax from tax record
- −$28 /mo · $341/yr
- Insurance
- −$40
- HOA
- −$0
- Vacancy / Maint / Mgmt
- −$489
- Net cashflow
- $1,272
Break-even live
Sensitivity live
| Price | -10% $1,326 | -5% $1,299 | +0% $1,272 | +5% $1,245 | +10% $1,218 |
|---|---|---|---|---|---|
| Rent | -10% $1,088 | -5% $1,180 | +0% $1,272 | +5% $1,364 | +10% $1,456 |
| Rate | -1.0pp $1,320 | -0.5pp $1,296 | base $1,272 | +0.5pp $1,248 | +1.0pp $1,223 |
UW: 25.0% down · 7.5% · 30yr · 1.5% tax · 5.0% vac · 8.0% maint · 8.0% mgmt
Financing live
Cash to close
- Down payment
- $23,750
- Closing costs
- $2,850
- Reserves months
- —
- Total cash needed
- —
Loan-product check · same deal, 3 products live
Conventional
25% down · 7.5% · 30yr
- Down + closing
- —
- Monthly P&I
- —
- Monthly cashflow
- —
- DSCR
- —
- Eligible?
- —
Personal DTI + credit; lowest rate.
DSCR
20% down · 8.5% · 30yr
- Down + closing
- —
- Monthly P&I
- —
- Monthly cashflow
- —
- DSCR
- —
- Eligible?
- —
No personal income docs; deal must DSCR.
Hard money
10% down · 12.0% · 12mo
- Down + closing
- —
- Monthly P&I
- —
- Monthly cashflow
- —
- DSCR
- —
- Eligible?
- —
Short-term bridge; refi at stabilization.
Rent comps 19 comps
| Address | Beds | Baths | Sqft | Rent | $/sqft | DOM | Units | Dist |
|---|---|---|---|---|---|---|---|---|
| 345 NE 105th St Vancouver, WA | 3.0 | 1.5 | 1260 | $2,350 | $1.87 | 6d | 1 | 0.33mi |
| 611 NE 85th Cir Vancouver, WA | 3.0 | 3.5 | 2155 | $2,700 | $1.25 | 25d | 1 | 0.57mi |
| 511 NE 84th Cir Vancouver, WA | 3.0 | 3.5 | 2239 | $2,550 | $1.14 | 25d | 1 | 0.59mi |
| 8515 NE 13th Pl Vancouver, WA | 3.0 | 2.5 | 1540 | $2,315 | $1.50 | 0d | 1 | 0.65mi |
| 1532 NE 87th Way Vancouver, WA | 3.0 | 2.5 | 1418 | $2,295 | $1.62 | 25d | 1 | 0.65mi |
| 9703 NE Tenny Creek Dr Vancouver, WA | 3.0 | 2.5 | 1592 | $2,295 | $1.44 | 25d | 1 | 0.71mi |
| 1106 NE 83rd St Vancouver, WA | 1.0–3.0 | 1.0–2.5 | 1058 | $1,932 | $1.83 | 22d | 1 | 0.71mi |
| 1821 NE 88th Cir Vancouver, WA | 3.0 | 3.5 | 2020 | $2,395 | $1.19 | 25d | 1 | 0.74mi |
| 2009 NE 102nd Cir Vancouver, WA | 3.0 | 2.5 | 1530 | $2,595 | $1.70 | 4d | 1 | 0.78mi |
| 2009 NE 102nd Cir Vancouver, WA | 3.0 | 2.5 | 1530 | $2,595 | $1.70 | 0d | 1 | 0.78mi |
| 1437 NE 82nd Dr Vancouver, WA | 3.0 | 2.5 | 1500 | $2,695 | $1.80 | 4d | 1 | 0.86mi |
| 8601 NE 21st Ave Unit D Vancouver, WA | 3.0 | 2.5 | 1155 | $2,200 | $1.90 | 14d | 1 | 0.92mi |
| 8601 NE 21st Ave Unit D Vancouver, WA | 3.0 | 2.5 | 1155 | $2,200 | $1.90 | 16d | 1 | 0.92mi |
| 7503 NW 2nd Ave Vancouver, WA | 3.0 | 2.5 | 1864 | $2,795 | $1.50 | 0d | 1 | 1.10mi |
| 1708 NW 91st Cir Vancouver, WA | 3.0 | 2.0 | 1529 | $2,695 | $1.76 | 25d | 1 | 1.14mi |
| 1800 NW 104th St Vancouver, WA | 3.0 | 2.0 | 1406 | $2,679 | $1.91 | 5d | 1 | 1.19mi |
| 2301 NE 81st St Vancouver, WA | 1.0–3.0 | 1.0–2.0 | 1080 | $1,975 | $1.83 | 3d | 10 | 1.20mi |
| 1307 NE 70th St Vancouver, WA | 3.0 | 2.0 | 1802 | $2,829 | $1.57 | 25d | 1 | 1.36mi |
| 3011 NE 113th St Vancouver, WA | 3.0 | 2.5 | 1658 | $2,895 | $1.75 | 25d | 1 | 1.46mi |
Listing history 8 events
-
2026-06-21days on market $95,000 Active 9 DOM
-
2026-06-18days on market $95,000 Active 6 DOM
-
2026-06-17days on market $95,000 Active 5 DOM
-
2026-06-16days on market $95,000 Active 4 DOM
-
2026-06-16remarks 458-char remark
-
2026-06-15days on market $95,000 Active 3 DOM
-
2026-06-13remarks 357-char remark
-
2026-06-13$95,000 Active 1 DOM
ⓘ Source: listings_history table (triggers on properties + properties_extension) + one-shot
backfill from property_details.listing_events for pre-trigger history.
Tax reassessment forecast WA · Resets to sale price
- Current annual tax
- $341 · $28/mo
- Projected year-2 tax
- $931 · $78/mo
- Expected delta
- +$590/yr (+$49/mo · 173.1%)
ⓘ Screening estimate from a state-policy table — verify with the county assessor before closing.
Nearby sold comps map
Loading sold comps map…
Walkable amenities ~0.75 mi
Loading nearby amenities…
Taxation est. · year 1
- Rental income
- $27,924
- − Mortgage interest
- −$5,321
- − Property taxes
- −$341
- − Insurance
- −$475
- − Repairs & maintenance
- −$2,234
- − Management
- −$2,234
- − Depreciation
- −$2,764
- Taxable income
- $14,555
- Est. tax owed @ 24.0%
- −$3,493
- After-tax cash flow
- $11,773/yr
For passive investors: Depreciation is non-cash, so a rental often shows a tax loss while cash-flowing — sheltering income. Rental losses are passive: they offset passive income freely, and up to $25,000/yr can offset ordinary (W-2) income if you actively participate and your MAGI is under $100k (phasing out to $0 by $150k); unused losses carry forward. On sale, claimed depreciation is recaptured at up to 25%, and gains may owe capital-gains tax (a 1031 exchange can defer both). Figures are a year-1 estimate at your 24.0% rate — not tax advice; consult a CPA.
Schools (NCES district)
- District
- Vancouver School District
- NCES district ID
- 5309270
- Math proficiency
- 43% ▬ 0.00%
- Reading proficiency
- 53% ▬ 0.00%
- Median HH income
- $52,562
- Composite
- 43.45/100
- National rank
- #6479
- State rank
- #156 of 291 in WA
Livability — Hazel Dell
- Score
- 82/100
- State rank
- #67
- US rank
- #1216
Category grades
Schools grade is shown separately in the Schools card above.
Census & demographics
- Census place
- Hazel Dell, WA
- County
- Clark County · 513,189 people
- City population
- 28,243
- Metro
- Portland-Vancouver-Hillsboro, OR-WA
- Population (ZIP)
- 28,910
- Household income
- $88,559
- Rent vs Own
- Severe rent burden
- 1070.0
Population outlook (Clark County) Hauer SSP2
- Today (2025)
- 529,610 people
- By 2030
- 563,242 · +6.4%
- By 2040
- 625,905 · +18.2%
- By 2050
- 681,558 · +28.7%
- By 2075
- 805,967 · +52.2%
- By 2100
- 877,450 · +65.7%
Race, ethnicity, and origin ACS 2023
- Neighborhood character
- Predominantly White (70%)
- Race & ethnicity
- White 70% Hispanic / Latino 14% Two or more races 11% Asian 5% Black 3%
- Hispanic origin (detail)
- Mexican 12%
- Common ancestry
- Portuguese 5% Italian 4% Slovak 3%
- Foreign-born
- 12% · Canada, China
- Languages at home
- 80% English-only · Spanish 9% Russian/Polish/Slavic 3% Other Asian/Pacific 2%
Political lean MEDSL · Clark
- 2024 margin
- Lean D (+7.0) · D 52.1% · R 45.1% · Other 2.8%
- 2008→2024 swing
- +0.9pp no change · 2008: 6.1pp · 2024: 7.0pp
- All cycles
- 2024: D+7.0 2020: D+5.1 2016: D+0.1 2012: D+0.1 2008: D+6.1
Not yet ingested
- Civics
- —
Market trends
- HPI YoY
- ▼ -274.20%
- Current HPI
- 303.1342
- Rent YoY
- ▲ 2.00%
- Metro
- Portland-Vancouver-Hillsboro, OR-WA
- State GDP YoY
- ▲ 4.65%
- F500 in state
- 22
Industry mix (Fortune 500 HQ in WA)
| Industry | F500 HQs | Revenue |
|---|---|---|
| Retail | 2 | $269B |
|
||
| Technology / Retail | 1 | $638B |
|
||
| Technology | 1 | $245B |
|
||
| Telecommunications | 1 | $38B |
|
||
| Food / Beverage | 1 | $36B |
|
||
| Automotive / Trucks | 1 | $34B |
|
||
Price history
1 event — show timeline
- 2026-06-12 Listed $95,000 RMLS
Property tax history
-3.6%/yrLatest (2026): $341 · +23.3% YoY. Source: county tax records.
Cash-flow waterfall
monthlySold comps — $/sqft
last 12 mo · ≤1 miLoading sold comps…