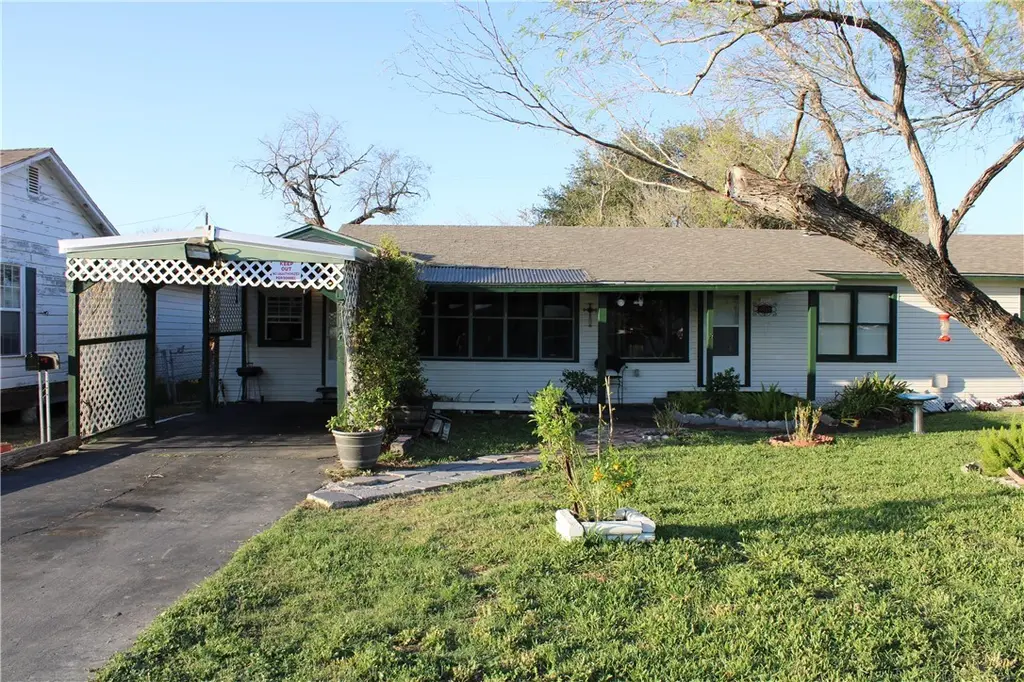
316 E Hoffman Ave · Kingsville, TX
Flood risk 1/10 · Minimal
- FEMA flood zone
- X (unshaded)
- Chance of flooding over 30 yrs
- 0.0%
- Est. flood insurance / yr
- $507 – $1,088
Fire risk 5/10 · Moderate
- Est. fire insurance / yr
- $1,222 – $2,270
Heat risk 9/10 · Severe
- Hot days now (above 111°F)
- 7 days/yr
- Hot days in 30 yrs
- 21 days/yr
Wind risk 8/10 · Major
- Chance of severe wind over 30 yrs
- 99.0%
Air-quality risk 1/10 · Minimal
- Unhealthy air days now
- 0 days/yr
- Unhealthy air days in 30 yrs
- 0 days/yr
Risk factors via First Street. Map © Google.
Why this score? — see what drove the B+ grade
The composite is a weighted blend of 9 inputs, each scored 0–100. Each bar is that input's sub-score; the figure is the points it added to the 100-point composite (weight × sub-score).
- Cash flow +30.0/30.0
- ARV discount +15.0/15.0
- DSCR +10.0/10.0
- 1% rule +9.0/10.0
- Rent growth +4.3/5.0
- Livability +3.5/5.0
- Condition / age +2.5/5.0
- Schools +1.5/10.0
- Appreciation +0.0/10.0
$129,900
🖨 Deal sheet 📄 Offer letter ✓ Due diligence
Listing remarks
Welcome to 316 E Hoffman Ave—a charming and spacious single-story home offering 4 bedrooms and 2 full bathrooms in the heart of Kingsville. This well-maintained residence features beautiful hardwood floors, abundant natural light, and a functional layout ideal for comfortable everyday living. The generously sized bedrooms include ample closet space, while the open living areas provide flexibility for entertaining or relaxing. The home is equipped with central heating and air and includes washer/dryer hookups for added convenience. Step outside to enjoy a covered patio and large yard—perfect for outdoor gatherings, pets, or future improvements. Situated on a quiet street with eas
Key facts
- Natural light
- Large yard
- Covered patio
Tags
Property features AI
Finance
- HOA & community: Short-term rentals allowed
Exterior
- Parking: Carport; Asphalt parking
- Utilities: Public water; Public sewer; Sewer available; Water available
- Home design: Single-story home; Vinyl siding exterior; Pillar/post/pier foundation; Shingle roof
- Construction: Built with vinyl siding
- Exterior features: Covered patio; Patio; Chain link fencing
Interior
- Flooring: Hardwood; Luxury vinyl plank
- Bathrooms: 2 full bathrooms
- Heating & cooling: Central heating (electric); Central air conditioning
- Interior features: Breakfast bar; No additional interior features noted
- Laundry & utility: Washer hookup; Dryer hookup
Neighborhood map
What this means for you Summary
Snapshot
- This is a 4-bed/2.0-bath single-family listed at $130k.
Deal economics
- At list price, monthly cash flow is $494 ($6k/yr) — positive.
- The deal already cash-flows at list — no discount required.
- Meets the 1% rule at list price ($2k rent vs $130k).
- Recommended offer: $126k (3.0% below list) — sets the bar for market timing.
- Cap rate 10.9% vs local median 5.4% in Kingsville — top-decile yield for the area; either an underpriced asset or a hidden risk that comps aren't pricing in. Stress-test before assuming the spread holds.
Location & tenants
- Location reads 70/100 on livability (#364 in TX) — a middle-class / working-renter tenant base. Strengths: cost of living A+, housing A+, health & safety A+; Watch: schools D+, employment D, amenities F.
- Kingsville ISD (town): math 13% / reading 22% proficiency, ranked #800 of 826 in TX (top 97%) — low school quality limits family demand, transient renter base, plan for 1-2y turnover; 71% free/reduced lunch — lower-income household profile, screen leases tightly.
- Market conditions: Rents rising fast (+7.2%/yr); 216 active listings in the ZIP; 7 comparable units currently listed for rent nearby; rentals lingering (median 44d on market — plan ~5-8 weeks vacancy on turnover, expect pricing pressure); 57% of comp listings sitting > 30 days — soft ceiling on asking rent; 24 units permitted in Kleberg County in 2024 (0 in 5+ unit buildings).
- This rent runs 36% of the median local income ($61k/yr) — at the standard rent-burdened threshold; future hikes will face affordability resistance.
Forward outlook
- Local home prices are declining (-3.0%/yr); year-one equity from $898 of loan paydown is wiped out by about $4k of value loss. Plan a longer hold.
- Kleberg County population projected at +9% by 2050 — modest demand growth; plan on rents tracking national, not racing it.
- At projected returns (-3.0% appreciation + 7.2% rent growth), your $36k cash investment doubles in ~6 years — after that, you're playing with house money.
Negotiation context
- It's been on market 45 days — a 3% lower offer ($126k) is reasonable based on typical stale-listing flexibility.
- 6 sale attempts since 6y ago with the ask held roughly flat each time — persistent listings suggest the price (not the market) is what's stuck; bring a comps-based counter.
Risks & watch-outs
- Watch-outs: built in 1950 — expect roof / HVAC / electrical / plumbing capex.
- Climate carrying-cost: severe wind risk, 99% chance of damaging wind over 30y; moderate wildfire risk; extreme-heat days projected 7→21/yr by 2055 (HVAC capex compounding) — expect insurance premiums to compound above CPI over the hold.
Questions for the listing agent
- It's been on market 45 days. Have you received any prior offers? Is the seller open to a 3% concession, seller financing, or rate buy-down credit?
- Built in 1950 — when were the roof, HVAC, electrical panel, plumbing, and water heater last replaced?
- Is there a deadline driving the sale (1031 exchange, divorce, estate, relocation)? That informs how much negotiation room exists.
- Schools are D-rated, which usually means shorter tenancies and higher turnover. Who's the typical renter profile here, and what's been the actual vacancy rate?
- What's the average days-on-market for RENTAL listings here right now (not sales)? A rising rental-DOM trend means longer vacancies and softer asking-rent achievability than the comps imply.
- What's the recent tenant-quality profile in this submarket — average credit score on applications, eviction rate, late-payment / NSF rate, and stable-employment percentage? A property-management company in the area should have these aggregated.
- How much new for-sale + rental construction is in the pipeline within 1–3 miles? Heavy new supply typically softens prices + rents 12–24 months out; constrained supply supports both.
Investment metrics
- 1% rule
- 1.40% ✓
- Cap rate
- 10.85%
- Cash-on-cash
- 16.29%
- DSCR
- 1.72
- GRM
- 6.0
CMA / ARV
- ARV (median comp)
- $172,913
- List price
- $129,900
- Delta
- -24.88%
- Verdict
- UNDERPRICED
- Comps
- 20 within 1.0 mi
Show comp detail 11 sales within ~0.75 mi
| Address | Dist | Beds/Ba | Sqft | Sold | Price | $/sf | Match |
|---|---|---|---|---|---|---|---|
| 1406 S 11th St | 0.31mi | 4/1.5 | 1,426 (-10%) | 4mo | $169,900 | $119 | 64 |
| 512 E Shelton | 0.20mi | 3/2.5 (-1) | 1,664 (+5%) | 17mo | $265,000 | $159 | 61 |
| 427 E Johnston | 0.33mi | 3/3.0 (-1) | 1,544 (-2%) | 18mo | $245,000 | $159 | 57 |
| 423 S 13th St | 0.67mi | 4/2.0 | 1,616 (+2%) | 11mo | $48,500 | $30 | 55 |
| 521 W Fordyce Ave | 0.66mi | 4/3.0 | 1,513 (-4%) | 9mo | $168,000 | $111 | 51 |
| 1102 S 11th St | 0.31mi | 3/1.0 (-1) | 1,434 (-9%) | 12mo | $135,900 | $95 | 51 |
| 2205 Las Palmas Dr | 0.72mi | 3/2.0 (-1) | 1,651 (+5%) | 9mo | $249,900 | $151 | 46 |
| 622 S 12th St | 0.54mi | 3/2.0 (-1) | 1,368 (-13%) | 2mo | $24,950 | $18 | 46 |
| 708 E Miller Ave | 0.36mi | 3/2.0 (-1) | 1,776 (+12%) | 20mo | $84,000 | $47 | 41 |
| 230 Carol Ave | 0.58mi | 3/2.0 (-1) | 1,346 (-15%) | 5mo | $123,000 | $91 | 39 |
| 1997 S 2nd St | 0.71mi | 3/2.0 (-1) | 1,611 (+2%) | 24mo | $265,000 | $164 | 38 |
Match score weights: distance 35% · size 25% · config 20% · recency 20%. Top-matched comps best support the ARV.
Projected returns pro-forma
-3.0% appreciation · 7.18% rent growth · sell at horizon
- IRR
- 12.1%
- Equity multiple
- 1.51×
- Total profit
- $18,386
- Equity at exit
- $19,369
- IRR
- 24.2%
- Equity multiple
- 3.54×
- Total profit
- $92,243
- Equity at exit
- $11,231
Cash invested: $36,372 (down + closing). Projections, not guarantees.
Landlord ↔ Tenant lean methodology
- Overall (STATE)
- 87 Strongly Landlord-Friendly
- State Texas
- 87 Strongly Landlord-Friendly · R+5
- County
- — inherits STATE
- City
- — inherits STATE
ZIP-level market 78363
- Rents YoY
- 7.2%
- Active inventory
- 216
- Price-to-rent
- 6.0×
Monthly cashflow live
- Estimated rent
- $1,813 high interval (Pro) →
- Mortgage (P&I)
- −$681
- Tax from tax record
- −$203 /mo · $2,437/yr
- Insurance
- −$54
- HOA
- −$0
- Vacancy / Maint / Mgmt
- −$381
- Net cashflow
- $494
Break-even live
UW: 25.0% down · 7.5% · 30yr · 1.5% tax · 5.0% vac · 8.0% maint · 8.0% mgmt
Financing live
Cash to close
- Down payment
- $32,475
- Closing costs
- $3,897
- Reserves months
- —
- Total cash needed
- —
Loan-product check · same deal, 3 products live
Conventional
25% down · 7.5% · 30yr
- Down + closing
- —
- Monthly P&I
- —
- Monthly cashflow
- —
- DSCR
- —
- Eligible?
- —
Personal DTI + credit; lowest rate.
DSCR
20% down · 8.5% · 30yr
- Down + closing
- —
- Monthly P&I
- —
- Monthly cashflow
- —
- DSCR
- —
- Eligible?
- —
No personal income docs; deal must DSCR.
Hard money
10% down · 12.0% · 12mo
- Down + closing
- —
- Monthly P&I
- —
- Monthly cashflow
- —
- DSCR
- —
- Eligible?
- —
Short-term bridge; refi at stabilization.
Rent comps 7 comps
| Address | Beds | Baths | Sqft | Rent | $/sqft | DOM | Units | Dist |
|---|---|---|---|---|---|---|---|---|
| 908 E Doddridge Ave Kingsville, TX | 3.0 | 1.0 | 1100 | $850 | $0.77 | 44d | 1 | 0.55mi |
| 1107 E Kenedy Ave Kingsville, TX | 3.0 | 2.5 | 1526 | $2,300 | $1.51 | 21d | 1 | 0.88mi |
| 307 W Alice Ave Kingsville, TX | 3.0 | 2.0 | 1600 | $1,500 | $0.94 | 44d | 1 | 1.06mi |
| 1342 Virginia Ave Kingsville, TX | 3.0 | 2.0 | 1764 | $2,500 | $1.42 | 21d | 1 | 1.19mi |
| 614 W Alice Ave Kingsville, TX | 3.0 | 2.0 | 1713 | $1,599 | $0.93 | 44d | 1 | 1.22mi |
| 915 S 23rd St Kingsville, TX | 3.0 | 2.0 | 1713 | $1,900 | $1.11 | 14d | 1 | 1.30mi |
| 629 W Nettie Ave Kingsville, TX | 3.0 | 2.0 | 1762 | $1,495 | $0.85 | 44d | 1 | 1.44mi |
Listing history 34 events
-
2026-06-19days on market $129,900 Active 45 DOM
-
2026-06-18days on market $129,900 Active 44 DOM
-
2026-06-17days on market $129,900 Active 43 DOM
-
2026-06-16days on market $129,900 Active 42 DOM
-
2026-06-15days on market $129,900 Active 41 DOM
-
2026-06-14days on market $129,900 Active 39 DOM
-
2026-06-12days on market $129,900 Active 38 DOM
-
2026-06-09days on market $129,900 Active 35 DOM
-
2026-06-08days on market $129,900 Active 34 DOM
-
2026-06-07days on market $129,900 Active 33 DOM
-
2026-06-05days on market $129,900 Active 30 DOM
-
2026-06-03days on market $129,900 Active 29 DOM
-
2026-06-02days on market $129,900 Active 28 DOM
-
2026-06-01days on market $129,900 Active 27 DOM
-
2026-05-31days on market $129,900 Active 26 DOM
-
2026-05-30days on market $129,900 Active 25 DOM
-
2026-05-05$129,900 Active 833-char remark
-
2026-03-16price $139,900
-
2025-11-17price $147,000
-
2025-10-12status Active
-
2025-09-26price $159,000
-
2025-09-23$169,900 Active
-
2025-08-15historical
-
2025-08-13$159,000 Active
-
2021-08-11historical
-
2021-08-11status Pending
-
2021-06-02soldstatus
-
2021-06-01$119,000
-
2021-05-29historical
-
2021-05-28soldstatus Closed
-
2021-04-07status Pending
-
2021-03-24historical Active Under Contract
-
2021-01-06price $119,750
-
2020-11-13$125,000 Active
ⓘ Source: listings_history table (triggers on properties + properties_extension) + one-shot
backfill from property_details.listing_events for pre-trigger history.
Tax reassessment forecast TX · Resets to sale price
- Current annual tax
- $2,437 · $203/mo
- Projected year-2 tax
- $2,437 · $203/mo
- Expected delta
- $0/yr ($0/mo · 0.0%)
ⓘ Screening estimate from a state-policy table — verify with the county assessor before closing.
Climate risk First Street
- Flood 1/10 Low FEMA zone X (unshaded) · 0% chance over 30 yrs
- Wildfire 5/10 Major
- Heat 9/10 Extreme 7 d/yr ≥111°F today · 21 d/yr by 30 yrs out
- Wind 8/10 Severe 99% chance of damaging wind over 30 yrs
- Air quality 1/10 Low 0 unhealthy d/yr today · 0 by 30 yrs out
Nearby sold comps map
Loading sold comps map…
Walkable amenities ~0.75 mi
Loading nearby amenities…
Taxation est. · year 1
- Rental income
- $21,753
- − Mortgage interest
- −$7,276
- − Property taxes
- −$2,437
- − Insurance
- −$650
- − Repairs & maintenance
- −$1,740
- − Management
- −$1,740
- − Depreciation
- −$3,779
- Taxable income
- $4,130
- Est. tax owed @ 24.0%
- −$991
- After-tax cash flow
- $4,932/yr
For passive investors: Depreciation is non-cash, so a rental often shows a tax loss while cash-flowing — sheltering income. Rental losses are passive: they offset passive income freely, and up to $25,000/yr can offset ordinary (W-2) income if you actively participate and your MAGI is under $100k (phasing out to $0 by $150k); unused losses carry forward. On sale, claimed depreciation is recaptured at up to 25%, and gains may owe capital-gains tax (a 1031 exchange can defer both). Figures are a year-1 estimate at your 24.0% rate — not tax advice; consult a CPA.
Schools (NCES district)
- District
- Kingsville ISD
- NCES district ID
- 4825680
- Math proficiency
- 13% ▼ -22.00%
- Reading proficiency
- 22% ▼ -7.00%
- Median HH income
- $36,308
- Composite
- 14.5/100
- National rank
- #9425
- State rank
- #800 of 826 in TX
Livability — Kingsville
- Score
- 70/100
- State rank
- #364
- US rank
- #7787
Category grades
Schools grade is shown separately in the Schools card above.
Census & demographics
- Census place
- Kingsville, TX
- County
- Kleberg County · 28,920 people
- City population
- 28,920
- Metro
- Kingsville, TX
- Population (ZIP)
- 28,920
- Household income
- $60,574
- Rent vs Own
- Severe rent burden
- 1663.0
Population outlook (Kleberg County) Hauer SSP2
- Today (2025)
- 31,615 people
- By 2030
- 32,054 · +1.4%
- By 2040
- 33,008 · +4.4%
- By 2050
- 34,536 · +9.2%
- By 2075
- 40,931 · +29.5%
- By 2100
- 46,001 · +45.5%
Race, ethnicity, and origin ACS 2023
- Neighborhood character
- Predominantly Hispanic (72%)
- Race & ethnicity
- Hispanic / Latino 72% Two or more races 36% White 20% Black 3% Asian 1% Native American 1%
- Hispanic origin (detail)
- Mexican 67%
- Common ancestry
- Italian 2% Slovak 1% Portuguese 1%
- Foreign-born
- 7% · Canada, China
- Languages at home
- 65% English-only · Spanish 32% Other Indo-European 1%
Political lean MEDSL · Kleberg
- 2024 margin
- R (+12.7) · D 43.3% · R 56.1%
- 2008→2024 swing
- -20.0pp toward R · 2008: 7.2pp · 2024: -12.7pp
- All cycles
- 2024: R+12.7 2020: R+1.7 2016: D+3.7 2012: D+7.8 2008: D+7.2
Not yet ingested
- Civics
- —
Market trends
- HPI YoY
- ▼ -87.12%
- Current HPI
- 147.6473
- Rent YoY
- ▲ 7.18%
- Metro
- Kingsville, TX
- State GDP YoY
- ▲ 3.95%
- F500 in state
- 110
Industry mix (Fortune 500 HQ in TX)
| Industry | F500 HQs | Revenue |
|---|---|---|
| Energy | 16 | $1,198B |
|
||
| Technology | 5 | $198B |
|
||
| Engineering / Construction | 4 | $72B |
|
||
| Energy Services | 3 | $60B |
|
||
| Utilities | 3 | $41B |
|
||
| Healthcare | 2 | $330B |
|
||
Price history
+3.9% since first listed18 events — show timeline
- 2026-05-05 Listed $129,900 CBMLS
- 2026-03-16 Price Changed $139,900 CBMLS
- 2025-11-17 Price Changed $147,000 CBMLS
- 2025-10-12 Relisted — CBMLS
- 2025-09-26 Price Changed $159,000 CBMLS
- 2025-09-23 Listed $169,900 CBMLS
- 2025-08-15 Listing Removed — HARMLS
- 2025-08-13 Listed $159,000 HARMLS
- 2021-08-11 Delisted — CBMLS
- 2021-08-11 Pending — CBMLS
- 2021-06-02 Sold (Public Records) — Public Records
- 2021-06-01 Listed $119,000 CBMLS
- 2021-05-29 Delisted — CBMLS
- 2021-05-28 Sold (MLS) — CBMLS
- 2021-04-07 Pending — CBMLS
- 2021-03-24 Contingent — CBMLS
- 2021-01-06 Price Changed $119,750 CBMLS
- 2020-11-13 Listed $125,000 CBMLS
Property tax history
+2.5%/yrLatest (2025): $2,437 · +10.2% YoY. Source: county tax records.
Cash-flow waterfall
monthlySold comps — $/sqft
last 12 mo · ≤1 miLoading sold comps…