21434 Coyote Trl · Lago Vista, TX
Flood risk 1/10 · Minimal
- FEMA flood zone
- X (unshaded)
- Chance of flooding over 30 yrs
- 0.0%
- Est. flood insurance / yr
- $507 – $1,088
Fire risk 1/10 · Minimal
- Est. fire insurance / yr
- $1,222 – $2,270
Heat risk 8/10 · Major
- Hot days now (above 107°F)
- 7 days/yr
- Hot days in 30 yrs
- 24 days/yr
Wind risk 6/10 · Moderate
- Chance of severe wind over 30 yrs
- 63.0%
Air-quality risk 1/10 · Minimal
- Unhealthy air days now
- 0 days/yr
- Unhealthy air days in 30 yrs
- 0 days/yr
Risk factors via First Street. Map © Google.
Why this score? — see what drove the C+ grade
The composite is a weighted blend of 9 inputs, each scored 0–100. Each bar is that input's sub-score; the figure is the points it added to the 100-point composite (weight × sub-score).
- Cash flow +23.9/30.0
- ARV discount +10.4/15.0
- DSCR +7.7/10.0
- 1% rule +5.5/10.0
- Schools +3.8/10.0
- Livability +3.6/5.0
- Rent growth +3.2/5.0
- Condition / age +2.5/5.0
- Appreciation +0.0/10.0
$132,500
🖨 Deal sheet 📄 Offer letter ✓ Due diligence
Listing remarks MLS
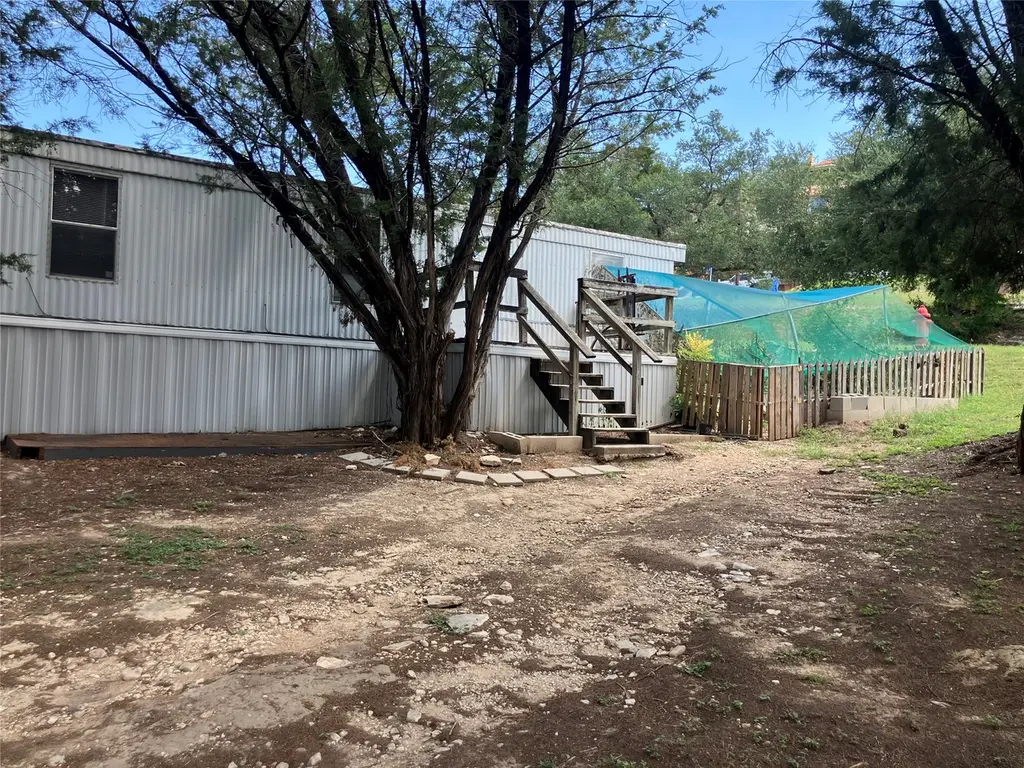
A fantastic rental income property! This single-wide 2-bedroom mobile home sits on a prime corner lot with a paved driveway offering plenty of parking space, even for a boat. The LVPOA membership includes a park pass, giving you access to local parks, the lake, and all the perks of Lago Vista living. Conveniently located near restaurants, grocery stores, the Cap Metro line, the library, and cozy coffee shops, all in a beautiful, natural setting.
Key facts
- Paved driveway
- Lake
- Corner lot
Tags
Neighborhood map
What this means for you Summary
Snapshot
- This is a 2-bed/1.0-bath manufactured listed at $132k.
Deal economics
- At list price, monthly cash flow is $256 ($3k/yr) — positive.
- The deal already cash-flows at list — no discount required.
- Meets the 1% rule at list price ($1k rent vs $132k).
- Recommended offer: $117k (12.0% below list) — sets the bar for market timing.
- Cap rate 8.6% vs local median 2.3% in Lago Vista — top-decile yield for the area; either an underpriced asset or a hidden risk that comps aren't pricing in. Stress-test before assuming the spread holds.
Location & tenants
- Location reads 72/100 on livability (#275 in TX) — a middle-class / working-renter tenant base. Strengths: crime A+, employment A+, housing A+; Watch: amenities F, commute F, health & safety F.
- Lago Vista ISD (rural): math 33% / reading 51% proficiency, ranked #269 of 826 in TX (top 33%) — families likely to look elsewhere, expect single-tenant / working-renter base with shorter leases.
- Market conditions: Rents rising (+3.0%/yr); 1092 active listings in the ZIP; 14 comparable units currently listed for rent nearby; rentals at typical pace (median 24d on market — plan ~3-4 weeks tenant-placement turnaround); 43% of comp listings sitting > 30 days — soft ceiling on asking rent; high-income renter base; 17,121 units permitted in Travis County in 2024 (11,963 in 5+ unit buildings).
- This rent is only 15% of the median local income ($113k/yr) — well below the 30% rent-burden line; pricing power to push rent on renewal without tenant pushback.
Forward outlook
- Local home prices are declining (-3.0%/yr); year-one equity from $916 of loan paydown is wiped out by about $4k of value loss. Plan a longer hold.
- Travis County population projected at +60% by 2050 — long-run rental-demand tailwind backs the buy-and-hold thesis.
Negotiation context
- It's been on market 283 days — a 12% lower offer ($117k) is reasonable based on typical stale-listing flexibility.
- 3 sale attempts since 14y ago with the ask held roughly flat each time — persistent listings suggest the price (not the market) is what's stuck; bring a comps-based counter.
Risks & watch-outs
- Climate carrying-cost: major wind risk, 63% chance of damaging wind over 30y; extreme-heat days projected 7→24/yr by 2055 (HVAC capex compounding) — expect insurance premiums to compound above CPI over the hold.
Questions for the listing agent
- It's been on market 283 days. Have you received any prior offers? Is the seller open to a 12% concession, seller financing, or rate buy-down credit?
- What does the HOA fee cover, when was the last increase, and are there any pending special assessments or reserve-fund shortfalls?
- Why hasn't it sold? Are there any deal-killer items the seller is aware of (foundation, flood, title, zoning, code violations)?
- Is there a deadline driving the sale (1031 exchange, divorce, estate, relocation)? That informs how much negotiation room exists.
- What's the average days-on-market for RENTAL listings here right now (not sales)? A rising rental-DOM trend means longer vacancies and softer asking-rent achievability than the comps imply.
- What's the recent tenant-quality profile in this submarket — average credit score on applications, eviction rate, late-payment / NSF rate, and stable-employment percentage? A property-management company in the area should have these aggregated.
- How much new for-sale + rental construction is in the pipeline within 1–3 miles? Heavy new supply typically softens prices + rents 12–24 months out; constrained supply supports both.
Investment metrics
- 1% rule
- 1.05% ✓
- Cap rate
- 8.61%
- Cash-on-cash
- 8.29%
- DSCR
- 1.37
- GRM
- 8.0
CMA / ARV
- ARV (median comp)
- $141,750
- List price
- $132,500
- Delta
- -6.53%
- Verdict
- FAIR
- Comps
- 1 within 2.0 mi
Show comp detail 1 sale within ~0.75 mi
| Address | Dist | Beds/Ba | Sqft | Sold | Price | $/sf | Match |
|---|---|---|---|---|---|---|---|
| 7302 Crossbow Trl | 0.23mi | 2/2.0 | 840 (+7%) | 10mo | $144,900 | $173 | 64 |
Match score weights: distance 35% · size 25% · config 20% · recency 20%. Top-matched comps best support the ARV.
Projected returns pro-forma
-3.0% appreciation · 2.98% rent growth · sell at horizon
- IRR
- -3.7%
- Equity multiple
- 0.86×
- Total profit
- $-5,203
- Equity at exit
- $19,756
- IRR
- 5.9%
- Equity multiple
- 1.44×
- Total profit
- $16,264
- Equity at exit
- $11,456
Cash invested: $37,100 (down + closing). Projections, not guarantees.
Landlord ↔ Tenant lean methodology
- Overall (STATE)
- 87 Strongly Landlord-Friendly
- State Texas
- 87 Strongly Landlord-Friendly · R+5
- County
- — inherits STATE
- City
- — inherits STATE
ZIP-level market 78645
- Home prices YoY
- -31.6%
- Rents YoY
- 3.0%
- Active inventory
- 1092
- Price-to-rent
- 8.0×
Monthly cashflow live
- Estimated rent
- $1,385 high interval (Pro) →
- Mortgage (P&I)
- −$695
- Tax from tax record
- −$75 /mo · $897/yr
- Insurance
- −$55
- HOA
- −$13
- Vacancy / Maint / Mgmt
- −$291
- Net cashflow
- $256
Break-even live
UW: 25.0% down · 7.5% · 30yr · 1.5% tax · 5.0% vac · 8.0% maint · 8.0% mgmt
Financing live
Cash to close
- Down payment
- $33,125
- Closing costs
- $3,975
- Reserves months
- —
- Total cash needed
- —
Loan-product check · same deal, 3 products live
Conventional
25% down · 7.5% · 30yr
- Down + closing
- —
- Monthly P&I
- —
- Monthly cashflow
- —
- DSCR
- —
- Eligible?
- —
Personal DTI + credit; lowest rate.
DSCR
20% down · 8.5% · 30yr
- Down + closing
- —
- Monthly P&I
- —
- Monthly cashflow
- —
- DSCR
- —
- Eligible?
- —
No personal income docs; deal must DSCR.
Hard money
10% down · 12.0% · 12mo
- Down + closing
- —
- Monthly P&I
- —
- Monthly cashflow
- —
- DSCR
- —
- Eligible?
- —
Short-term bridge; refi at stabilization.
Rent comps 14 comps
| Address | Beds | Baths | Sqft | Rent | $/sqft | DOM | Units | Dist |
|---|---|---|---|---|---|---|---|---|
| 7113 Comstock Cv Unit Rt side Lago Vista, TX | 2.0 | 1.0 | 750 | $1,000 | $1.33 | 44d | 1 | 0.08mi |
| 21475 Coyote Trl Unit A Lago Vista, TX | 2.0 | 1.0 | 900 | $1,295 | $1.44 | 44d | 1 | 0.21mi |
| 21475 Coyote Trl #2 Lago Vista, TX | 2.0 | 1.0 | 896 | $1,095 | $1.22 | 24d | 1 | 0.21mi |
| 21513 Coyote Trl Unit B Lago Vista, TX | 2.0 | 1.0 | 800 | $1,295 | $1.62 | 44d | 1 | 0.33mi |
| 5916 Lago Vista Way Unit B-10 UP Lago Vista, TX | 2.0 | 2.0 | 1110 | $1,295 | $1.17 | 44d | 1 | 1.07mi |
| 5914 Lago Vista Way Unit C23 Lago Vista, TX | 2.0 | 2.0 | 1037 | $1,295 | $1.25 | 24d | 1 | 1.10mi |
| 20802 Bonanza Unit 3 Lago Vista, TX | 2.0 | 2.0 | 826 | $1,100 | $1.33 | 44d | 1 | 1.11mi |
| 5909 Lago Vista Way Unit B Lago Vista, TX | 2.0 | 2.0 | 918 | $1,645 | $1.79 | 18d | 1 | 1.14mi |
| 5909 Lago Vista Way Unit D Lago Vista, TX | 2.0 | 2.0 | 918 | $1,545 | $1.68 | 18d | 1 | 1.14mi |
| 20600 Bonanza Unit 4 Leander, TX | 2.0 | 1.0 | 1062 | $1,300 | $1.22 | 20d | 1 | 1.18mi |
| 20600 Bonanza Unit 4 Leander, TX | 2.0 | 1.0 | 840 | $1,300 | $1.55 | 44d | 1 | 1.18mi |
| 20111 Travis Dr Unit B Lago Vista, TX | 2.0 | 2.0 | 1075 | $1,745 | $1.62 | 4d | 1 | 1.37mi |
| 20111 Travis Dr Unit A Lago Vista, TX | 2.0 | 2.0 | 1000 | $1,745 | $1.75 | 18d | 1 | 1.37mi |
| 5509 Thunderbird St Apt B Lago Vista, TX | 2.0 | 2.0 | 950 | $1,450 | $1.53 | 18d | 1 | 1.37mi |
HOA detail
- Monthly dues
- $13 · $156/yr
Listing history 18 events
-
2026-06-13days on market $132,500 Active 283 DOM
-
2026-06-09days on market $132,500 Active 279 DOM
-
2026-06-08days on market $132,500 Active 278 DOM
-
2026-06-07days on market $132,500 Active 277 DOM
-
2026-06-04days on market $132,500 Active 274 DOM
-
2026-06-03days on market $132,500 Active 273 DOM
-
2026-06-02days on market $132,500 Active 272 DOM
-
2026-06-01days on market $132,500 Active 271 DOM
-
2026-05-31days on market $132,500 Active 270 DOM
-
2025-09-17historical $975
-
2025-09-03$132,500 Active 449-char remark
Show marketing remark (449 chars)
A fantastic rental income property! This single-wide 2-bedroom mobile home sits on a prime corner lot with a paved driveway offering plenty of parking space, even for a boat. The LVPOA membership includes a park pass, giving you access to local parks, the lake, and all the perks of Lago Vista living. Conveniently located near restaurants, grocery stores, the Cap Metro line, the library, and cozy coffee shops, all in a beautiful, natural setting.
-
2025-08-28$975
-
2012-11-01historical Expired
-
2012-04-19Active
-
1989-01-30soldstatus
-
1987-03-31soldstatus
-
1984-07-26soldstatus
-
1984-07-26soldstatus
ⓘ Source: listings_history table (triggers on properties + properties_extension) + one-shot
backfill from property_details.listing_events for pre-trigger history.
Tax reassessment forecast TX · Resets to sale price
- Current annual tax
- $897 · $75/mo
- Projected year-2 tax
- $2,425 · $202/mo
- Expected delta
- +$1,528/yr (+$127/mo · 170.3%)
ⓘ Screening estimate from a state-policy table — verify with the county assessor before closing.
Climate risk First Street
- Flood 1/10 Low FEMA zone X (unshaded) · 0% chance over 30 yrs
- Wildfire 1/10 Low
- Heat 8/10 Severe 7 d/yr ≥107°F today · 24 d/yr by 30 yrs out
- Wind 6/10 Major 63% chance of damaging wind over 30 yrs
- Air quality 1/10 Low 0 unhealthy d/yr today · 0 by 30 yrs out
Nearby sold comps map
Loading sold comps map…
Walkable amenities ~0.75 mi
Loading nearby amenities…
Taxation est. · year 1
- Rental income
- $16,619
- − Mortgage interest
- −$7,422
- − Property taxes
- −$897
- − Insurance
- −$662
- − Repairs & maintenance
- −$1,330
- − Management
- −$1,330
- − HOA
- −$156
- − Depreciation
- −$3,855
- Taxable income
- $968
- Est. tax owed @ 24.0%
- −$232
- After-tax cash flow
- $2,843/yr
For passive investors: Depreciation is non-cash, so a rental often shows a tax loss while cash-flowing — sheltering income. Rental losses are passive: they offset passive income freely, and up to $25,000/yr can offset ordinary (W-2) income if you actively participate and your MAGI is under $100k (phasing out to $0 by $150k); unused losses carry forward. On sale, claimed depreciation is recaptured at up to 25%, and gains may owe capital-gains tax (a 1031 exchange can defer both). Figures are a year-1 estimate at your 24.0% rate — not tax advice; consult a CPA.
Schools (NCES district)
- District
- Lago Vista ISD
- NCES district ID
- 4826400
- Math proficiency
- 33% ▼ -24.00%
- Reading proficiency
- 51% ▼ -11.00%
- Median HH income
- $73,671
- Composite
- 38.35/100
- National rank
- #4216
- State rank
- #269 of 826 in TX
Livability — Lago Vista
- Score
- 72/100
- State rank
- #275
- US rank
- #6393
Category grades
Schools grade is shown separately in the Schools card above.
Census & demographics
- Census place
- Lago Vista, TX
- County
- Travis County · 1,299,254 people
- City population
- 15,256
- Metro
- Austin-Round Rock-Georgetown, TX
- Population (ZIP)
- 15,256
- Household income
- $113,008
- Rent vs Own
- Severe rent burden
- 20.0
Population outlook (Travis County) Hauer SSP2
- Today (2025)
- 1,545,133 people
- By 2030
- 1,729,269 · +11.9%
- By 2040
- 2,097,596 · +35.8%
- By 2050
- 2,463,890 · +59.5%
- By 2075
- 3,249,374 · +110.3%
- By 2100
- 3,801,868 · +146.1%
Race, ethnicity, and origin ACS 2023
- Neighborhood character
- Predominantly White (73%)
- Race & ethnicity
- White 73% Hispanic / Latino 19% Two or more races 11% Black 2%
- Hispanic origin (detail)
- Mexican 15%
- Common ancestry
- Italian 7% Slovak 4% Lithuanian 4%
- Foreign-born
- 10% · Canada
- Languages at home
- 85% English-only · Spanish 12% Other Indo-European 1% German/W. Germanic 1%
Political lean MEDSL · Travis
- 2024 margin
- Solid D (+39.3) · D 68.8% · R 29.4% · Other 1.8%
- 2008→2024 swing
- +9.9pp toward D · 2008: 29.4pp · 2024: 39.3pp
- All cycles
- 2024: D+39.3 2020: D+45.0 2016: D+38.9 2012: D+23.9 2008: D+29.4
Not yet ingested
- Civics
- —
Market trends
- HPI YoY
- ▼ -98.02%
- Current HPI
- 211.9678
- Rent YoY
- ▲ 2.98%
- Metro
- Austin-Round Rock-Georgetown, TX
- State GDP YoY
- ▲ 3.95%
- F500 in state
- 110
Industry mix (Fortune 500 HQ in TX)
| Industry | F500 HQs | Revenue |
|---|---|---|
| Energy | 16 | $1,198B |
|
||
| Technology | 5 | $198B |
|
||
| Engineering / Construction | 4 | $72B |
|
||
| Energy Services | 3 | $60B |
|
||
| Utilities | 3 | $41B |
|
||
| Healthcare | 2 | $330B |
|
||
Price history
9 events — show timeline
- 2025-09-17 Rental Removed $975 ACTRIS
- 2025-09-03 Listed $132,500 Unlock MLS
- 2025-08-28 Listed for Rent $975 ACTRIS
- 2012-11-01 Delisted — Unlock MLS
- 2012-04-19 Listed — Unlock MLS
- 1989-01-30 Sold (Public Records) — Public Records
- 1987-03-31 Sold (Public Records) — Public Records
- 1984-07-26 Sold (Public Records) — Public Records
- 1984-07-26 Sold (Public Records) — Public Records
Property tax history
+6.2%/yrLatest (2026): $897 · -5.4% YoY. Source: county tax records.
Cash-flow waterfall
monthlySold comps — $/sqft
last 12 mo · ≤1 miLoading sold comps…