 🏗️ New Construction
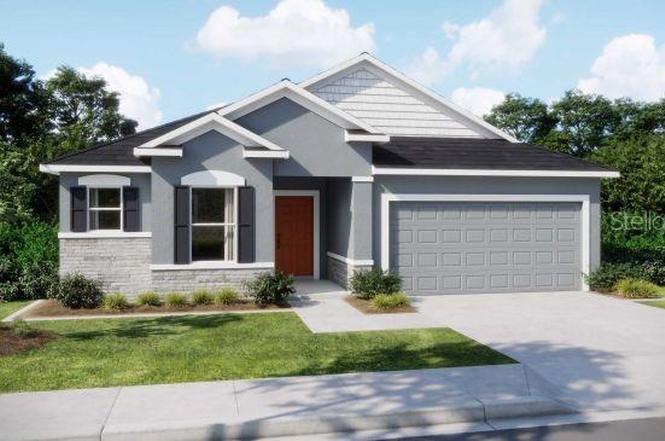
6439 Chorus Dr · Mascotte, FL
Flood risk No data
- FEMA flood zone
- —
- Chance of flooding over 30 yrs
- —
- Est. flood insurance / yr
- —
Fire risk No data
- Est. fire insurance / yr
- —
Heat risk No data
- Hot days now (above threshold)
- —
- Hot days in 30 yrs
- —
Wind risk No data
- Chance of severe wind over 30 yrs
- —
Air-quality risk No data
- Unhealthy air days now
- —
- Unhealthy air days in 30 yrs
- —
Risk factors via First Street. Map © Google.
Why this score? — see what drove the D grade
The composite is a weighted blend of 9 inputs, each scored 0–100. Each bar is that input's sub-score; the figure is the points it added to the 100-point composite (weight × sub-score).
- Appreciation +10.0/10.0
- Cash flow +7.8/30.0
- ARV discount +7.5/15.0
- Schools +4.2/10.0
- Livability +3.6/5.0
- Rent growth +2.5/5.0
- Condition / age +2.5/5.0
- DSCR +1.9/10.0
- 1% rule +1.5/10.0
$374,990
🖨 Deal sheet (PDF) 📄 Offer letter ✓ Due diligence
Listing remarks
Under contract-accepting backup offers. Under Construction. The Drexel at Villa Pass features a stone accent exterior, driveway and entry pavers, lush landscaping, and irrigation. Step through the 8’8” front door into the foyer entrance with 9’4” ceilings and a deluxe interior trim package. The open great room has two large windows and flows seamlessly into the kitchen, which includes quartz countertops, an upgraded stainless appliance package, tile backsplash, a large center island, generous pantry, and cabinet crown molding. A bright breakfast nook with an additional window completes the kitchen area. Just off the rear of the great room, a den with double French do
Key facts
- Irrigation
- Foyer entrance
- Lush landscaping
Tags
Property features AI
Finance
- Other: Lease restrictions apply
- Financial info: Total monthly fees shown $155; total annual fees shown $1,860
- HOA & community: HOA managed by Care Of Maronda Homes; Monthly HOA fee $155 (includes cable TV, internet, and grounds maintenance); Association amenities: playground, trails; Association approval required; Pets allowed
Exterior
- Parking: Attached 2-car garage (19x20) with driveway and garage door opener
- Security: Smoke detector(s)
- Utilities: Public water; Public sewer; Cable available
- Home design: Single family residence; One level; Pre-construction (projected completion August 15, 2026); East-facing
- Construction: Block, stone and stucco construction; Shingle roof; Slab foundation; New construction; Builder: Maronda Homes (Drexel model)
- Exterior features: Covered rear porch; Sliding doors; Landscaped lot; Paved road access; Irrigation equipment
Interior
- Kitchen: Dishwasher; Disposal; Microwave; Range; Electric water heater
- Bedrooms: 3 bedrooms
- Flooring: Carpet; Ceramic tile
- Bathrooms: 2 full bathrooms
- Heating & cooling: Central heating (electric); Central air conditioning
- Interior features: Crown molding; High ceilings; Open floorplan; Stone counters; Thermostat; Walk-in closet(s); Blinds; ENERGY STAR qualified windows; Insulated windows; Den/Library/Office; Great room
- Laundry & utility: Laundry room with washer and electric dryer hookups
Neighborhood map
What this means for you Summary
Snapshot
- This is a 3-bed/2.0-bath land listed at $375k.
Deal economics
- At list price, monthly cash flow is $-419 ($-5k/yr) — negative.
- To cash-flow at today's rent, offer at most $301k (19.7% below list).
- To meet the 1% rule (rent ≥ 1% of price), the offer needs to be $245k (34.8% below list).
- Recommended offer: $245k (34.8% below list) — sets the bar for 1% rule.
Location & tenants
- Location reads 71/100 on livability (#405 in FL) — a middle-class / working-renter tenant base. Strengths: cost of living A+, housing A+, health & safety A+; Watch: amenities F, commute F.
- Lake (suburban): math 49% / reading 50% proficiency, ranked #37 of 73 in FL (top 51%) — families likely to look elsewhere, expect single-tenant / working-renter base with shorter leases.
- Zoned schools: Mascotte Elementary School (math 50% / reading 47%, grade D, #1,152 of 2,144 statewide, top 55%, 855 students, 62% FRL, charter); Gray Middle School (math 45% / reading 45%, grade D, #310 of 571 statewide, top 56%, 1,148 students, 47% FRL); South Lake High School (math 36% / reading 39%, grade F, #336 of 667 statewide, top 51%, 2,169 students, 40% FRL) — zoned schools at 50% FRL track the district average.
- Market conditions: 98 active listings in the ZIP; 19 comparable units currently listed for rent nearby; rentals at typical pace (median 22d on market — plan ~3-4 weeks tenant-placement turnaround); solid renter incomes; 4,799 units permitted in Lake County in 2024 (814 in 5+ unit buildings).
- This rent runs 35% of the median local income ($84k/yr) — at the standard rent-burdened threshold; future hikes will face affordability resistance.
Forward outlook
- In year one you build about $40k of equity ($3k loan paydown + $37k appreciation (10.0% local appreciation)).
- Lake County population projected at +37% by 2050 — long-run rental-demand tailwind backs the buy-and-hold thesis.
- By year 2, paydown + projected appreciation supports a ~$64k cash-out refi (75% LTV) — recoverable capital for the next deal without selling this one.
Negotiation context
- It's been on market 99 days — a 9% lower offer ($341k) is reasonable based on typical stale-listing flexibility.
Questions for the listing agent
- What do current leases actually rent for vs. the listed asking? Can we see a recent rent roll and the last 12 months of T-12 income?
- It's been on market 99 days. Have you received any prior offers? Is the seller open to a 35% concession, seller financing, or rate buy-down credit?
- What does the HOA fee cover, when was the last increase, and are there any pending special assessments or reserve-fund shortfalls?
- Why hasn't it sold? Are there any deal-killer items the seller is aware of (foundation, flood, title, zoning, code violations)?
- Is there a deadline driving the sale (1031 exchange, divorce, estate, relocation)? That informs how much negotiation room exists.
- Schools are D-rated, which usually means shorter tenancies and higher turnover. Who's the typical renter profile here, and what's been the actual vacancy rate?
- The area grade is low — what's the realistic commute time and amenity access for the typical tenant pool here? Any planned neighborhood developments (good or bad) we should know about?
- What's the average days-on-market for RENTAL listings here right now (not sales)? A rising rental-DOM trend means longer vacancies and softer asking-rent achievability than the comps imply.
- What's the recent tenant-quality profile in this submarket — average credit score on applications, eviction rate, late-payment / NSF rate, and stable-employment percentage? A property-management company in the area should have these aggregated.
- How much new for-sale + rental construction is in the pipeline within 1–3 miles? Heavy new supply typically softens prices + rents 12–24 months out; constrained supply supports both.
Investment metrics
- 1% rule
- 0.65% ✗
- Cap rate
- 4.95%
- Cash-on-cash
- -4.78%
- DSCR
- 0.79
- GRM
- 12.8
CMA / ARV
No comps found within radius.
Projected returns pro-forma
10.0% appreciation · 3.0% rent growth · sell at horizon
- IRR
- 20.9%
- Equity multiple
- 2.69×
- Total profit
- $177,458
- Equity at exit
- $337,821
- IRR
- 18.9%
- Equity multiple
- 6.17×
- Total profit
- $543,329
- Equity at exit
- $728,523
Cash invested: $104,997 (down + closing). Projections, not guarantees.
Landlord ↔ Tenant lean methodology
- Overall (STATE)
- 87 Strongly Landlord-Friendly
- State Florida
- 87 Strongly Landlord-Friendly · R+3
- County
- — inherits STATE
- City
- — inherits STATE
ZIP-level market 34753
- Home prices YoY
- 7.2%
- Active inventory
- 98
- Price-to-rent
- 12.8×
Monthly cashflow live
- Estimated rent
- $2,446 high interval (Pro) →
- Mortgage (P&I)
- −$1,966
- Tax from tax record
- −$73 /mo · $876/yr
- Insurance
- −$156
- HOA
- −$155
- Vacancy / Maint / Mgmt
- −$514
- Net cashflow
- $-419
Break-even live
Sensitivity live
| Price | -10% $-206 | -5% $-312 | +0% $-419 | +5% $-525 | +10% $-631 |
|---|---|---|---|---|---|
| Rent | -10% $-612 | -5% $-515 | +0% $-419 | +5% $-322 | +10% $-225 |
| Rate | -1.0pp $-230 | -0.5pp $-323 | base $-419 | +0.5pp $-516 | +1.0pp $-615 |
UW: 25.0% down · 7.5% · 30yr · 1.5% tax · 5.0% vac · 8.0% maint · 8.0% mgmt
Financing live
Cash to close
- Down payment
- $93,748
- Closing costs
- $11,250
- Reserves months
- —
- Total cash needed
- —
Loan-product check · same deal, 3 products live
Conventional
25% down · 7.5% · 30yr
- Down + closing
- —
- Monthly P&I
- —
- Monthly cashflow
- —
- DSCR
- —
- Eligible?
- —
Personal DTI + credit; lowest rate.
DSCR
20% down · 8.5% · 30yr
- Down + closing
- —
- Monthly P&I
- —
- Monthly cashflow
- —
- DSCR
- —
- Eligible?
- —
No personal income docs; deal must DSCR.
Hard money
10% down · 12.0% · 12mo
- Down + closing
- —
- Monthly P&I
- —
- Monthly cashflow
- —
- DSCR
- —
- Eligible?
- —
Short-term bridge; refi at stabilization.
Rent comps 19 comps
| Address | Beds | Baths | Sqft | Rent | $/sqft | DOM | Units | Dist |
|---|---|---|---|---|---|---|---|---|
| 6337 Chorus Dr Groveland, FL | 3.0 | 2.0 | 1772 | $2,250 | $1.27 | 25d | 1 | 0.15mi |
| 2009 Sloans Outlook Dr Groveland, FL | 3.0 | 2.0 | 1670 | $2,250 | $1.35 | 22d | 1 | 0.17mi |
| 6612 Tempo Way Mascotte, FL | 3.0 | 2.0 | 1990 | $2,600 | $1.31 | 6d | 1 | 0.20mi |
| 6612 Tempo Way Mascotte, FL | 3.0 | 2.0 | 1990 | $2,600 | $1.31 | 0d | 1 | 0.20mi |
| 201 Sangmon Ct Groveland, FL | 3.0 | 2.5 | 1920 | $2,299 | $1.20 | 6d | 1 | 0.50mi |
| 1063 Bluegrass Dr Groveland, FL | 4.0 | 2.0 | 2182 | $2,500 | $1.15 | 25d | 1 | 0.59mi |
| 187 Hydra Way Groveland, FL | 4.0 | 3.0 | 2542 | $2,699 | $1.06 | 25d | 1 | 0.71mi |
| 2055 Newtown Rd Groveland, FL | 3.0 | 2.0 | 1808 | $1,995 | $1.10 | 25d | 1 | 0.83mi |
| 338 Ridgemark Ave Groveland, FL | 4.0 | 2.0 | 1824 | $2,300 | $1.26 | 6d | 1 | 0.85mi |
| 7201 Big Cedar Aly Groveland, FL | 3.0 | 2.5 | 1500 | $2,000 | $1.33 | 25d | 1 | 0.86mi |
| 2076 Newtown Rd Groveland, FL | 3.0 | 2.0 | 1676 | $1,850 | $1.10 | 25d | 1 | 0.92mi |
| 1600 Mayaro Ct Mascotte, FL | 3.0 | 2.0 | 1503 | $2,000 | $1.33 | 19d | 1 | 0.95mi |
| 614 Huey St Mascotte, FL | 3.0 | 2.0 | 1572 | $1,936 | $1.23 | 0d | 1 | 1.02mi |
| 1341 Brenway Dr Mascotte, FL | 4.0 | 2.0 | 1851 | $2,280 | $1.23 | 0d | 1 | 1.19mi |
| 4025 E Cardinal Pines Dr Mascotte, FL | 3.0 | 2.0 | 1260 | $2,100 | $1.67 | 6d | 1 | 1.20mi |
| 1665 Luft Ln Mascotte, FL | 3.0 | 2.0 | 1680 | $2,030 | $1.21 | 25d | 1 | 1.38mi |
| 6376 Green Bud Dr Groveland, FL | 3.0 | 2.0 | 1542 | $2,399 | $1.56 | 6d | 1 | 1.39mi |
| 2425 Begonia St Mascotte, FL | 4.0 | 2.0 | 1983 | $2,350 | $1.19 | 25d | 1 | 1.47mi |
| 405 Eventide Ave Mascotte, FL | 4.0 | 3.0 | 2000 | $2,250 | $1.12 | 22d | 1 | 1.48mi |
HOA detail
- Monthly dues
- $155 · $1,860/yr
- Likely covers
- landscaping
Listing history 6 events
-
2026-05-02status Pending
-
2026-04-08soldstatus $7,390,000
-
2026-02-10price $374,990
-
2026-01-26price $389,990
-
2026-01-23$391,990 Active
-
2025-12-01soldstatus $2,622,000
ⓘ Source: listings_history table (triggers on properties + properties_extension) + one-shot
backfill from property_details.listing_events for pre-trigger history.
Tax reassessment forecast FL · Resets to sale price
- Current annual tax
- $876 · $73/mo
- Projected year-2 tax
- $3,112 · $259/mo
- Expected delta
- +$2,236/yr (+$186/mo · 255.3%)
ⓘ Screening estimate from a state-policy table — verify with the county assessor before closing.
Nearby sold comps map
Loading sold comps map…
Walkable amenities ~0.75 mi
Loading nearby amenities…
Taxation est. · year 1
- Rental income
- $29,349
- − Mortgage interest
- −$21,005
- − Property taxes
- −$876
- − Insurance
- −$1,875
- − Repairs & maintenance
- −$2,348
- − Management
- −$2,348
- − HOA
- −$1,860
- − Depreciation
- −$10,909
- Taxable loss
- −$11,872
- Est. tax savings @ 24.0%
- +$2,849
- After-tax cash flow
- $-2,174/yr
For passive investors: Depreciation is non-cash, so a rental often shows a tax loss while cash-flowing — sheltering income. Rental losses are passive: they offset passive income freely, and up to $25,000/yr can offset ordinary (W-2) income if you actively participate and your MAGI is under $100k (phasing out to $0 by $150k); unused losses carry forward. On sale, claimed depreciation is recaptured at up to 25%, and gains may owe capital-gains tax (a 1031 exchange can defer both). Figures are a year-1 estimate at your 24.0% rate — not tax advice; consult a CPA.
Schools (NCES district)
- District
- Lake
- NCES district ID
- 1201050
- Math proficiency
- 49% ▼ -7.00%
- Reading proficiency
- 50% ▼ -4.00%
- Median HH income
- $46,632
- Composite
- 42.05/100
- National rank
- #3327
- State rank
- #37 of 73 in FL
Livability — Mascotte
- Score
- 71/100
- State rank
- #405
- US rank
- #7156
Category grades
Schools grade is shown separately in the Schools card above.
Census & demographics
- Census place
- Mascotte, FL
- County
- Lake County · 364,602 people
- City population
- 33,565
- Metro
- Orlando-Kissimmee-Sanford, FL
- Population (ZIP)
- 7,985
- Household income
- $83,868
- Rent vs Own
- Severe rent burden
- 16.0
Population outlook (Lake County) Hauer SSP2
- Today (2025)
- 386,640 people
- By 2030
- 417,107 · +7.9%
- By 2040
- 476,676 · +23.3%
- By 2050
- 531,296 · +37.4%
- By 2075
- 648,303 · +67.7%
- By 2100
- 698,530 · +80.7%
Race, ethnicity, and origin ACS 2023
- Neighborhood character
- Diverse neighborhood (Simpson 0.69)
- Race & ethnicity
- White 38% Hispanic / Latino 35% Two or more races 25% Black 20% Asian 3%
- Hispanic origin (detail)
- Mexican 11% Puerto Rican 12% Dominican 2%
- Common ancestry
- Slovak 1% Serbian 1% Romanian 1%
- Foreign-born
- 10% · Canada, Jamaica
- Languages at home
- 67% English-only · Spanish 32%
Political lean MEDSL · Lake
- 2024 margin
- Strong R (+24.7) · D 37.3% · R 62.0%
- 2008→2024 swing
- -11.2pp toward R · 2008: -13.5pp · 2024: -24.7pp
- All cycles
- 2024: R+24.7 2020: R+20.0 2016: R+23.1 2012: R+17.1 2008: R+13.5
Not yet ingested
- Civics
- —
Market trends
- HPI YoY
- ▲ 19.01%
- Current HPI
- 281.96
- Rent YoY
- —
- Metro
- Orlando-Kissimmee-Sanford, FL
- State GDP YoY
- ▲ 3.28%
- F500 in state
- 36
Industry mix (Fortune 500 HQ in FL)
| Industry | F500 HQs | Revenue |
|---|---|---|
| Industrial Technology | 2 | $29B |
|
||
| Insurance | 2 | $17B |
|
||
| Retail | 1 | $60B |
|
||
| Technology Distribution | 1 | $58B |
|
||
| Homebuilding | 1 | $35B |
|
||
| Technology Manufacturing | 1 | $35B |
|
||
Price history
+181.8% since first listed6 events — show timeline
- 2026-05-02 Pending — Stellar MLS as Distributed by MLS Grid
- 2026-04-08 Sold (Public Records) $7,390,000 Public Records
- 2026-02-10 Price Changed $374,990 Stellar MLS as Distributed by MLS Grid
- 2026-01-26 Price Changed $389,990 Stellar MLS as Distributed by MLS Grid
- 2026-01-23 Listed $391,990 Stellar MLS as Distributed by MLS Grid
- 2025-12-01 Sold (Public Records) $2,622,000 Public Records
Property tax history
+10.5%/yrLatest (2025): $876 · +10.5% YoY. Source: county tax records.
Cash-flow waterfall
monthlySold comps — $/sqft
last 12 mo · ≤1 miLoading sold comps…