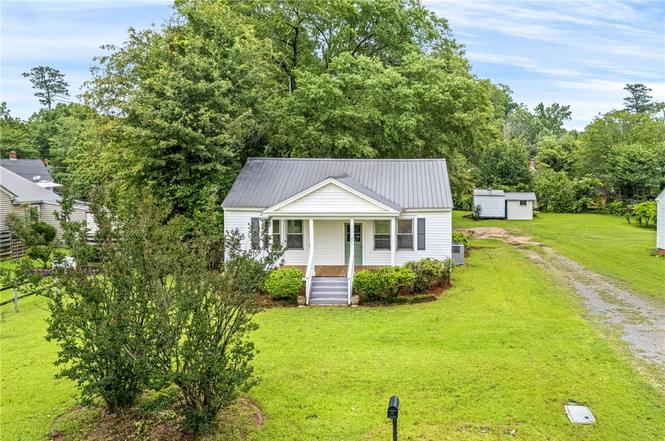
221 30th St · Opelika, AL
Flood risk 1/10 · Minimal
- FEMA flood zone
- X (unshaded)
- Chance of flooding over 30 yrs
- 0.0%
- Est. flood insurance / yr
- $507 – $1,088
Fire risk 3/10 · Minor
- Est. fire insurance / yr
- $916 – $1,700
Heat risk 6/10 · Moderate
- Hot days now (above 104°F)
- 7 days/yr
- Hot days in 30 yrs
- 20 days/yr
Wind risk 6/10 · Moderate
- Chance of severe wind over 30 yrs
- 67.0%
Air-quality risk 2/10 · Minimal
- Unhealthy air days now
- 1 days/yr
- Unhealthy air days in 30 yrs
- 1 days/yr
Risk factors via First Street. Map © Google.
Why this score? — see what drove the D+ grade
The composite is a weighted blend of 9 inputs, each scored 0–100. Each bar is that input's sub-score; the figure is the points it added to the 100-point composite (weight × sub-score).
- Cash flow +12.6/30.0
- ARV discount +11.0/15.0
- Appreciation +6.5/10.0
- DSCR +3.8/10.0
- Livability +3.2/5.0
- Schools +2.9/10.0
- 1% rule +2.7/10.0
- Rent growth +2.5/5.0
- Condition / age +2.5/5.0
$194,900
🖨 Deal sheet (PDF) 📄 Offer letter ✓ Due diligence
Listing remarks
$1,000 LENDER CREDIT WITH - MATT GREGG Cross Country Mortgage Looking for the perfect first home? Welcome to 221 N 30th Street in Opelika—a fully renovated, move-in-ready property that offers the ideal combination of comfort, style, and affordability. This charming 2-bedroom, 1-bath home has been thoughtfully updated from top to bottom, allowing you to enjoy homeownership without the worry of major renovations. Recent improvements include all-new flooring, fresh interior paint, a beautifully updated bathroom, and a completely remodeled kitchen featuring modern finishes and functionality. Inside, you'll find a bright and inviting living space that's perfect for relaxing, entertaining,
Key facts
- Fully renovated
- Spacious backyard
- Remodeled kitchen
Tags
Property features AI
Finance
- Other: Subdivision: Pepperel
- Financial info: No financial information provided
- HOA & community: No association amenities
Exterior
- Parking: No parking information provided
- Security: No security information provided
- Utilities: Natural gas available; Sewer connected; Water available
- Home design: Residential property; One story
- Construction: Vinyl siding
- Exterior features: Partial fencing; Crawl space basement
Interior
- Kitchen: Dishwasher; Gas range; Microwave; Oven; Refrigerator
- Bedrooms: No bedroom level details provided
- Flooring: No flooring information provided
- Bathrooms: 1 full bathroom
- Heating & cooling: Central air; Ceiling fan(s); Gas cooling; Natural gas heating; Forced air heating
- Interior features: Ceiling fan(s)
- Laundry & utility: Washer hookup
Neighborhood map
What this means for you Summary
Snapshot
- This is a 2-bed/1.0-bath single-family listed at $195k.
Deal economics
- At list price, monthly cash flow is $-25 ($-297/yr) — negative.
- To cash-flow at today's rent, offer at most $191k (2.2% below list).
- To meet the 1% rule (rent ≥ 1% of price), the offer needs to be $150k (23.1% below list).
- Recommended offer: $150k (23.1% below list) — sets the bar for 1% rule.
- Cap rate 6.1% vs local median 3.8% in Opelika — top-decile yield for the area; either an underpriced asset or a hidden risk that comps aren't pricing in. Stress-test before assuming the spread holds.
Location & tenants
- Location reads 63/100 on livability (#188 in AL) — a middle-class / working-renter tenant base. Strengths: cost of living A+, housing A+; Watch: employment C-, crime F, amenities F.
- Opelika City (urban): math 27% / reading 43% proficiency, ranked #45 of 129 in AL (top 35%) — families likely to look elsewhere, expect single-tenant / working-renter base with shorter leases; 62% free/reduced lunch — lower-income household profile, screen leases tightly.
- Zoned schools: West Forest Intermediate School (math 23% / reading 43%, grade F, #323 of 627 statewide, top 52%, 331 students, 90% FRL); Opelika Middle School (math 19% / reading 39%, grade F, #134 of 257 statewide, top 53%, 1,132 students, 72% FRL); Opelika High School (math 27% / reading 24%, grade F, #111 of 305 statewide, top 37%, 1,562 students, 62% FRL).
- Market conditions: 3 active listings in the ZIP; 3 comparable units currently listed for rent nearby; rentals at typical pace (median 15d on market — plan ~3-4 weeks tenant-placement turnaround); 1,858 units permitted in Lee County in 2024 (113 in 5+ unit buildings).
Forward outlook
- In year one you build about $7k of equity ($1k loan paydown + $6k appreciation (3.1% local appreciation)).
- Lee County population projected at +54% by 2050 — long-run rental-demand tailwind backs the buy-and-hold thesis.
- At projected returns (3.1% appreciation + 3.0% rent growth), your $55k cash investment doubles in ~7 years — after that, you're playing with house money.
- By year 5, paydown + projected appreciation supports a ~$32k cash-out refi (75% LTV) — recoverable capital for the next deal without selling this one.
Negotiation context
- Only 2 days on market — expect competitive offers; lowballing is unlikely to land.
Risks & watch-outs
- Watch-outs: built in 1935 — expect roof / HVAC / electrical / plumbing capex.
- Climate carrying-cost: major wind risk, 67% chance of damaging wind over 30y; extreme-heat days projected 7→20/yr by 2055 (HVAC capex compounding) — expect insurance premiums to compound above CPI over the hold.
Questions for the listing agent
- What do current leases actually rent for vs. the listed asking? Can we see a recent rent roll and the last 12 months of T-12 income?
- Built in 1935 — when were the roof, HVAC, electrical panel, plumbing, and water heater last replaced?
- Is there a deadline driving the sale (1031 exchange, divorce, estate, relocation)? That informs how much negotiation room exists.
- Crime grade is F in this area — have there been break-ins, vandalism, or insurance claims at this property in the last 3 years? What carrier currently insures it and at what premium?
- The area grade is low — what's the realistic commute time and amenity access for the typical tenant pool here? Any planned neighborhood developments (good or bad) we should know about?
- What's the average days-on-market for RENTAL listings here right now (not sales)? A rising rental-DOM trend means longer vacancies and softer asking-rent achievability than the comps imply.
- What's the recent tenant-quality profile in this submarket — average credit score on applications, eviction rate, late-payment / NSF rate, and stable-employment percentage? A property-management company in the area should have these aggregated.
- How much new for-sale + rental construction is in the pipeline within 1–3 miles? Heavy new supply typically softens prices + rents 12–24 months out; constrained supply supports both.
Investment metrics
- 1% rule
- 0.77% ✗
- Cap rate
- 6.14%
- Cash-on-cash
- -0.54%
- DSCR
- 0.98
- GRM
- 10.8
CMA / ARV
- ARV (on-the-fly)
- $211,120
- Comps found
- 7
Show comp detail 7 sales within ~0.75 mi
| Address | Dist | Beds/Ba | Sqft | Sold | Price | $/sf | Match |
|---|---|---|---|---|---|---|---|
| 2900 3rd Ave | 0.08mi | 2/1.0 | 1,066 (+5%) | 24mo | $187,500 | $176 | 68 |
| 2897 Ridge Crest Dr | 0.24mi | 2/2.0 | 1,000 (-2%) | 18mo | $208,000 | $208 | 68 |
| 2899 Ridge Crest Dr | 0.23mi | 2/2.0 | 1,000 (-2%) | 18mo | $217,000 | $217 | 68 |
| 2895 Ridge Crest Dr | 0.24mi | 2/2.0 | 1,000 (-2%) | 18mo | $208,000 | $208 | 67 |
| 2889 Ridge Crest Dr | 0.24mi | 2/2.0 | 1,000 (-2%) | 18mo | $217,000 | $217 | 67 |
| 209 N 24th St | 0.43mi | 2/1.0 | 1,150 (+13%) | 18mo | $188,000 | $163 | 43 |
| 2200 3rd Ave | 0.53mi | 2/2.0 | 1,149 (+13%) | 10mo | $220,000 | $191 | 41 |
Match score weights: distance 35% · size 25% · config 20% · recency 20%. Top-matched comps best support the ARV.
Projected returns pro-forma
3.06% appreciation · 3.0% rent growth · sell at horizon
- IRR
- 7.1%
- Equity multiple
- 1.41×
- Total profit
- $22,418
- Equity at exit
- $88,250
- IRR
- 9.8%
- Equity multiple
- 2.49×
- Total profit
- $81,246
- Equity at exit
- $136,484
Cash invested: $54,572 (down + closing). Projections, not guarantees.
Landlord ↔ Tenant lean methodology
- Overall (STATE)
- 90 Strongly Landlord-Friendly
- State Alabama
- 90 Strongly Landlord-Friendly · R+15
- County
- — inherits STATE
- City
- — inherits STATE
ZIP-level market 31801
- Home prices YoY
- 1.1%
- Active inventory
- 3
- Price-to-rent
- 10.8×
Monthly cashflow live
- Estimated rent
- $1,500 medium interval (Pro) →
- Mortgage (P&I)
- −$1,022
- Tax from tax record
- −$106 /mo · $1,273/yr
- Insurance
- −$81
- HOA
- −$0
- Vacancy / Maint / Mgmt
- −$315
- Net cashflow
- $-25
Break-even live
Sensitivity live
| Price | -10% $86 | -5% $30 | +0% $-25 | +5% $-80 | +10% $-135 |
|---|---|---|---|---|---|
| Rent | -10% $-143 | -5% $-84 | +0% $-25 | +5% $34 | +10% $94 |
| Rate | -1.0pp $73 | -0.5pp $25 | base $-25 | +0.5pp $-75 | +1.0pp $-127 |
UW: 25.0% down · 7.5% · 30yr · 1.5% tax · 5.0% vac · 8.0% maint · 8.0% mgmt
Financing live
Cash to close
- Down payment
- $48,725
- Closing costs
- $5,847
- Reserves months
- —
- Total cash needed
- —
Loan-product check · same deal, 3 products live
Conventional
25% down · 7.5% · 30yr
- Down + closing
- —
- Monthly P&I
- —
- Monthly cashflow
- —
- DSCR
- —
- Eligible?
- —
Personal DTI + credit; lowest rate.
DSCR
20% down · 8.5% · 30yr
- Down + closing
- —
- Monthly P&I
- —
- Monthly cashflow
- —
- DSCR
- —
- Eligible?
- —
No personal income docs; deal must DSCR.
Hard money
10% down · 12.0% · 12mo
- Down + closing
- —
- Monthly P&I
- —
- Monthly cashflow
- —
- DSCR
- —
- Eligible?
- —
Short-term bridge; refi at stabilization.
Rent comps 3 comps
| Address | Beds | Baths | Sqft | Rent | $/sqft | DOM | Units | Dist |
|---|---|---|---|---|---|---|---|---|
| 3501 Birmingham Hwy Opelika, AL | 2.0 | 1.0 | 936 | $1,150 | $1.23 | 15d | 1 | 0.92mi |
| 3855 Academy Dr Opelika, AL | 3.0 | 2.5 | 1492 | $1,975 | $1.32 | 15d | 1 | 1.03mi |
| 4150 Academy Dr Opelika, AL | 1.0–2.0 | 1.0–2.0 | 1050 | $1,550 | $1.48 | 15d | 3 | 1.43mi |
Listing history 4 events
-
2026-06-21status $194,900 Pending 2 DOM
-
2026-06-19days on market $194,900 Active 2 DOM
-
2026-06-17remarks 693-char remark
-
2026-06-17$194,900 Active 1 DOM
ⓘ Source: listings_history table (triggers on properties + properties_extension) + one-shot
backfill from property_details.listing_events for pre-trigger history.
Tax reassessment forecast AL · Resets to sale price
- Current annual tax
- $1,273 · $106/mo
- Projected year-2 tax
- $1,273 · $106/mo
- Expected delta
- $0/yr ($0/mo · 0.0%)
ⓘ Screening estimate from a state-policy table — verify with the county assessor before closing.
Climate risk First Street
- Flood 1/10 Low FEMA zone X (unshaded) · 0% chance over 30 yrs
- Wildfire 3/10 Moderate
- Heat 6/10 Major 7 d/yr ≥104°F today · 20 d/yr by 30 yrs out
- Wind 6/10 Major 67% chance of damaging wind over 30 yrs
- Air quality 2/10 Low 1 unhealthy d/yr today · 1 by 30 yrs out
Nearby sold comps map
Loading sold comps map…
Walkable amenities ~0.75 mi
Loading nearby amenities…
Taxation est. · year 1
- Rental income
- $17,995
- − Mortgage interest
- −$10,917
- − Property taxes
- −$1,273
- − Insurance
- −$974
- − Repairs & maintenance
- −$1,440
- − Management
- −$1,440
- − Depreciation
- −$5,670
- Taxable loss
- −$3,720
- Est. tax savings @ 24.0%
- +$893
- After-tax cash flow
- $596/yr
For passive investors: Depreciation is non-cash, so a rental often shows a tax loss while cash-flowing — sheltering income. Rental losses are passive: they offset passive income freely, and up to $25,000/yr can offset ordinary (W-2) income if you actively participate and your MAGI is under $100k (phasing out to $0 by $150k); unused losses carry forward. On sale, claimed depreciation is recaptured at up to 25%, and gains may owe capital-gains tax (a 1031 exchange can defer both). Figures are a year-1 estimate at your 24.0% rate — not tax advice; consult a CPA.
Schools (NCES district)
- District
- Opelika City
- NCES district ID
- 0102580
- Math proficiency
- 27% ▼ -25.00%
- Reading proficiency
- 43% ▼ -1.00%
- Median HH income
- $40,081
- Composite
- 29.34/100
- National rank
- #6541
- State rank
- #45 of 129 in AL
Livability — Opelika
- Score
- 63/100
- State rank
- #188
- US rank
- #15556
Category grades
Schools grade is shown separately in the Schools card above.
Census & demographics
- Census place
- Opelika, AL
- City population
- 45,973
- Population (ZIP)
- 2,786
Population outlook (Lee County) Hauer SSP2
- Today (2025)
- 196,440 people
- By 2030
- 217,417 · +10.7%
- By 2040
- 259,467 · +32.1%
- By 2050
- 301,557 · +53.5%
- By 2075
- 402,186 · +104.7%
- By 2100
- 474,503 · +141.6%
Race, ethnicity, and origin ACS 2023
- Neighborhood character
- Predominantly White (68%)
- Race & ethnicity
- White 68% Black 15% Two or more races 9% Hispanic / Latino 6% Asian 2%
- Hispanic origin (detail)
- Mexican 5% Puerto Rican 1%
- Common ancestry
- Italian 2% Lithuanian 1%
- Foreign-born
- 6% · Canada
- Languages at home
- 93% English-only · Spanish 5% Other Asian/Pacific 2%
Political lean MEDSL · Lee
- 2024 margin
- Strong R (+27.8) · D 35.5% · R 63.3% · Other 1.2%
- 2008→2024 swing
- -8.1pp toward R · 2008: -19.8pp · 2024: -27.8pp
- All cycles
- 2024: R+27.8 2020: R+20.1 2016: R+23.1 2012: R+19.9 2008: R+19.8
Not yet ingested
- Civics
- —
Market trends
- HPI YoY
- ▲ 3.06%
- Current HPI
- 280.4765
- Rent YoY
- —
- Metro
- —
- State GDP YoY
- ▲ 2.94%
- F500 in state
- 4
Industry mix (Fortune 500 HQ in AL)
| Industry | F500 HQs | Revenue |
|---|---|---|
| Financial Services | 1 | $8B |
|
||
| Healthcare | 1 | $5B |
|
||
Price history
1 event — show timeline
- 2026-06-17 Listed $194,900 LCMLS
Property tax history
+4.4%/yrLatest (2025): $1,273 · +0.0% YoY. Source: county tax records.
Cash-flow waterfall
monthlySold comps — $/sqft
last 12 mo · ≤1 miLoading sold comps…