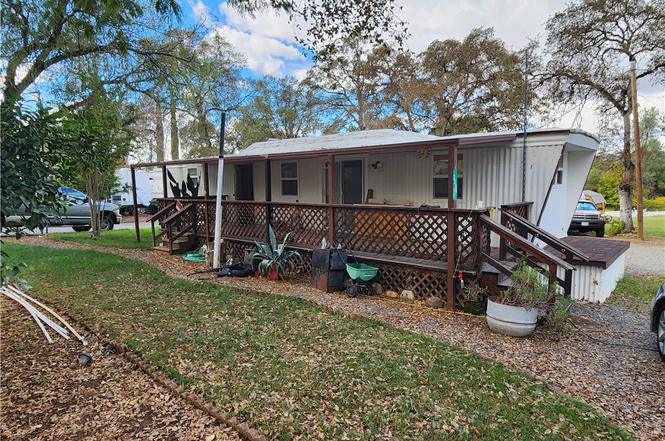
3864 Olive #1 · Oroville East, CA
Flood risk 4/10 · Minor
- FEMA flood zone
- X (unshaded)
- Chance of flooding over 30 yrs
- 0.22%
- Est. flood insurance / yr
- $507 – $1,088
Fire risk 10/10 · Severe
- Est. fire insurance / yr
- $659 – $1,223
Heat risk 7/10 · Major
- Hot days now (above 104°F)
- 7 days/yr
- Hot days in 30 yrs
- 16 days/yr
Wind risk 1/10 · Minimal
- Chance of severe wind over 30 yrs
- —
Air-quality risk 10/10 · Severe
- Unhealthy air days now
- 29 days/yr
- Unhealthy air days in 30 yrs
- 36 days/yr
Risk factors via First Street. Map © Google.
Why this score? — see what drove the D grade
The composite is a weighted blend of 9 inputs, each scored 0–100. Each bar is that input's sub-score; the figure is the points it added to the 100-point composite (weight × sub-score).
- Cash flow +15.0/30.0
- ARV discount +7.5/15.0
- 1% rule +5.0/10.0
- DSCR +5.0/10.0
- Schools +2.8/10.0
- Livability +2.6/5.0
- Rent growth +2.5/5.0
- Condition / age +2.5/5.0
- Appreciation +0.0/10.0
$25,000
🖨 Deal sheet 📄 Offer letter ✓ Due diligence
Listing remarks
Nice community in a great location in Oroville. Property is located close to shopping for convenience as well as outdoor activities such as hiking, fishing, biking, or relaxing at the lake. Community also offers pool, laundry facilities, high speed internet, and a dog park. All in a peaceful smoke-free environment. Call your agent today!
Key facts
- Laundry facilities
- High speed internet
- Great location
Tags
Property features AI
Finance
- Other: Community amenities: biking, dog park, hiking, fishing, lake
- Financial info: Assessments: Unknown; Mobile home remains (land lease community)
- HOA & community: Land lease: $510 monthly (seller-provided); Park name: Parkview Estates; Rent includes pool; Manager approval required; Pets: call
Exterior
- Parking: Unpaved driveway
- Security: Gated community
- Utilities: Standard electric; Public sewer; District/public water; Cable connected; Electricity connected; Water connected
- Home design: Single-story; Mobile home (10' x 50') remains on site; Entry level 1; Private road frontage
- Construction: Other roof; No fencing; No foundation details listed
- Exterior features: Wood deck/patio; Has patio; Community pool; Aluminum skirting; Front yard
Interior
- Kitchen: Refrigerator; Electric range; Electric oven; Formica counters
- Bedrooms: All bedrooms on main level
- Flooring: Vinyl; Laminate
- Bathrooms: One full bath with shower-in-tub
- Heating & cooling: Central furnace heating; Central cooling
- Interior features: Partially furnished; Formica counters; Double-pane windows; Gated community; Entry at front
- Laundry & utility: Community laundry
Neighborhood map
What this means for you Summary
Snapshot
- This is a 2-bed/1.5-bath manufactured listed at $25k.
Deal economics
- At list price, monthly cash flow is $999 ($12k/yr) — positive.
- The deal already cash-flows at list — no discount required.
- Meets the 1% rule at list price ($1k rent vs $25k).
- Recommended offer: $22k (12.0% below list) — sets the bar for market timing.
- Cap rate 54.3% vs local median 3.4% in Oroville East — top-decile yield for the area; either an underpriced asset or a hidden risk that comps aren't pricing in. Stress-test before assuming the spread holds.
Location & tenants
- Location reads 51/100 on livability (#1,082 in CA) — a working-class tenant base; expect higher turnover. Strengths: housing A+, employment A-; Watch: schools F, crime F, amenities F.
- Oroville Union High (town): math 19% / reading 49% proficiency, ranked #300 of 517 in CA (top 58%) — families likely to look elsewhere, expect single-tenant / working-renter base with shorter leases.
- Market conditions: 372 active listings in the ZIP; 946 units permitted in Butte County in 2024 (254 in 5+ unit buildings).
Forward outlook
- Local home prices are declining (-3.0%/yr); year-one equity from $173 of loan paydown is wiped out by about $750 of value loss. Plan a longer hold.
- Butte County population projected at +10% by 2050 — modest demand growth; plan on rents tracking national, not racing it.
- At projected returns (-3.0% appreciation + 3.0% rent growth), your $7k cash investment doubles in ~1 year — after that, you're playing with house money.
Negotiation context
- It's been on market 239 days — a 12% lower offer ($22k) is reasonable based on typical stale-listing flexibility.
Risks & watch-outs
- Climate carrying-cost: severe wildfire risk; extreme-heat days projected 7→16/yr by 2055 (HVAC capex compounding) — expect insurance premiums to compound above CPI over the hold.
Questions for the listing agent
- It's been on market 239 days. Have you received any prior offers? Is the seller open to a 12% concession, seller financing, or rate buy-down credit?
- Built in 1969 — when were the roof, HVAC, electrical panel, plumbing, and water heater last replaced?
- Why hasn't it sold? Are there any deal-killer items the seller is aware of (foundation, flood, title, zoning, code violations)?
- Is there a deadline driving the sale (1031 exchange, divorce, estate, relocation)? That informs how much negotiation room exists.
- Schools are F-rated, which usually means shorter tenancies and higher turnover. Who's the typical renter profile here, and what's been the actual vacancy rate?
- Crime grade is F in this area — have there been break-ins, vandalism, or insurance claims at this property in the last 3 years? What carrier currently insures it and at what premium?
- The area grade is low — what's the realistic commute time and amenity access for the typical tenant pool here? Any planned neighborhood developments (good or bad) we should know about?
- What's the average days-on-market for RENTAL listings here right now (not sales)? A rising rental-DOM trend means longer vacancies and softer asking-rent achievability than the comps imply.
- What's the recent tenant-quality profile in this submarket — average credit score on applications, eviction rate, late-payment / NSF rate, and stable-employment percentage? A property-management company in the area should have these aggregated.
- How much new for-sale + rental construction is in the pipeline within 1–3 miles? Heavy new supply typically softens prices + rents 12–24 months out; constrained supply supports both.
Investment metrics
- 1% rule
- 5.93% ✓
- Cap rate
- 54.25%
- Cash-on-cash
- 171.29%
- DSCR
- 8.62
- GRM
- 1.4
CMA / ARV
No comps found within radius.
Projected returns pro-forma
-3.0% appreciation · 3.0% rent growth · sell at horizon
- IRR
- —
- Equity multiple
- 9.52×
- Total profit
- $59,611
- Equity at exit
- $3,728
- IRR
- —
- Equity multiple
- 20.13×
- Total profit
- $133,945
- Equity at exit
- $2,162
Cash invested: $7,000 (down + closing). Projections, not guarantees.
Landlord ↔ Tenant lean methodology
- Overall (STATE)
- 18 Strongly Tenant-Friendly
- State California
- 18 Strongly Tenant-Friendly · D+13
- County
- — inherits STATE
- City
- — inherits STATE
ZIP-level market 95966
- Active inventory
- 372
- Price-to-rent
- 1.4×
Monthly cashflow live
- Estimated rent
- $1,484 medium interval (Pro) →
- Mortgage (P&I)
- −$131
- Tax est. 1.5%
- −$31 /mo · $375/yr
- Insurance
- −$10
- HOA
- −$0
- Vacancy / Maint / Mgmt
- −$312
- Net cashflow
- $999
Break-even live
UW: 25.0% down · 7.5% · 30yr · 1.5% tax · 5.0% vac · 8.0% maint · 8.0% mgmt
Financing live
Cash to close
- Down payment
- $6,250
- Closing costs
- $750
- Reserves months
- —
- Total cash needed
- —
Loan-product check · same deal, 3 products live
Conventional
25% down · 7.5% · 30yr
- Down + closing
- —
- Monthly P&I
- —
- Monthly cashflow
- —
- DSCR
- —
- Eligible?
- —
Personal DTI + credit; lowest rate.
DSCR
20% down · 8.5% · 30yr
- Down + closing
- —
- Monthly P&I
- —
- Monthly cashflow
- —
- DSCR
- —
- Eligible?
- —
No personal income docs; deal must DSCR.
Hard money
10% down · 12.0% · 12mo
- Down + closing
- —
- Monthly P&I
- —
- Monthly cashflow
- —
- DSCR
- —
- Eligible?
- —
Short-term bridge; refi at stabilization.
Listing history 18 events
-
2026-06-19days on market $25,000 Active 239 DOM
-
2026-06-18days on market $25,000 Active 238 DOM
-
2026-06-17days on market $25,000 Active 237 DOM
-
2026-06-16days on market $25,000 Active 236 DOM
-
2026-06-15days on market $25,000 Active 235 DOM
-
2026-06-14days on market $25,000 Active 233 DOM
-
2026-06-13days on market $25,000 Active 232 DOM
-
2026-06-10days on market $25,000 Active 230 DOM
-
2026-06-09days on market $25,000 Active 229 DOM
-
2026-06-08days on market $25,000 Active 228 DOM
-
2026-06-07days on market $25,000 Active 227 DOM
-
2026-06-03days on market $25,000 Active 223 DOM
-
2026-06-02days on market $25,000 Active 222 DOM
-
2026-06-01days on market $25,000 Active 221 DOM
-
2026-05-31days on market $25,000 Active 220 DOM
-
2026-05-30days on market $25,000 Active 219 DOM
-
2026-04-23price $25,000
-
2025-10-23$30,000 Active
ⓘ Source: listings_history table (triggers on properties + properties_extension) + one-shot
backfill from property_details.listing_events for pre-trigger history.
Climate risk First Street
- Flood 4/10 Moderate FEMA zone X (unshaded) · 22% chance over 30 yrs
- Wildfire 10/10 Extreme
- Heat 7/10 Severe 7 d/yr ≥104°F today · 16 d/yr by 30 yrs out
- Wind 1/10 Low
- Air quality 10/10 Extreme 29 unhealthy d/yr today · 36 by 30 yrs out
Nearby sold comps map
Loading sold comps map…
Walkable amenities ~0.75 mi
Loading nearby amenities…
Taxation est. · year 1
- Rental income
- $17,802
- − Mortgage interest
- −$1,400
- − Property taxes
- −$375
- − Insurance
- −$125
- − Repairs & maintenance
- −$1,424
- − Management
- −$1,424
- − Depreciation
- −$727
- Taxable income
- $12,326
- Est. tax owed @ 24.0%
- −$2,958
- After-tax cash flow
- $9,032/yr
For passive investors: Depreciation is non-cash, so a rental often shows a tax loss while cash-flowing — sheltering income. Rental losses are passive: they offset passive income freely, and up to $25,000/yr can offset ordinary (W-2) income if you actively participate and your MAGI is under $100k (phasing out to $0 by $150k); unused losses carry forward. On sale, claimed depreciation is recaptured at up to 25%, and gains may owe capital-gains tax (a 1031 exchange can defer both). Figures are a year-1 estimate at your 24.0% rate — not tax advice; consult a CPA.
Schools (NCES district)
- District
- Oroville Union High
- NCES district ID
- 0629130
- Math proficiency
- 19% ▼ -2.00%
- Reading proficiency
- 49% ▼ -4.00%
- Median HH income
- $38,085
- Composite
- 28.26/100
- National rank
- #6794
- State rank
- #300 of 517 in CA
Livability — Oroville East
- Score
- 51/100
- State rank
- #1082
- US rank
- #25347
Category grades
Schools grade is shown separately in the Schools card above.
Census & demographics
- Census place
- Oroville East, CA
- County
- Butte County · 175,030 people
- Metro
- Chico, CA
- Population (ZIP)
- 28,503
- Household income
- $65,586
- Rent vs Own
- Severe rent burden
- 807.0
Population outlook (Butte County) Hauer SSP2
- Today (2025)
- 237,527 people
- By 2030
- 243,804 · +2.6%
- By 2040
- 253,899 · +6.9%
- By 2050
- 262,561 · +10.5%
- By 2075
- 283,709 · +19.4%
- By 2100
- 282,689 · +19.0%
Race, ethnicity, and origin ACS 2023
- Neighborhood character
- Predominantly White (67%)
- Race & ethnicity
- White 67% Hispanic / Latino 18% Two or more races 14% Asian 6% Native American 2% Black 2%
- Hispanic origin (detail)
- Mexican 16%
- Common ancestry
- Lithuanian 3% Slovak 3% Portuguese 2%
- Foreign-born
- 6% · Canada
- Languages at home
- 88% English-only · Spanish 7% Other Asian/Pacific 3% Russian/Polish/Slavic 1%
Political lean MEDSL · Butte
- 2024 margin
- Toss-up / Even · D 46.8% · R 49.9% · Other 3.3%
- 2008→2024 swing
- -5.5pp toward R · 2008: 2.4pp · 2024: -3.1pp
- All cycles
- 2024: R+3.1 2020: D+1.7 2016: R+4.0 2012: R+3.9 2008: D+2.4
Not yet ingested
- Civics
- —
Market trends
- HPI YoY
- ▼ -284.58%
- Current HPI
- 267.1415
- Rent YoY
- —
- Metro
- Chico, CA
- State GDP YoY
- ▲ 3.21%
- F500 in state
- 116
Industry mix (Fortune 500 HQ in CA)
| Industry | F500 HQs | Revenue |
|---|---|---|
| Technology | 27 | $1,492B |
|
||
| Financial Services | 3 | $174B |
|
||
| Retail | 3 | $44B |
|
||
| Insurance | 3 | $26B |
|
||
| Media / Entertainment | 2 | $115B |
|
||
| Pharmaceuticals / Biotech | 2 | $62B |
|
||
Price history
-16.7% since first listed2 events — show timeline
- 2026-04-23 Price Changed $25,000 CRMLS
- 2025-10-23 Listed $30,000 CRMLS
Property tax history
+1.4%/yrLatest (2025): $26 · +0.8% YoY. Source: county tax records.
Cash-flow waterfall
monthlySold comps — $/sqft
last 12 mo · ≤1 miLoading sold comps…