6100 Woodlake Pkwy #311 · San Antonio, TX
Flood risk 1/10 · Minimal
- FEMA flood zone
- X (unshaded)
- Chance of flooding over 30 yrs
- 0.0%
- Est. flood insurance / yr
- $507 – $1,088
Fire risk 4/10 · Minor
- Est. fire insurance / yr
- $1,222 – $2,270
Heat risk 8/10 · Major
- Hot days now (above 108°F)
- 7 days/yr
- Hot days in 30 yrs
- 22 days/yr
Wind risk 8/10 · Major
- Chance of severe wind over 30 yrs
- 80.0%
Air-quality risk 1/10 · Minimal
- Unhealthy air days now
- 0 days/yr
- Unhealthy air days in 30 yrs
- 0 days/yr
Risk factors via First Street. Map © Google.
Why this score? — see what drove the C grade
The composite is a weighted blend of 9 inputs, each scored 0–100. Each bar is that input's sub-score; the figure is the points it added to the 100-point composite (weight × sub-score).
- Cash flow +21.8/30.0
- 1% rule +10.0/10.0
- ARV discount +7.5/15.0
- DSCR +7.0/10.0
- Livability +4.0/5.0
- Rent growth +2.7/5.0
- Condition / age +2.5/5.0
- Schools +2.4/10.0
- Appreciation +0.0/10.0
$79,900
🖨 Deal sheet (PDF) 📄 Offer letter ✓ Due diligence
Listing remarks
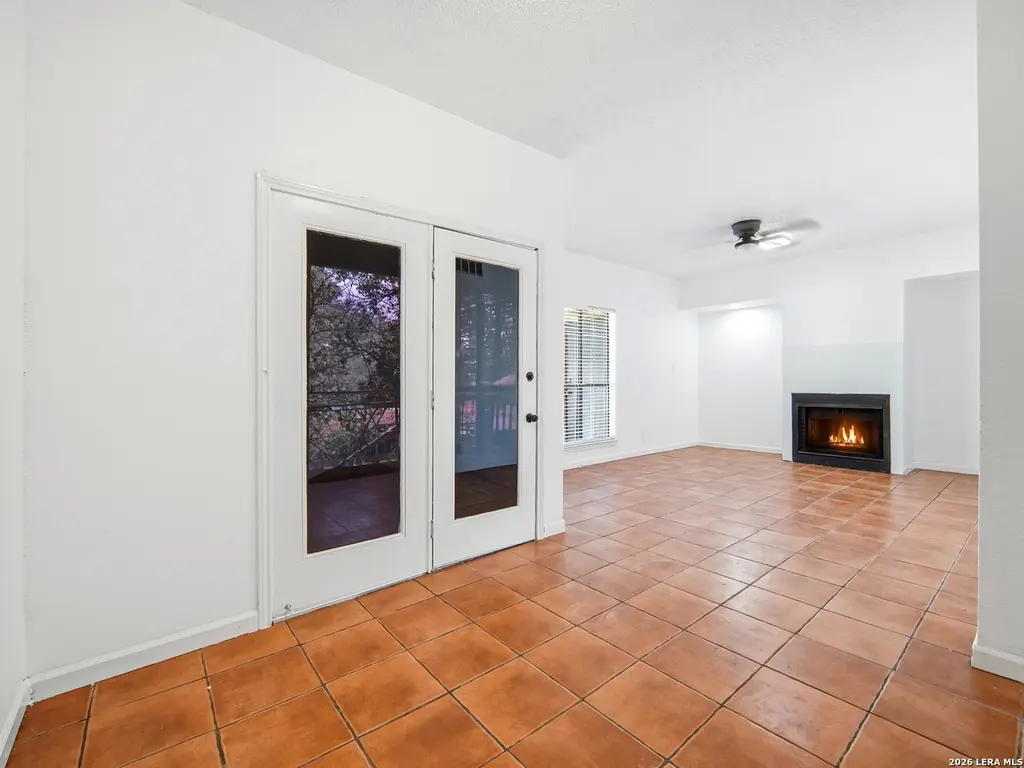
Remodeled interior condo featuring 2 bedrooms and 1 bathroom, offering an affordable and move-in ready option. Enjoy a cozy fireplace in the living area and a covered patio perfect for relaxing or entertaining. Conveniently located near Randolph Air Force Base with easy access to shopping, dining, and major roads. Great opportunity for first-time buyers or investors.
Key facts
- Remodeled interior
- Covered patio
- Cozy fireplace
Tags
Property features AI
Finance
- Other: Single-unit property (not multi-family)
- Financial info: Down payment resources not available
- HOA & community: Mandatory HOA with off-site management; HOA fee $350 monthly; Association transfer fee $250; HOA fee covers condo management
Exterior
- Parking: Detached parking
- Security: Controlled access
- Utilities: Appraisal District source for square footage
- Home design: Pre-owned property; Single-level unit; 1 level entry
- Construction: Approximately 42 years old
- Exterior features: Pool (community); Brick exterior; Controlled access
Interior
- Kitchen: Microwave oven; Stove/Range; Refrigerator; Dishwasher; 12 x 11 kitchen
- Bedrooms: Master bedroom with walk-in closet and full bath (15 x 11); Second bedroom (9 x 9)
- Flooring: Ceramic tile flooring
- Bathrooms: 1 full bathroom
- Heating & cooling: Central heating (electric); Central air conditioning
- Interior features: Washer and dryer connections; Microwave oven, Stove/Range, Refrigerator, Dishwasher; All window coverings remain; 1 living area; Living room fireplace
- Laundry & utility: Washer connection; Dryer connection
Neighborhood map
What this means for you Summary
Snapshot
- This is a 2-bed/1.0-bath condo listed at $80k.
Deal economics
- At list price, monthly cash flow is $125 ($1k/yr) — positive.
- The deal already cash-flows at list — no discount required.
- Meets the 1% rule at list price ($1k rent vs $80k).
- Recommended offer: $78k (3.0% below list) — sets the bar for market timing.
- Cap rate 8.2% vs local median 3.8% in San Antonio — top-decile yield for the area; either an underpriced asset or a hidden risk that comps aren't pricing in. Stress-test before assuming the spread holds.
Location & tenants
- Location reads 80/100 on livability (#31 in TX, #1,616 nationally) — a professional / high-income tenant draw. Strengths: amenities A+, commute A+, cost of living A+; Watch: crime F.
- Judson ISD (suburban): math 21% / reading 33% proficiency, ranked #660 of 826 in TX (top 80%) — low school quality limits family demand, transient renter base, plan for 1-2y turnover.
- Zoned schools: Woodlake El (math 17% / reading 22%, grade F, #3,583 of 4,322 statewide, top 86%, 655 students, 78% FRL); Henry Metzger Middle (math 12% / reading 20%, grade F, #1,543 of 1,662 statewide, top 94%, 953 students, 90% FRL); Karen Wagner H S (math 12% / reading 29%, grade F, #1,389 of 1,632 statewide, top 86%, 2,366 students, 80% FRL) — zoned schools average 83% FRL vs 57% district-wide (26 pts higher); higher-poverty schools than district average — tighter screening recommended.
- Market conditions: Rents flat; 193 active listings in the ZIP; 33 comparable units currently listed for rent nearby; rentals at typical pace (median 22d on market — plan ~3-4 weeks tenant-placement turnaround); 8,308 units permitted in Bexar County in 2024 (2,506 in 5+ unit buildings).
Forward outlook
- Local home prices are declining (-3.0%/yr); year-one equity from $552 of loan paydown is wiped out by about $2k of value loss. Plan a longer hold.
- Bexar County population projected at +50% by 2050 — long-run rental-demand tailwind backs the buy-and-hold thesis.
Negotiation context
- It's been on market 59 days — a 3% lower offer ($78k) is reasonable based on typical stale-listing flexibility.
- 5 sale attempts since 22y ago; this cycle's ask has dropped $5k (6%) from the opening price — seller is motivated, your offer sets the floor, not the list.
Risks & watch-outs
- Watch-outs: HOA is 27% of rent.
- Climate carrying-cost: severe wind risk, 80% chance of damaging wind over 30y; extreme-heat days projected 7→22/yr by 2055 (HVAC capex compounding) — expect insurance premiums to compound above CPI over the hold.
Questions for the listing agent
- It's been on market 59 days. Have you received any prior offers? Is the seller open to a 3% concession, seller financing, or rate buy-down credit?
- What does the HOA fee cover, when was the last increase, and are there any pending special assessments or reserve-fund shortfalls?
- Any open or pending special assessments — roof, HVAC, plumbing, elevator, façade? What's the per-unit balance and payoff schedule, and is the seller paying it off at close or rolling it to the buyer?
- Is there a deadline driving the sale (1031 exchange, divorce, estate, relocation)? That informs how much negotiation room exists.
- Crime grade is F in this area — have there been break-ins, vandalism, or insurance claims at this property in the last 3 years? What carrier currently insures it and at what premium?
- What's the average days-on-market for RENTAL listings here right now (not sales)? A rising rental-DOM trend means longer vacancies and softer asking-rent achievability than the comps imply.
- What's the recent tenant-quality profile in this submarket — average credit score on applications, eviction rate, late-payment / NSF rate, and stable-employment percentage? A property-management company in the area should have these aggregated.
- How much new apartment / multifamily construction is in the pipeline within 1–3 miles? Heavy new supply (>2% of stock underway) typically softens rents 12–24 months out; light construction supports rent growth.
Investment metrics
- 1% rule
- 1.65% ✓
- Cap rate
- 8.17%
- Cash-on-cash
- 6.70%
- DSCR
- 1.30
- GRM
- 5.1
CMA / ARV
No comps found within radius.
Projected returns pro-forma
-3.0% appreciation · 0.75% rent growth · sell at horizon
- IRR
- -9.7%
- Equity multiple
- 0.66×
- Total profit
- $-7,664
- Equity at exit
- $11,913
- IRR
- -5.6%
- Equity multiple
- 0.69×
- Total profit
- $-6,869
- Equity at exit
- $6,908
Cash invested: $22,372 (down + closing). Projections, not guarantees.
Landlord ↔ Tenant lean methodology
- Overall (STATE)
- 87 Strongly Landlord-Friendly
- State Texas
- 87 Strongly Landlord-Friendly · R+5
- County
- — inherits STATE
- City
- — inherits STATE
ZIP-level market 78244
- Home prices YoY
- -4.4%
- Rents YoY
- 0.8%
- Active inventory
- 193
- Price-to-rent
- 5.1×
Monthly cashflow live
- Estimated rent
- $1,315 high interval (Pro) →
- Mortgage (P&I)
- −$419
- Tax from tax record
- −$111 /mo · $1,337/yr
- Insurance
- −$33
- HOA
- −$350
- Vacancy / Maint / Mgmt
- −$276
- Net cashflow
- $125
Break-even live
Sensitivity live
| Price | -10% $170 | -5% $147 | +0% $125 | +5% $102 | +10% $80 |
|---|---|---|---|---|---|
| Rent | -10% $21 | -5% $73 | +0% $125 | +5% $177 | +10% $229 |
| Rate | -1.0pp $165 | -0.5pp $145 | base $125 | +0.5pp $104 | +1.0pp $83 |
UW: 25.0% down · 7.5% · 30yr · 1.5% tax · 5.0% vac · 8.0% maint · 8.0% mgmt
Financing live
Cash to close
- Down payment
- $19,975
- Closing costs
- $2,397
- Reserves months
- —
- Total cash needed
- —
Loan-product check · same deal, 3 products live
Conventional
25% down · 7.5% · 30yr
- Down + closing
- —
- Monthly P&I
- —
- Monthly cashflow
- —
- DSCR
- —
- Eligible?
- —
Personal DTI + credit; lowest rate.
DSCR
20% down · 8.5% · 30yr
- Down + closing
- —
- Monthly P&I
- —
- Monthly cashflow
- —
- DSCR
- —
- Eligible?
- —
No personal income docs; deal must DSCR.
Hard money
10% down · 12.0% · 12mo
- Down + closing
- —
- Monthly P&I
- —
- Monthly cashflow
- —
- DSCR
- —
- Eligible?
- —
Short-term bridge; refi at stabilization.
Rent comps 33 comps
| Address | Beds | Baths | Sqft | Rent | $/sqft | DOM | Units | Dist |
|---|---|---|---|---|---|---|---|---|
| 6100 Woodlake Pkwy San Antonio, TX | 1.0 | 1.0 | 910 | $1,550 | $1.70 | 45d | 1 | 0.01mi |
| 7018 Elmbank San Antonio, TX | 2.0 | 1.0 | 1050 | $1,200 | $1.14 | 25d | 1 | 0.25mi |
| 7017 Silver Cyn Unit 7017-SC San Antonio, TX | 2.0 | 1.0 | 1055 | $1,100 | $1.04 | 45d | 1 | 0.27mi |
| 7323 Golf Vista Blvd San Antonio, TX | 2.0 | 2.0 | 1100 | $1,200 | $1.09 | 25d | 1 | 0.32mi |
| 7027 FM 78 San Antonio, TX | 1.0–3.0 | 1.0–2.0 | 868 | $1,914 | $2.20 | 21d | 10 | 0.34mi |
| 5613 Lochmoor #2 San Antonio, TX | 2.0 | 1.0 | 800 | $1,050 | $1.31 | 45d | 1 | 0.34mi |
| 5613 Lochmoor #2 San Antonio, TX | 2.0 | 1.0 | 800 | $1,050 | $1.31 | 23d | 1 | 0.34mi |
| 5609 Lochmoor Unit 1 San Antonio, TX | 2.0 | 1.0 | 800 | $825 | $1.03 | 45d | 1 | 0.35mi |
| 5607 Lochmoor Unit 2 San Antonio, TX | 2.0 | 1.0 | 825 | $875 | $1.06 | 45d | 1 | 0.35mi |
| 5528 Lochmoor San Antonio, TX | 2.0 | 2.0 | 987 | $1,775 | $1.80 | 4d | 1 | 0.35mi |
| 7363 Golf Vista Blvd San Antonio, TX | 2.0 | 2.0 | 1050 | $1,275 | $1.21 | 45d | 1 | 0.37mi |
| 5507 Roanwood San Antonio, TX | 3.0 | 2.0 | 950 | $1,200 | $1.26 | 0d | 1 | 0.37mi |
| 5529 Lochmoor Unit 2 San Antonio, TX | 2.0 | 1.0 | 825 | $875 | $1.06 | 45d | 1 | 0.37mi |
| 5527 Lochmoor Unit 2 San Antonio, TX | 2.0 | 1.0 | 825 | $875 | $1.06 | 45d | 1 | 0.38mi |
| 7027 Farm to Market Road 78 Unit 610 San Antonio, TX | 1.0 | 1.0 | 587 | $975 | $1.66 | 0d | 1 | 0.42mi |
| 7027 Farm-To-Market Road 78 Unit 9204 San Antonio, TX | 2.0 | 2.0 | 954 | $1,780 | $1.87 | 6d | 1 | 0.42mi |
| 7027 Farm to Market Road 78 Unit 710 San Antonio, TX | 2.0 | 2.0 | 881 | $1,115 | $1.27 | 0d | 1 | 0.42mi |
| 7027 Farm to Market Road 78 Unit 14203 San Antonio, TX | 2.0 | 1.0 | 881 | $1,580 | $1.79 | 4d | 1 | 0.42mi |
| 7027 Farm To Market RD San Antonio, TX | 1.0–3.0 | 1.0–2.0 | 868 | $1,294 | $1.49 | 0d | 31 | 0.46mi |
| 7554 Old Seguin Rd San Antonio, TX | 1.0 | 1.0 | 700 | $989 | $1.41 | 45d | 1 | 0.79mi |
| 5415 N Foster Rd San Antonio, TX | 1.0–3.0 | 1.0–2.0 | 966 | $1,292 | $1.34 | 0d | 23 | 0.89mi |
| 7114 Winding Shelf San Antonio, TX | 1.0 | 1.0 | 527 | $1,250 | $2.37 | 6d | 1 | 0.96mi |
| 7107 Winding Shelf San Antonio, TX | 3.0 | 1.0 | 1016 | $1,408 | $1.39 | 25d | 1 | 0.98mi |
| 7810 Walzem Rd San Antonio, TX | 2.0–3.0 | 2.0 | 1052 | $1,060 | $1.01 | 3d | 1 | 0.99mi |
| 7125 Elm Cv San Antonio, TX | 2.0 | 2.0 | 664 | $1,150 | $1.73 | 12d | 1 | 1.20mi |
| 7037 Elm Cv San Antonio, TX | 2.0 | 2.0 | 661 | $1,203 | $1.82 | 6d | 1 | 1.21mi |
| 7128 Elm Cv San Antonio, TX | 2.0 | 2.0 | 661 | $1,097 | $1.66 | 6d | 1 | 1.23mi |
| 3711 Colemans Run Converse, TX | 3.0 | 2.0–2.5 | 1380 | $1,552 | $1.12 | 4d | 1 | 1.27mi |
| 4711 Gavlick Farm San Antonio, TX | 3.0 | 1.0 | 975 | $1,250 | $1.28 | 45d | 1 | 1.28mi |
| 4807 Georges Farm San Antonio, TX | 3.0 | 2.0 | 1008 | $1,295 | $1.28 | 45d | 1 | 1.30mi |
| 4839 Castle Strm San Antonio, TX | 3.0 | 1.0 | 872 | $1,300 | $1.49 | 23d | 1 | 1.38mi |
| 7614 Glen Hurst San Antonio, TX | 3.0 | 1.0 | 1100 | $1,400 | $1.27 | 3d | 1 | 1.45mi |
| 7603 Glen Vis San Antonio, TX | 3.0 | 2.0 | 980 | $1,200 | $1.22 | 9d | 1 | 1.45mi |
HOA detail condo
- Monthly dues
- $350 · $4,200/yr
- Assessments
- None detected in remarks — confirm with the listing agent.
Listing history 25 events
-
2026-06-21days on market $79,900 Active 59 DOM
-
2026-06-18days on market $79,900 Active 56 DOM
-
2026-06-17days on market $79,900 Active 55 DOM
-
2026-06-16days on market $79,900 Active 54 DOM
-
2026-06-15days on market $79,900 Active 53 DOM
-
2026-06-13statusdays on market $79,900 Active 51 DOM
-
2026-06-09days on market $79,900 Price Change 47 DOM
-
2026-06-08days on market $79,900 Price Change 46 DOM
-
2026-06-07days on market $79,900 Price Change 45 DOM
-
2026-06-04days on market $79,900 Price Change 42 DOM
-
2026-06-03days on market $79,900 Price Change 41 DOM
-
2026-06-02pricestatusdays on market $79,900 Price Change 40 DOM
-
2026-06-01days on market $84,900 Active 39 DOM
-
2026-05-31days on market $84,900 Active 38 DOM
-
2026-04-23$84,900 New 369-char remark
-
2026-03-25soldstatus
-
2022-09-02soldstatus
-
2014-02-19soldstatus
-
2006-03-02soldstatus
-
2006-02-24soldstatus 177-char remark
-
2005-10-30$55,000 177-char remark
-
2005-02-22soldstatus
-
2005-02-22soldstatus
-
2005-02-17soldstatus
-
2004-10-14$54,000
ⓘ Source: listings_history table (triggers on properties + properties_extension) + one-shot
backfill from property_details.listing_events for pre-trigger history.
Tax reassessment forecast TX · Resets to sale price
- Current annual tax
- $1,337 · $111/mo
- Projected year-2 tax
- $1,462 · $122/mo
- Expected delta
- +$125/yr (+$10/mo · 9.4%)
ⓘ Screening estimate from a state-policy table — verify with the county assessor before closing.
Climate risk First Street
- Flood 1/10 Low FEMA zone X (unshaded) · 0% chance over 30 yrs
- Wildfire 4/10 Moderate
- Heat 8/10 Severe 7 d/yr ≥108°F today · 22 d/yr by 30 yrs out
- Wind 8/10 Severe 80% chance of damaging wind over 30 yrs
- Air quality 1/10 Low 0 unhealthy d/yr today · 0 by 30 yrs out
Nearby sold comps map
Loading sold comps map…
Walkable amenities ~0.75 mi
Loading nearby amenities…
Taxation est. · year 1
- Rental income
- $15,775
- − Mortgage interest
- −$4,476
- − Property taxes
- −$1,337
- − Insurance
- −$400
- − Repairs & maintenance
- −$1,262
- − Management
- −$1,262
- − HOA
- −$4,200
- − Depreciation
- −$2,324
- Taxable income
- $515
- Est. tax owed @ 24.0%
- −$124
- After-tax cash flow
- $1,375/yr
For passive investors: Depreciation is non-cash, so a rental often shows a tax loss while cash-flowing — sheltering income. Rental losses are passive: they offset passive income freely, and up to $25,000/yr can offset ordinary (W-2) income if you actively participate and your MAGI is under $100k (phasing out to $0 by $150k); unused losses carry forward. On sale, claimed depreciation is recaptured at up to 25%, and gains may owe capital-gains tax (a 1031 exchange can defer both). Figures are a year-1 estimate at your 24.0% rate — not tax advice; consult a CPA.
Schools (NCES district)
- District
- Judson ISD
- NCES district ID
- 4824990
- Math proficiency
- 21% ▼ -21.00%
- Reading proficiency
- 33% ▼ -7.00%
- Median HH income
- $57,542
- Composite
- 24.39/100
- National rank
- #7689
- State rank
- #660 of 826 in TX
Livability — San Antonio
- Score
- 80/100
- State rank
- #31
- US rank
- #1616
Category grades
Schools grade is shown separately in the Schools card above.
Census & demographics
- County
- Bexar County · 1,990,555 people
- City population
- 1,806,925
- Metro
- San Antonio-New Braunfels, TX
- Population (ZIP)
- 38,092
- Household income
- $71,128
- Rent vs Own
- Severe rent burden
- 677.0
Population outlook (Bexar County) Hauer SSP2
- Today (2025)
- 2,336,851 people
- By 2030
- 2,560,728 · +9.6%
- By 2040
- 3,020,569 · +29.3%
- By 2050
- 3,493,522 · +49.5%
- By 2075
- 4,668,459 · +99.8%
- By 2100
- 5,533,242 · +136.8%
Race, ethnicity, and origin ACS 2023
- Neighborhood character
- Diverse neighborhood (Simpson 0.68)
- Race & ethnicity
- Hispanic / Latino 46% Black 27% Two or more races 24% White 20% Asian 2%
- Hispanic origin (detail)
- Mexican 38% Puerto Rican 2% Cuban 2%
- Common ancestry
- Slovak 2% Lithuanian 1% Italian 1%
- Foreign-born
- 14% · Canada, Vietnam
- Languages at home
- 68% English-only · Spanish 28% Vietnamese 1% Tagalog/Filipino 1%
Political lean MEDSL · Bexar
- 2024 margin
- Lean D (+9.8) · D 54.3% · R 44.6% · Other 1.1%
- 2008→2024 swing
- +4.2pp toward D · 2008: 5.6pp · 2024: 9.8pp
- All cycles
- 2024: D+9.8 2020: D+18.2 2016: D+13.5 2012: D+4.6 2008: D+5.6
Not yet ingested
- Civics
- —
Market trends
- HPI YoY
- ▼ -11.42%
- Current HPI
- 249.3834
- Rent YoY
- ▲ 0.75%
- Metro
- San Antonio-New Braunfels, TX
- State GDP YoY
- ▲ 3.95%
- F500 in state
- 110
Industry mix (Fortune 500 HQ in TX)
| Industry | F500 HQs | Revenue |
|---|---|---|
| Energy | 16 | $1,198B |
|
||
| Technology | 5 | $198B |
|
||
| Engineering / Construction | 4 | $72B |
|
||
| Energy Services | 3 | $60B |
|
||
| Utilities | 3 | $41B |
|
||
| Healthcare | 2 | $330B |
|
||
Price history
+48.0% since first listed16 events — show timeline
- 2026-06-02 Price Changed $79,900 LERA
- 2026-04-23 Listed $84,900 LERA
- 2026-03-25 Sold (Public Records) — Public Records
- 2026-03-11 Listing Removed — LERA
- 2026-01-11 Listed $104,950 LERA
- 2022-09-02 Sold (Public Records) — Public Records
- 2014-02-19 Sold (Public Records) — Public Records
- 2013-11-01 Listing Removed — LERA
- 2012-08-28 Listed $31,000 LERA
- 2006-03-02 Sold (Public Records) — Public Records
- 2006-02-24 Sold (MLS) — LERA
- 2005-10-30 Listed $55,000 LERA
- 2005-02-22 Sold (Public Records) — Public Records
- 2005-02-22 Sold (Public Records) — Public Records
- 2005-02-17 Sold (MLS) — LERA
- 2004-10-14 Listed $54,000 LERA
Property tax history
+9.6%/yrLatest (2025): $1,337 · -3.2% YoY. Source: county tax records.
Cash-flow waterfall
monthlySold comps — $/sqft
last 12 mo · ≤1 miLoading sold comps…