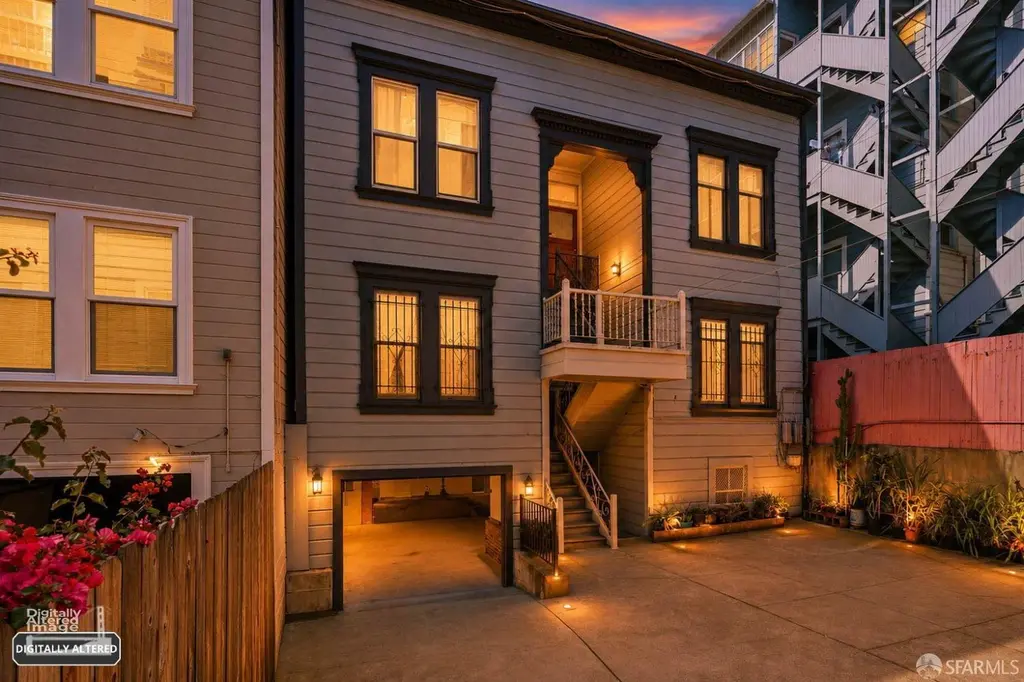
881 Vallejo St Unit A · San Francisco, CA
Flood risk 1/10 · Minimal
- FEMA flood zone
- X (unshaded)
- Chance of flooding over 30 yrs
- 0.0%
- Est. flood insurance / yr
- $507 – $1,088
Fire risk 1/10 · Minimal
- Est. fire insurance / yr
- $659 – $1,223
Heat risk 3/10 · Minor
- Hot days now (above 79°F)
- 8 days/yr
- Hot days in 30 yrs
- 17 days/yr
Wind risk 1/10 · Minimal
- Chance of severe wind over 30 yrs
- —
Air-quality risk 8/10 · Major
- Unhealthy air days now
- 15 days/yr
- Unhealthy air days in 30 yrs
- 15 days/yr
Risk factors via First Street. Map © Google.
Why this score? — see what drove the C- grade
The composite is a weighted blend of 9 inputs, each scored 0–100. Each bar is that input's sub-score; the figure is the points it added to the 100-point composite (weight × sub-score).
- ARV discount +13.4/15.0
- Cash flow +8.5/30.0
- Appreciation +8.2/10.0
- Rent growth +5.0/5.0
- Schools +5.0/10.0
- Livability +3.8/5.0
- 1% rule +2.6/10.0
- Condition / age +2.5/5.0
- DSCR +2.3/10.0
$699,000
🖨 Deal sheet (PDF) 📄 Offer letter ✓ Due diligence
Listing remarks
Irresistible Sunlit TIC in the Heart of Iconic San Francisco Chinatown! Step into your dream city retreat! A stylish, sun-drenched TIC just steps from legendary Stockton Street! Live above the energy of Chinatown while surrounded by tranquility, walk to everything, and enjoy the best of San Francisco at your doorstep. In this boutique seven-unit building, homes are rarely available. Enjoy a close-knit, welcoming community and the pride of true San Francisco ownership. Step inside to sunlit bedrooms, an inviting bath, and an airy living space, perfect for relaxing! Move right in and enjoy the blend of San Francisco character with stylish upgrades, ultra-low maintenance, a defined cost-sh
Key facts
- Zero hoa fees
- Major transit line
- 4,774 sq ft lot
Tags
Property features AI
Finance
- HOA & community: Part of a 6-unit community; Has homeowners association (no association fee reported)
Exterior
- Parking: Attached garage (1 parking space); Independent parking; Other parking options
- Utilities: Lot size approximately 4,774 sq ft
- Home design: Residential Tenancy in Common
- Construction: Year built not specified
- Exterior features: Ground-level entry
Interior
- Bedrooms: 2 bedrooms
- Bathrooms: 1 full bathroom
- Interior features: TIC agreement in place
Neighborhood map
What this means for you Summary
Snapshot
- This is a 2-bed/1.0-bath single-family listed at $699k.
Deal economics
- At list price, monthly cash flow is $-613 ($-7k/yr) — negative.
- To cash-flow at today's rent, offer at most $610k (12.7% below list).
- To meet the 1% rule (rent ≥ 1% of price), the offer needs to be $534k (23.6% below list).
- Recommended offer: $534k (23.6% below list) — sets the bar for 1% rule.
- Cap rate 5.2% vs local median 2.1% in San Francisco — top-decile yield for the area; either an underpriced asset or a hidden risk that comps aren't pricing in. Stress-test before assuming the spread holds.
Location & tenants
- Location reads 76/100 on livability (#90 in CA, #3,143 nationally) — a middle-class / working-renter tenant base. Strengths: amenities A+, commute A+, employment A+; Watch: crime F, cost of living F.
- San Francisco Unified (urban): math 50% / reading 56% proficiency, ranked #322 of 1,400 in CA (top 23%) — acceptable for families but not a draw, mixed tenant base, ~2y average lease.
- Market conditions: Rents rising fast (+16.9%/yr); 60 active listings in the ZIP; 40 comparable units currently listed for rent nearby; rentals at typical pace (median 15d on market — plan ~3-4 weeks tenant-placement turnaround); solid renter incomes; 750 units permitted in San Francisco County in 2024 (688 in 5+ unit buildings).
- At $5,338/mo this rent would consume 73% of the median local household income ($87k/yr) (locally 2027% of renters already pay >50% of income on rent) — very limited rent-growth headroom before tenants either downsize or default.
Forward outlook
- In year one you build about $50k of equity ($5k loan paydown + $45k appreciation (6.4% local appreciation)).
- San Francisco County population projected at +39% by 2050 — long-run rental-demand tailwind backs the buy-and-hold thesis.
- By year 2, paydown + projected appreciation supports a ~$80k cash-out refi (75% LTV) — recoverable capital for the next deal without selling this one.
Negotiation context
- It's been on market 37 days — a 3% lower offer ($678k) is reasonable based on typical stale-listing flexibility.
Questions for the listing agent
- What do current leases actually rent for vs. the listed asking? Can we see a recent rent roll and the last 12 months of T-12 income?
- It's been on market 37 days. Have you received any prior offers? Is the seller open to a 24% concession, seller financing, or rate buy-down credit?
- Is there a deadline driving the sale (1031 exchange, divorce, estate, relocation)? That informs how much negotiation room exists.
- Schools are B-rated — typically a magnet for longer-tenancy family renters. What's the average tenant stay here, and is there a school-zone premium baked into asking?
- Crime grade is F in this area — have there been break-ins, vandalism, or insurance claims at this property in the last 3 years? What carrier currently insures it and at what premium?
- What's the average days-on-market for RENTAL listings here right now (not sales)? A rising rental-DOM trend means longer vacancies and softer asking-rent achievability than the comps imply.
- What's the recent tenant-quality profile in this submarket — average credit score on applications, eviction rate, late-payment / NSF rate, and stable-employment percentage? A property-management company in the area should have these aggregated.
- How much new for-sale + rental construction is in the pipeline within 1–3 miles? Heavy new supply typically softens prices + rents 12–24 months out; constrained supply supports both.
Investment metrics
- 1% rule
- 0.76% ✗
- Cap rate
- 5.24%
- Cash-on-cash
- -3.76%
- DSCR
- 0.83
- GRM
- 10.9
CMA / ARV
- ARV (median comp)
- $805,056
- List price
- $699,000
- Delta
- -13.17%
- Verdict
- UNDERPRICED
- Comps
- 20 within 1.0 mi
Show comp detail 12 sales within ~0.75 mi
| Address | Dist | Beds/Ba | Sqft | Sold | Price | $/sf | Match |
|---|---|---|---|---|---|---|---|
| 1250 Vallejo St #2 | 0.35mi | 2/1.0 | 782 (+3%) | 11mo | $820,000 | $1,049 | 70 |
| 375 Green St | 0.36mi | 1/1.0 (-1) | 745 (-2%) | 6mo | $660,000 | $886 | 69 |
| 1530 Jones St #4 | 0.25mi | 1/1.0 (-1) | 804 (+6%) | 11mo | $730,000 | $908 | 65 |
| 1449 Hyde St #3 | 0.45mi | 2/1.0 | 821 (+8%) | 5mo | $760,000 | $926 | 61 |
| 1449 Hyde St #5 | 0.45mi | 2/1.0 | 821 (+8%) | 6mo | $775,000 | $944 | 60 |
| 1754 Larkin St #5 | 0.50mi | 1/1.0 (-1) | 715 (-6%) | 8mo | $840,000 | $1,175 | 55 |
| 1250 Vallejo St #8 | 0.35mi | 2/1.0 | 854 (+12%) | 10mo | $750,000 | $878 | 55 |
| 1324 California St Unit A | 0.53mi | 2/1.0 | 809 (+6%) | 12mo | $649,000 | $802 | 55 |
| 1133-b Filbert St | 0.37mi | 1/1.0 (-1) | 828 (+9%) | 11mo | $480,000 | $580 | 54 |
| 1449 Hyde St #2 | 0.45mi | 1/1.0 (-1) | 675 (-11%) | 5mo | $650,000 | $963 | 52 |
| 1449 Hyde St #4 | 0.45mi | 1/1.0 (-1) | 675 (-11%) | 5mo | $700,000 | $1,037 | 51 |
| 1624 Vallejo St #2 | 0.72mi | 1/1.0 (-1) | 654 (-14%) | 11mo | $549,000 | $839 | 29 |
Match score weights: distance 35% · size 25% · config 20% · recency 20%. Top-matched comps best support the ARV.
Projected returns pro-forma
6.44% appreciation · 8.0% rent growth · sell at horizon
- IRR
- 15.3%
- Equity multiple
- 2.07×
- Total profit
- $209,455
- Equity at exit
- $459,013
- IRR
- 16.9%
- Equity multiple
- 4.64×
- Total profit
- $712,455
- Equity at exit
- $849,858
Cash invested: $195,720 (down + closing). Projections, not guarantees.
Landlord ↔ Tenant lean methodology
- Overall (CITY)
- 0 Strongly Tenant-Friendly
- State California
- 18 Strongly Tenant-Friendly · D+13
- County
- — inherits STATE
- City San Francisco
- 0 Strongly Tenant-Friendly · D+57
ZIP-level market 94133
- Home prices YoY
- 4.0%
- Rents YoY
- 16.9%
- Active inventory
- 60
- Price-to-rent
- 10.9×
Monthly cashflow live
- Estimated rent
- $5,338 high interval (Pro) →
- Mortgage (P&I)
- −$3,666
- Tax est. 1.5%
- −$874 /mo · $10,485/yr
- Insurance
- −$291
- HOA
- −$0
- Vacancy / Maint / Mgmt
- −$1,121
- Net cashflow
- $-613
Break-even live
Sensitivity live
| Price | -10% $-130 | -5% $-372 | +0% $-613 | +5% $-855 | +10% $-1,097 |
|---|---|---|---|---|---|
| Rent | -10% $-1,035 | -5% $-824 | +0% $-613 | +5% $-403 | +10% $-192 |
| Rate | -1.0pp $-261 | -0.5pp $-436 | base $-613 | +0.5pp $-795 | +1.0pp $-979 |
UW: 25.0% down · 7.5% · 30yr · 1.5% tax · 5.0% vac · 8.0% maint · 8.0% mgmt
Financing live
Cash to close
- Down payment
- $174,750
- Closing costs
- $20,970
- Reserves months
- —
- Total cash needed
- —
Loan-product check · same deal, 3 products live
Conventional
25% down · 7.5% · 30yr
- Down + closing
- —
- Monthly P&I
- —
- Monthly cashflow
- —
- DSCR
- —
- Eligible?
- —
Personal DTI + credit; lowest rate.
DSCR
20% down · 8.5% · 30yr
- Down + closing
- —
- Monthly P&I
- —
- Monthly cashflow
- —
- DSCR
- —
- Eligible?
- —
No personal income docs; deal must DSCR.
Hard money
10% down · 12.0% · 12mo
- Down + closing
- —
- Monthly P&I
- —
- Monthly cashflow
- —
- DSCR
- —
- Eligible?
- —
Short-term bridge; refi at stabilization.
Rent comps 40 comps
| Address | Beds | Baths | Sqft | Rent | $/sqft | DOM | Units | Dist |
|---|---|---|---|---|---|---|---|---|
| 1425 Taylor St San Francisco, CA | 1.0 | 1.0 | 554 | $4,845 | $8.75 | 25d | 1 | 0.19mi |
| 959-961 Union St Unit 02 San Francisco, CA | 1.0 | 1.0 | 650 | $3,600 | $5.54 | 4d | 1 | 0.20mi |
| 770 Filbert St Unit 3 San Francisco, CA | 2.0 | 1.0 | 1050 | $5,190 | $4.94 | 44d | 1 | 0.22mi |
| 1212 Pacific Ave Unit 3 San Francisco, CA | 3.0 | 2.0 | 1000 | $5,100 | $5.10 | 5d | 1 | 0.23mi |
| 1808 Leavenworth St San Francisco, CA | 3.0 | 1.0 | 1100 | $6,475 | $5.89 | 44d | 1 | 0.27mi |
| 1401 Jones St San Francisco, CA | 1.0 | 1.0 | 550 | $5,500 | $10.00 | 8d | 1 | 0.30mi |
| 1310 Jones St San Francisco, CA | 2.0 | 2.0 | 1367 | $10,250 | $7.50 | 4d | 4 | 0.34mi |
| 1224 Sacramento St Unit 1569483P San Francisco, CA | 1.0 | 1.0 | 893 | $7,512 | $8.41 | 5d | 1 | 0.37mi |
| 1221 Jones St San Francisco, CA | 1.0 | 1.0 | 650 | $7,000 | $10.77 | 13d | 1 | 0.39mi |
| 1450 Washington St Unit 1450-07 San Francisco, CA | 2.0 | 1.0 | 818 | $6,500 | $7.95 | 11d | 1 | 0.40mi |
| 600 Chestnut St #301 San Francisco, CA | 2.0 | 2.0 | 1098 | $5,600 | $5.10 | 44d | 1 | 0.42mi |
| 650 Chestnut St #104 San Francisco, CA | 2.0 | 2.0 | 1080 | $6,500 | $6.02 | 8d | 1 | 0.42mi |
| 1140 Greenwich St Unit 301 San Francisco, CA | 1.0 | 1.0 | 1100 | $3,500 | $3.18 | 44d | 1 | 0.43mi |
| 71 Water St Unit 101 San Francisco, CA | 2.0 | 1.0 | 738 | $5,850 | $7.93 | 44d | 1 | 0.45mi |
| 71 Water St Unit 401 San Francisco, CA | 2.0 | 1.0 | 763 | $6,295 | $8.25 | 44d | 1 | 0.45mi |
| 71 Water St Unit 301 San Francisco, CA | 2.0 | 1.0 | 763 | $5,950 | $7.80 | 44d | 1 | 0.45mi |
| 1142-1146 Montgomery St Unit 1142-A San Francisco, CA | 1.0 | 1.0 | 709 | $4,995 | $7.05 | 25d | 1 | 0.45mi |
| 1557 Washington St San Francisco, CA | 1.0 | 1.0 | 600 | $3,795 | $6.33 | 25d | 1 | 0.48mi |
| 2233 Larkin St San Francisco, CA | 2.0 | 1.0 | 1100 | $6,200 | $5.64 | 3d | 1 | 0.49mi |
| 33 Vandewater St #103 San Francisco, CA | 2.0 | 2.0 | 950 | $6,900 | $7.26 | 19d | 1 | 0.50mi |
| 903 Pine St San Francisco, CA | 1.0 | 1.0 | 757 | $4,495 | $5.94 | 44d | 1 | 0.51mi |
| 240 Lombard St #1921 San Francisco, CA | 1.0 | 1.0 | 562 | $5,140 | $9.15 | 2d | 2 | 0.54mi |
| 540 Stockton St Apt 8 San Francisco, CA | 2.0 | 1.0 | 725 | $5,370 | $7.41 | 3d | 1 | 0.55mi |
| 800 Bush St San Francisco, CA | 2.0 | 1.0 | 1020 | $4,650 | $4.56 | 44d | 1 | 0.55mi |
| 240 Lombard St #832 San Francisco, CA | 1.0 | 1.0 | 597 | $5,950 | $9.97 | 44d | 1 | 0.56mi |
| 2211 Stockton St San Francisco, CA | 2.0 | 1.0–2.0 | 647 | $3,500 | $5.41 | 44d | 1 | 0.58mi |
| 737 Bush St San Francisco, CA | 1.0 | 1.0 | 750 | $2,595 | $3.46 | 15d | 1 | 0.58mi |
| 1024 Bush St San Francisco, CA | 3.0 | 2.5 | 900 | $4,750 | $5.28 | 44d | 1 | 0.59mi |
| 1472 Filbert St San Francisco, CA | 2.0 | 1.0 | 941 | $7,895 | $8.39 | 12d | 1 | 0.64mi |
| 1305 Lombard St San Francisco, CA | 2.0 | 2.0 | 1050 | $8,995 | $8.57 | 13d | 1 | 0.65mi |
| 845 Sutter St San Francisco, CA | 1.0 | 1.0 | 700 | $2,895 | $4.14 | 15d | 1 | 0.68mi |
| 965 Sutter St San Francisco, CA | 2.0 | 1.0–2.0 | 618 | $3,770 | $6.10 | 3d | 1 | 0.72mi |
| 1690 Broadway San Francisco, CA | 1.0–2.0 | 1.0 | 761 | $6,995 | $9.19 | 8d | 2 | 0.72mi |
| 725 Leavenworth St Unit 5 San Francisco, CA | 2.0 | 2.0 | 742 | $4,600 | $6.20 | 15d | 1 | 0.73mi |
| 1755 Van Ness Ave San Francisco, CA | 1.0 | 1.0 | 947 | $5,195 | $5.49 | 14d | 1 | 0.74mi |
| 1755 Van Ness Ave San Francisco, CA | 1.0 | 1.0 | 884 | $5,095 | $5.76 | 4d | 1 | 0.74mi |
| 737 Post St San Francisco, CA | 2.0 | 1.0–2.0 | 515 | $4,955 | $9.61 | 2d | 11 | 0.74mi |
| 1735 Van Ness Ave San Francisco, CA | 2.0 | 1.0 | 1064 | $12,225 | $11.49 | 8d | 2 | 0.74mi |
| 1080 Sutter St San Francisco, CA | 2.0 | 1.0 | 750 | $4,150 | $5.53 | 44d | 1 | 0.75mi |
| 81 Frank Norris St San Francisco, CA | 1.0 | 1.0 | 620 | $1,700 | $2.74 | 14d | 1 | 0.76mi |
Listing history 15 events
-
2026-06-18days on market $699,000 Active 37 DOM
-
2026-06-17days on market $699,000 Active 36 DOM
-
2026-06-16days on market $699,000 Active 35 DOM
-
2026-06-15days on market $699,000 Active 34 DOM
-
2026-06-13days on market $699,000 Active 32 DOM
-
2026-06-13days on market $699,000 Active 31 DOM
-
2026-06-09days on market $699,000 Active 28 DOM
-
2026-06-08days on market $699,000 Active 27 DOM
-
2026-06-07days on market $699,000 Active 26 DOM
-
2026-06-04days on market $699,000 Active 23 DOM
-
2026-06-03days on market $699,000 Active 22 DOM
-
2026-06-02days on market $699,000 Active 21 DOM
-
2026-06-01days on market $699,000 Active 20 DOM
-
2026-05-31days on market $699,000 Active 19 DOM
-
2026-05-12$699,000 Active 1222-char remark
ⓘ Source: listings_history table (triggers on properties + properties_extension) + one-shot
backfill from property_details.listing_events for pre-trigger history.
Climate risk First Street
- Flood 1/10 Low FEMA zone X (unshaded) · 0% chance over 30 yrs
- Wildfire 1/10 Low
- Heat 3/10 Moderate 8 d/yr ≥79°F today · 17 d/yr by 30 yrs out
- Wind 1/10 Low
- Air quality 8/10 Severe 15 unhealthy d/yr today · 15 by 30 yrs out
Nearby sold comps map
Loading sold comps map…
Walkable amenities ~0.75 mi
Loading nearby amenities…
Taxation est. · year 1
- Rental income
- $64,058
- − Mortgage interest
- −$39,155
- − Property taxes
- −$10,485
- − Insurance
- −$3,495
- − Repairs & maintenance
- −$5,125
- − Management
- −$5,125
- − Depreciation
- −$20,335
- Taxable loss
- −$19,660
- Est. tax savings @ 24.0%
- +$4,718
- After-tax cash flow
- $-2,643/yr
For passive investors: Depreciation is non-cash, so a rental often shows a tax loss while cash-flowing — sheltering income. Rental losses are passive: they offset passive income freely, and up to $25,000/yr can offset ordinary (W-2) income if you actively participate and your MAGI is under $100k (phasing out to $0 by $150k); unused losses carry forward. On sale, claimed depreciation is recaptured at up to 25%, and gains may owe capital-gains tax (a 1031 exchange can defer both). Figures are a year-1 estimate at your 24.0% rate — not tax advice; consult a CPA.
Schools (NCES district)
- District
- San Francisco Unified
- NCES district ID
- 0634410
- Math proficiency
- 50% ▬ 0.00%
- Reading proficiency
- 56% ▲ 1.00%
- Median HH income
- $81,249
- Composite
- 50.14/100
- National rank
- #4088
- State rank
- #322 of 1400 in CA
Livability — San Francisco
- Score
- 76/100
- State rank
- #90
- US rank
- #3143
Category grades
Schools grade is shown separately in the Schools card above.
Census & demographics
- Census place
- San Francisco, CA
- County
- San Francisco County · 827,552 people
- City population
- 827,552
- Metro
- San Francisco-Oakland-Berkeley, CA
- Population (ZIP)
- 23,804
- Household income
- $87,191
- Rent vs Own
- Severe rent burden
- 2027.0
Population outlook (San Francisco County) Hauer SSP2
- Today (2025)
- 1,030,936 people
- By 2030
- 1,110,409 · +7.7%
- By 2040
- 1,270,010 · +23.2%
- By 2050
- 1,435,001 · +39.2%
- By 2075
- 1,779,074 · +72.6%
- By 2100
- 1,966,767 · +90.8%
Race, ethnicity, and origin ACS 2023
- Neighborhood character
- Diverse neighborhood (Simpson 0.65)
- Race & ethnicity
- Asian 48% White 34% Hispanic / Latino 11% Two or more races 9% Black 3%
- Hispanic origin (detail)
- Mexican 5%
- Common ancestry
- Romanian 3% Slovak 2% Lithuanian 2%
- Foreign-born
- 40% · China, Canada, South Korea
- Languages at home
- 53% English-only · Chinese 34% Spanish 5% Other Indo-European 3%
Political lean MEDSL · San Francisco
- 2024 margin
- Solid D (+64.8) · D 80.3% · R 15.5% · Other 4.1%
- 2008→2024 swing
- -5.7pp toward R · 2008: 70.5pp · 2024: 64.8pp
- All cycles
- 2024: D+64.8 2020: D+72.5 2016: D+76.1 2012: D+70.2 2008: D+70.5
Not yet ingested
- Civics
- —
Market trends
- HPI YoY
- ▲ 6.44%
- Current HPI
- 168.565
- Rent YoY
- ▲ 16.95%
- Metro
- San Francisco-Oakland-Berkeley, CA
- State GDP YoY
- ▲ 3.21%
- F500 in state
- 116
Industry mix (Fortune 500 HQ in CA)
| Industry | F500 HQs | Revenue |
|---|---|---|
| Technology | 27 | $1,492B |
|
||
| Financial Services | 3 | $174B |
|
||
| Retail | 3 | $44B |
|
||
| Insurance | 3 | $26B |
|
||
| Media / Entertainment | 2 | $115B |
|
||
| Pharmaceuticals / Biotech | 2 | $62B |
|
||
Price history
1 event — show timeline
- 2026-05-12 Listed $699,000 San Francisco MLS
Cash-flow waterfall
monthlySold comps — $/sqft
last 12 mo · ≤1 miLoading sold comps…