100 Rogers Ave #101 · Westhampton Beach, NY
Flood risk No data
- FEMA flood zone
- —
- Chance of flooding over 30 yrs
- —
- Est. flood insurance / yr
- —
Fire risk No data
- Est. fire insurance / yr
- —
Heat risk No data
- Hot days now (above threshold)
- —
- Hot days in 30 yrs
- —
Wind risk No data
- Chance of severe wind over 30 yrs
- —
Air-quality risk No data
- Unhealthy air days now
- —
- Unhealthy air days in 30 yrs
- —
Risk factors via First Street. Map © Google.
Why this score? — see what drove the B grade
The composite is a weighted blend of 9 inputs, each scored 0–100. Each bar is that input's sub-score; the figure is the points it added to the 100-point composite (weight × sub-score).
- Cash flow +26.0/30.0
- Appreciation +10.0/10.0
- DSCR +8.7/10.0
- 1% rule +7.8/10.0
- ARV discount +7.5/15.0
- Schools +6.6/10.0
- Livability +3.2/5.0
- Rent growth +2.5/5.0
- Condition / age +2.5/5.0
$1,190,000
🖨 Deal sheet 📄 Offer letter ✓ Due diligence
Listing remarks
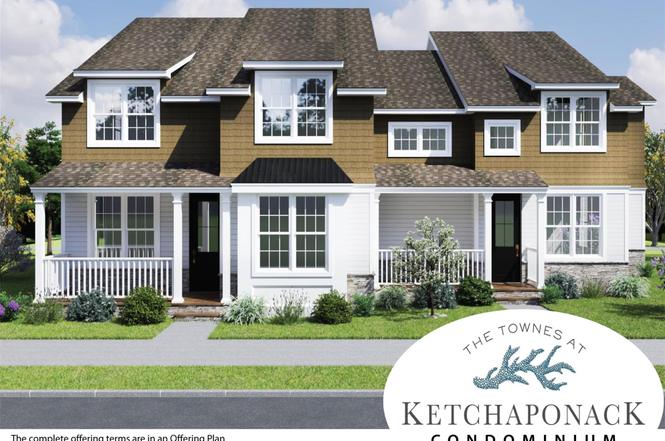
Welcome to The Townes at Ketchaponack Condominiums in Westhampton Beach, a thoughtfully designed townhome/condominium community offering luxury and convenience and the best the East End of Long Island has to offer. Enjoy Westhampton Beach, with its newly renovated Main Street Business District boasting an array of restaurants both upscale and casual, shops, theaters, nearby golf courses, fishing, tennis clubs and the best oceanfront beaches including the Village's own private Rogers Beach. The community features thirty-seven spacious townhomes with full basement, attached garage, screened porch, a clubhouse, complete with fitness facility, outdoor swimming pool and pickleball courts - optio
Key facts
- Clubhouse
- Attached garage
- Private rogers beach
Tags
Neighborhood map
What this means for you Summary
Snapshot
- This is a 2-bed/2.5-bath condo listed at $1.19M.
Deal economics
- At list price, monthly cash flow is $3k ($36k/yr) — positive.
- The deal already cash-flows at list — no discount required.
- Meets the 1% rule at list price ($15k rent vs $1.19M).
- Recommended offer: $1.17M (1.5% below list) — sets the bar for market timing.
Location & tenants
- Location reads 64/100 on livability (#740 in NY) — a middle-class / working-renter tenant base. Strengths: crime A+, employment A+; Watch: amenities F, commute F, cost of living F.
- Westhampton Beach Union Free School District (suburban): math 72% / reading 75% proficiency, ranked #81 of 590 in NY (top 14%) — strong family-tenant draw, lease renewals of 3-5y typical.
- Zoned schools: Westhampton Beach Elementary School (math 67% / reading 67%, grade B+, #525 of 2,108 statewide, top 27%, 356 students, 43% FRL); Westhampton Middle School (math 61% / reading 63%, grade B+, #136 of 729 statewide, top 20%, 434 students, 26% FRL); Westhampton Beach Senior High School (math 90% / reading 96%, grade A+, #147 of 1,100 statewide, top 14%, 964 students, 24% FRL).
- Market conditions: 112 active listings in the ZIP; 6 comparable units currently listed for rent nearby; rentals lingering (median 44d on market — plan ~5-8 weeks vacancy on turnover, expect pricing pressure); 50% of comp listings sitting > 30 days — soft ceiling on asking rent; high-income renter base; 1,366 units permitted in Suffolk County in 2024 (216 in 5+ unit buildings).
- At $15,264/mo this rent would consume 146% of the median local household income ($125k/yr) (locally 43% of renters already pay >50% of income on rent) — very limited rent-growth headroom before tenants either downsize or default.
Forward outlook
- In year one you build about $127k of equity ($8k loan paydown + $119k appreciation (10.0% local appreciation)).
- Suffolk County population projected to shrink 5% by 2050 — rents likely to lag national; underwrite the cash flow, not the appreciation.
- At projected returns (10.0% appreciation + 3.0% rent growth), your $333k cash investment doubles in ~2 years — after that, you're playing with house money.
- By year 2, paydown + projected appreciation supports a ~$205k cash-out refi (75% LTV) — recoverable capital for the next deal without selling this one.
Negotiation context
- It's been on market 19 days — a 2% lower offer ($1.17M) is reasonable based on typical stale-listing flexibility.
Questions for the listing agent
- What does the HOA fee cover, when was the last increase, and are there any pending special assessments or reserve-fund shortfalls?
- Any open or pending special assessments — roof, HVAC, plumbing, elevator, façade? What's the per-unit balance and payoff schedule, and is the seller paying it off at close or rolling it to the buyer?
- Is there a deadline driving the sale (1031 exchange, divorce, estate, relocation)? That informs how much negotiation room exists.
- Schools are A-rated — typically a magnet for longer-tenancy family renters. What's the average tenant stay here, and is there a school-zone premium baked into asking?
- What's the average days-on-market for RENTAL listings here right now (not sales)? A rising rental-DOM trend means longer vacancies and softer asking-rent achievability than the comps imply.
- What's the recent tenant-quality profile in this submarket — average credit score on applications, eviction rate, late-payment / NSF rate, and stable-employment percentage? A property-management company in the area should have these aggregated.
- How much new apartment / multifamily construction is in the pipeline within 1–3 miles? Heavy new supply (>2% of stock underway) typically softens rents 12–24 months out; light construction supports rent growth.
Investment metrics
- 1% rule
- 1.28% ✓
- Cap rate
- 9.28%
- Cash-on-cash
- 10.66%
- DSCR
- 1.47
- GRM
- 6.5
CMA / ARV
No comps found within radius.
Projected returns pro-forma
10.0% appreciation · 3.0% rent growth · sell at horizon
- IRR
- 32.1%
- Equity multiple
- 3.51×
- Total profit
- $837,394
- Equity at exit
- $1,072,046
- IRR
- 27.7%
- Equity multiple
- 7.96×
- Total profit
- $2,319,264
- Equity at exit
- $2,311,908
Cash invested: $333,200 (down + closing). Projections, not guarantees.
Landlord ↔ Tenant lean methodology
- Overall (STATE)
- 15 Strongly Tenant-Friendly
- State New York
- 15 Strongly Tenant-Friendly · D+10
- County
- — inherits STATE
- City
- — inherits STATE
ZIP-level market 11978
- Home prices YoY
- 2.9%
- Active inventory
- 112
- Price-to-rent
- 6.5×
Monthly cashflow live
- Estimated rent
- $15,264 medium interval (Pro) →
- Mortgage (P&I)
- −$6,240
- Tax est. 1.5%
- −$1,488 /mo · $17,850/yr
- Insurance
- −$496
- HOA
- −$875
- Vacancy / Maint / Mgmt
- −$3,205
- Net cashflow
- $2,960
Break-even live
UW: 25.0% down · 7.5% · 30yr · 1.5% tax · 5.0% vac · 8.0% maint · 8.0% mgmt
Financing live
Cash to close
- Down payment
- $297,500
- Closing costs
- $35,700
- Reserves months
- —
- Total cash needed
- —
Loan-product check · same deal, 3 products live
Conventional
25% down · 7.5% · 30yr
- Down + closing
- —
- Monthly P&I
- —
- Monthly cashflow
- —
- DSCR
- —
- Eligible?
- —
Personal DTI + credit; lowest rate.
DSCR
20% down · 8.5% · 30yr
- Down + closing
- —
- Monthly P&I
- —
- Monthly cashflow
- —
- DSCR
- —
- Eligible?
- —
No personal income docs; deal must DSCR.
Hard money
10% down · 12.0% · 12mo
- Down + closing
- —
- Monthly P&I
- —
- Monthly cashflow
- —
- DSCR
- —
- Eligible?
- —
Short-term bridge; refi at stabilization.
Rent comps 6 comps
| Address | Beds | Baths | Sqft | Rent | $/sqft | DOM | Units | Dist |
|---|---|---|---|---|---|---|---|---|
| 15 Pin Oak Ln Westhampton Beach, NY | 3.0 | 3.0 | 2900 | $30,000 | $10.34 | 43d | 1 | 0.75mi |
| 35 Maple St Westhampton Beach, NY | 3.0 | 2.5 | 1696 | $28,000 | $16.51 | 43d | 1 | 0.86mi |
| 34 Montauk Hwy #12 Westhampton, NY | 2.0 | 3.0 | 1773 | $18,000 | $10.15 | 24d | 1 | 0.89mi |
| 31 Liberty St Westhampton Beach, NY | 3.0 | 1.5 | 2000 | $40,000 | $20.00 | 43d | 1 | 1.06mi |
| 19 Bishop Ave Westhampton, NY | 3.0 | 2.0 | 1514 | $15,000 | $9.91 | 19d | 1 | 1.34mi |
| 188 Main St Westhampton Beach, NY | 2.0 | 2.5 | 1400 | $5,000 | $3.57 | 22d | 1 | 1.35mi |
HOA detail condo
- Monthly dues
- $875 · $10,500/yr
- Likely covers
- pool
- Assessments
- None detected in remarks — confirm with the listing agent.
Listing history 2 events
-
2025-09-15status Pending
-
2025-08-27$1,190,000 Active
ⓘ Source: listings_history table (triggers on properties + properties_extension) + one-shot
backfill from property_details.listing_events for pre-trigger history.
Nearby sold comps map
Loading sold comps map…
Walkable amenities ~0.75 mi
Loading nearby amenities…
Taxation est. · year 1
- Rental income
- $183,171
- − Mortgage interest
- −$66,659
- − Property taxes
- −$17,850
- − Insurance
- −$5,950
- − Repairs & maintenance
- −$14,654
- − Management
- −$14,654
- − HOA
- −$10,500
- − Depreciation
- −$34,618
- Taxable income
- $18,287
- Est. tax owed @ 24.0%
- −$4,389
- After-tax cash flow
- $31,130/yr
For passive investors: Depreciation is non-cash, so a rental often shows a tax loss while cash-flowing — sheltering income. Rental losses are passive: they offset passive income freely, and up to $25,000/yr can offset ordinary (W-2) income if you actively participate and your MAGI is under $100k (phasing out to $0 by $150k); unused losses carry forward. On sale, claimed depreciation is recaptured at up to 25%, and gains may owe capital-gains tax (a 1031 exchange can defer both). Figures are a year-1 estimate at your 24.0% rate — not tax advice; consult a CPA.
Schools (NCES district)
- District
- Westhampton Beach Union Free School District
- NCES district ID
- 3631020
- Math proficiency
- 72% ▼ -5.00%
- Reading proficiency
- 75% ▲ 3.00%
- Median HH income
- $88,137
- Composite
- 65.91/100
- National rank
- #444
- State rank
- #81 of 590 in NY
Livability — Westhampton Beach
- Score
- 64/100
- State rank
- #740
- US rank
- #14093
Category grades
Schools grade is shown separately in the Schools card above.
Census & demographics
- Census place
- Westhampton Beach, NY
- County
- Suffolk County · 679,920 people
- Metro
- New York-Newark-Jersey City, NY-NJ-PA
- Population (ZIP)
- 4,705
- Household income
- $125,179
- Rent vs Own
- Severe rent burden
- 43.0
Population outlook (Suffolk County) Hauer SSP2
- Today (2025)
- 1,505,262 people
- By 2030
- 1,498,318 · -0.5%
- By 2040
- 1,471,101 · -2.3%
- By 2050
- 1,424,848 · -5.3%
- By 2075
- 1,337,157 · -11.2%
- By 2100
- 1,217,720 · -19.1%
Race, ethnicity, and origin ACS 2023
- Neighborhood character
- Predominantly White (72%)
- Race & ethnicity
- White 72% Two or more races 14% Hispanic / Latino 11% Black 6% Asian 2%
- Hispanic origin (detail)
- Puerto Rican 1%
- Common ancestry
- Romanian 7% Scotch-Irish 2% Italian 2%
- Foreign-born
- 14% · Canada, Jamaica, China
- Languages at home
- 84% English-only · Spanish 10% Other Indo-European 2% Russian/Polish/Slavic 1%
Political lean MEDSL · Suffolk
- 2024 margin
- Lean R (+10.0) · D 45.0% · R 55.0%
- 2008→2024 swing
- -16.0pp toward R · 2008: 6.0pp · 2024: -10.0pp
- All cycles
- 2024: R+10.0 2020: R+0.0 2016: R+8.2 2012: D+2.9 2008: D+6.0
Not yet ingested
- Civics
- —
Market trends
- HPI YoY
- ▲ 13.02%
- Current HPI
- 460.3964
- Rent YoY
- —
- Metro
- New York-Newark-Jersey City, NY-NJ-PA
- State GDP YoY
- ▲ 2.60%
- F500 in state
- 92
Industry mix (Fortune 500 HQ in NY)
| Industry | F500 HQs | Revenue |
|---|---|---|
| Financial Services | 10 | $950B |
|
||
| Consumer Goods | 9 | $162B |
|
||
| Insurance | 4 | $225B |
|
||
| Telecommunications | 2 | $144B |
|
||
| Pharmaceuticals | 2 | $112B |
|
||
| Media / Entertainment | 2 | $69B |
|
||
Price history
2 events — show timeline
- 2025-09-15 Pending — OneKey® MLS as Distributed by MLS Grid
- 2025-08-27 Listed $1,190,000 OneKey® MLS as Distributed by MLS Grid
Cash-flow waterfall
monthlySold comps — $/sqft
last 12 mo · ≤1 miLoading sold comps…