7452 Huckleberry Ln · Florin, CA
Flood risk 1/10 · Minimal
- FEMA flood zone
- X (shaded)
- Chance of flooding over 30 yrs
- 0.0%
- Est. flood insurance / yr
- $507 – $1,088
Fire risk 1/10 · Minimal
- Est. fire insurance / yr
- $659 – $1,223
Heat risk 7/10 · Major
- Hot days now (above 102°F)
- 6 days/yr
- Hot days in 30 yrs
- 13 days/yr
Wind risk 1/10 · Minimal
- Chance of severe wind over 30 yrs
- —
Air-quality risk 10/10 · Severe
- Unhealthy air days now
- 28 days/yr
- Unhealthy air days in 30 yrs
- 33 days/yr
Risk factors via First Street. Map © Google.
Why this score? — see what drove the C+ grade
The composite is a weighted blend of 9 inputs, each scored 0–100. Each bar is that input's sub-score; the figure is the points it added to the 100-point composite (weight × sub-score).
- Cash flow +30.0/30.0
- 1% rule +10.0/10.0
- DSCR +10.0/10.0
- Schools +4.1/10.0
- Livability +2.9/5.0
- Condition / age +2.5/5.0
- Rent growth +2.4/5.0
- Appreciation +1.3/10.0
- ARV discount +0.0/15.0
$69,500
🖨 Deal sheet 📄 Offer letter ✓ Due diligence
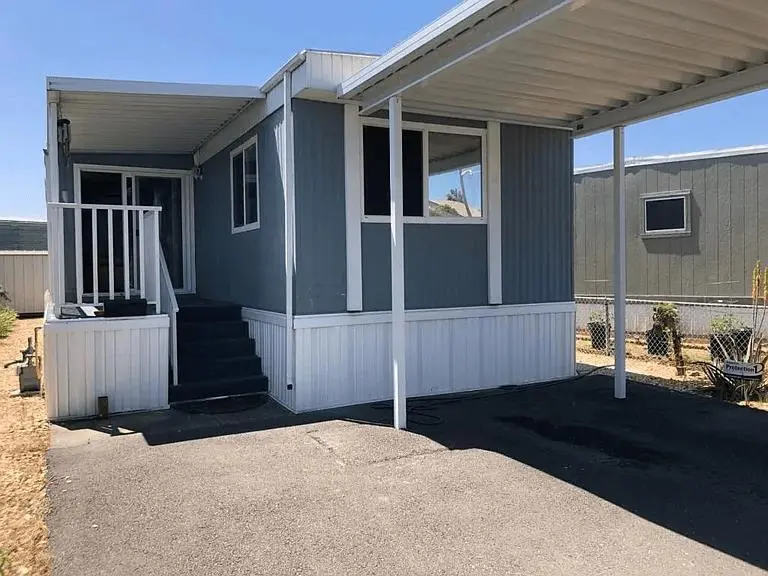
Listing remarks
Welcome to this charming 2-bedroom, 1.5-bath home located in a desirable 55+ gated community. Tucked away in the quiet back loop of Olympia Commons, this home offers added privacy and a peaceful setting on the back side of the park. Residents enjoy access to great amenities including a pool, spa, clubhouse, ping pong and pool tables, and a community BBQ areaall at an incredibly affordable price. A perfect opportunity for comfortable, low-maintenance living in a well-maintained community.
Key facts
- Gated community
- Community bbq area
- Great amenities
Tags
Property features AI
Finance
- Financial info: Land lease: No (listed land lease amount: $750)
- HOA & community: No homeowners association; Senior community
Exterior
- Parking: Attached, covered parking
- Utilities: Individual gas meter; Public sewer; Private water; Other electric
- Home design: Manufactured in park; Single wide
- Construction: Other roof; Skirt: other; Make: unknown
- Exterior features: Covered patio; Porch; Other lot features
Interior
- Kitchen: Breakfast area/room; Hood over range
- Bedrooms: 2 bedrooms
- Flooring: Carpet; Linoleum
- Bathrooms: 1 full bath; 1 partial bath; Tub
- Heating & cooling: Natural gas heating; Other heating; Room air cooling; Other cooling
- Interior features: Hood over range; Covered patio and porch; Cathedral/vaulted living room ceiling; Breakfast area/room; Formal dining area/room; Service animals allowed
- Laundry & utility: Laundry: unspecified/other
Neighborhood map
What this means for you Summary
Snapshot
- This is a 2-bed/1.5-bath manufactured listed at $70k.
Deal economics
- At list price, monthly cash flow is $1k ($12k/yr) — positive.
- The deal already cash-flows at list — no discount required.
- Meets the 1% rule at list price ($2k rent vs $70k).
- Recommended offer: $67k (3.0% below list) — sets the bar for market timing.
- Cap rate 24.1% vs local median 3.6% in Florin — top-decile yield for the area; either an underpriced asset or a hidden risk that comps aren't pricing in. Stress-test before assuming the spread holds.
Location & tenants
- Location reads 58/100 on livability (#673 in CA) — a working-class tenant base; expect higher turnover. Strengths: housing A; Watch: employment D, schools D-, crime F.
- Elk Grove Unified (suburban): math 40% / reading 51% proficiency, ranked #165 of 517 in CA (top 32%) — families likely to look elsewhere, expect single-tenant / working-renter base with shorter leases.
- Market conditions: Rents soft (-0.2%/yr); 212 active listings in the ZIP; 21 comparable units currently listed for rent nearby; rentals at typical pace (median 18d on market — plan ~3-4 weeks tenant-placement turnaround); solid renter incomes; 6,825 units permitted in Sacramento County in 2024 (1,752 in 5+ unit buildings).
Forward outlook
- Local home prices are declining (-3.0%/yr); year-one equity from $481 of loan paydown is wiped out by about $2k of value loss. Plan a longer hold.
- Sacramento County population projected at +17% by 2050 — long-run rental-demand tailwind backs the buy-and-hold thesis.
- At projected returns (-3.0% appreciation + 0.0% rent growth), your $19k cash investment doubles in ~2 years — after that, you're playing with house money.
Negotiation context
- It's been on market 53 days — a 3% lower offer ($67k) is reasonable based on typical stale-listing flexibility.
Risks & watch-outs
- Climate carrying-cost: extreme-heat days projected 6→13/yr by 2055 (HVAC capex compounding) — expect insurance premiums to compound above CPI over the hold.
Questions for the listing agent
- It's been on market 53 days. Have you received any prior offers? Is the seller open to a 3% concession, seller financing, or rate buy-down credit?
- Is there a deadline driving the sale (1031 exchange, divorce, estate, relocation)? That informs how much negotiation room exists.
- Schools are D-rated, which usually means shorter tenancies and higher turnover. Who's the typical renter profile here, and what's been the actual vacancy rate?
- Crime grade is F in this area — have there been break-ins, vandalism, or insurance claims at this property in the last 3 years? What carrier currently insures it and at what premium?
- What's the average days-on-market for RENTAL listings here right now (not sales)? A rising rental-DOM trend means longer vacancies and softer asking-rent achievability than the comps imply.
- What's the recent tenant-quality profile in this submarket — average credit score on applications, eviction rate, late-payment / NSF rate, and stable-employment percentage? A property-management company in the area should have these aggregated.
- How much new for-sale + rental construction is in the pipeline within 1–3 miles? Heavy new supply typically softens prices + rents 12–24 months out; constrained supply supports both.
Investment metrics
- 1% rule
- 2.76% ✓
- Cap rate
- 24.15%
- Cash-on-cash
- 63.76%
- DSCR
- 3.84
- GRM
- 3.0
CMA / ARV
- ARV (median comp)
- $47,000
- List price
- $69,500
- Delta
- 47.87%
- Verdict
- OVERPRICED
- Comps
- 5 within 1.0 mi
Show comp detail 3 sales within ~0.75 mi
| Address | Dist | Beds/Ba | Sqft | Sold | Price | $/sf | Match |
|---|---|---|---|---|---|---|---|
| 7552 Red Bud Ln | 0.05mi | 3/2.0 (+1) | 900 (+10%) | 2mo | $47,000 | $52 | 72 |
| 7557 Huckleberry #59 | 0.06mi | 1/1.0 (-1) | 720 (-12%) | 22mo | $70,000 | $97 | 52 |
| 7706 Whispering Palms Dr | 0.60mi | 2/2.0 | 720 (-12%) | 8mo | $58,000 | $81 | 44 |
Match score weights: distance 35% · size 25% · config 20% · recency 20%. Top-matched comps best support the ARV.
Projected returns pro-forma
-3.0% appreciation · 0.0% rent growth · sell at horizon
- IRR
- 59.4%
- Equity multiple
- 3.52×
- Total profit
- $49,007
- Equity at exit
- $10,363
- IRR
- 63.1%
- Equity multiple
- 6.44×
- Total profit
- $105,884
- Equity at exit
- $6,009
Cash invested: $19,460 (down + closing). Projections, not guarantees.
Landlord ↔ Tenant lean methodology
- Overall (STATE)
- 18 Strongly Tenant-Friendly
- State California
- 18 Strongly Tenant-Friendly · D+13
- County
- — inherits STATE
- City
- — inherits STATE
ZIP-level market 95828
- Home prices YoY
- -0.8%
- Rents YoY
- -0.2%
- Active inventory
- 212
- Price-to-rent
- 3.0×
Monthly cashflow live
- Estimated rent
- $1,917 high interval (Pro) →
- Mortgage (P&I)
- −$364
- Tax est. 1.5%
- −$87 /mo · $1,042/yr
- Insurance
- −$29
- HOA
- −$0
- Vacancy / Maint / Mgmt
- −$403
- Net cashflow
- $1,034
Break-even live
UW: 25.0% down · 7.5% · 30yr · 1.5% tax · 5.0% vac · 8.0% maint · 8.0% mgmt
Financing live
Cash to close
- Down payment
- $17,375
- Closing costs
- $2,085
- Reserves months
- —
- Total cash needed
- —
Loan-product check · same deal, 3 products live
Conventional
25% down · 7.5% · 30yr
- Down + closing
- —
- Monthly P&I
- —
- Monthly cashflow
- —
- DSCR
- —
- Eligible?
- —
Personal DTI + credit; lowest rate.
DSCR
20% down · 8.5% · 30yr
- Down + closing
- —
- Monthly P&I
- —
- Monthly cashflow
- —
- DSCR
- —
- Eligible?
- —
No personal income docs; deal must DSCR.
Hard money
10% down · 12.0% · 12mo
- Down + closing
- —
- Monthly P&I
- —
- Monthly cashflow
- —
- DSCR
- —
- Eligible?
- —
Short-term bridge; refi at stabilization.
Rent comps 21 comps
| Address | Beds | Baths | Sqft | Rent | $/sqft | DOM | Units | Dist |
|---|---|---|---|---|---|---|---|---|
| 7614 Par Pkwy Sacramento, CA | 2.0 | 1.0 | 850 | $1,750 | $2.06 | 43d | 1 | 0.21mi |
| 7639 Clover Woods Ct Sacramento, CA | 2.0 | 1.0 | 1032 | $1,895 | $1.84 | 43d | 1 | 0.33mi |
| 7575 Power Inn Rd Sacramento, CA | 1.0–2.0 | 1.0–2.0 | 729 | $1,950 | $2.67 | 2d | 5 | 0.53mi |
| 7733 Robinette Rd Sacramento, CA | 3.0 | 2.0 | 1120 | $2,150 | $1.92 | 43d | 1 | 0.59mi |
| 7351 Gigi Pl Unit 7353 Sacramento, CA | 2.0 | 1.0 | 1000 | $1,775 | $1.77 | 23d | 1 | 0.60mi |
| 7337 Power Inn Rd Sacramento, CA | 2.0 | 1.0 | 663 | $1,775 | $2.68 | 23d | 3 | 0.69mi |
| 6465 Village Center Dr Sacramento, CA | 1.0–2.0 | 1.0 | 629 | $1,670 | $2.65 | 2d | 9 | 0.87mi |
| 6901 Florin Rd Sacramento, CA | 2.0 | 1.0 | 752 | $1,648 | $2.19 | 7d | 4 | 0.94mi |
| 6633 Valley Hi Dr Sacramento, CA | 2.0 | 2.0 | 809 | $1,889 | $2.33 | 4d | 1 | 1.05mi |
| 7474 La Mancha Way Sacramento, CA | 1.0 | 1.0 | 676 | $1,550 | $2.29 | 7d | 2 | 1.08mi |
| 7283 Florin Mall Dr #14 Sacramento, CA | 2.0 | 2.0 | 902 | $1,675 | $1.86 | 43d | 1 | 1.10mi |
| 6808 Wyndham Dr Sacramento, CA | 2.0 | 1.0–2.0 | 742 | $2,165 | $2.92 | 2d | 7 | 1.11mi |
| 6921 Lewiston Way Sacramento, CA | 1.0 | 1.0 | 569 | $1,495 | $2.63 | 3d | 5 | 1.18mi |
| 7252 Florin Mall Dr Unit 7252 Sacramento, CA | 2.0 | 2.0 | 900 | $1,725 | $1.92 | 43d | 1 | 1.19mi |
| 5500 Mack Rd Sacramento, CA | 2.0 | 1.0–2.0 | 856 | $1,603 | $1.87 | 7d | 1 | 1.22mi |
| 7826 Center Pkwy Sacramento, CA | 1.0–2.0 | 1.0–2.0 | 737 | $1,795 | $2.43 | 43d | 1 | 1.31mi |
| 5152 Mack Rd Sacramento, CA | 1.0 | 1.0 | 597 | $1,603 | $2.69 | 4d | 1 | 1.43mi |
| 5152 Mack Rd Sacramento, CA | 2.0 | 2.0 | 801 | $1,891 | $2.36 | 20d | 1 | 1.43mi |
| 5152 Mack Rd Sacramento, CA | 1.0 | 1.0 | 597 | $1,525 | $2.55 | 23d | 1 | 1.43mi |
| 5152 Mack Rd Sacramento, CA | 2.0 | 2.0 | 801 | $1,731 | $2.16 | 17d | 1 | 1.43mi |
| 7874 Golden Field Way Sacramento, CA | 3.0 | 1.0 | 1014 | $2,100 | $2.07 | 15d | 1 | 1.49mi |
Listing history 14 events
-
2026-06-18days on market $69,500 Active 53 DOM
-
2026-06-17days on market $69,500 Active 52 DOM
-
2026-06-16days on market $69,500 Active 51 DOM
-
2026-06-15days on market $69,500 Active 50 DOM
-
2026-06-13days on market $69,500 Active 48 DOM
-
2026-06-13days on market $69,500 Active 47 DOM
-
2026-06-09days on market $69,500 Active 44 DOM
-
2026-06-08days on market $69,500 Active 43 DOM
-
2026-06-07days on market $69,500 Active 42 DOM
-
2026-06-05days on market $69,500 Active 39 DOM
-
2026-06-03days on market $69,500 Active 38 DOM
-
2026-06-02days on market $69,500 Active 37 DOM
-
2026-06-01days on market $69,500 Active 36 DOM
-
2026-05-31days on market $69,500 Active 35 DOM
ⓘ Source: listings_history table (triggers on properties + properties_extension) + one-shot
backfill from property_details.listing_events for pre-trigger history.
Climate risk First Street
- Flood 1/10 Low FEMA zone X (shaded) · 0% chance over 30 yrs
- Wildfire 1/10 Low
- Heat 7/10 Severe 6 d/yr ≥102°F today · 13 d/yr by 30 yrs out
- Wind 1/10 Low
- Air quality 10/10 Extreme 28 unhealthy d/yr today · 33 by 30 yrs out
Nearby sold comps map
Loading sold comps map…
Walkable amenities ~0.75 mi
Loading nearby amenities…
Taxation est. · year 1
- Rental income
- $23,002
- − Mortgage interest
- −$3,893
- − Property taxes
- −$1,042
- − Insurance
- −$348
- − Repairs & maintenance
- −$1,840
- − Management
- −$1,840
- − Depreciation
- −$2,022
- Taxable income
- $12,017
- Est. tax owed @ 24.0%
- −$2,884
- After-tax cash flow
- $9,524/yr
For passive investors: Depreciation is non-cash, so a rental often shows a tax loss while cash-flowing — sheltering income. Rental losses are passive: they offset passive income freely, and up to $25,000/yr can offset ordinary (W-2) income if you actively participate and your MAGI is under $100k (phasing out to $0 by $150k); unused losses carry forward. On sale, claimed depreciation is recaptured at up to 25%, and gains may owe capital-gains tax (a 1031 exchange can defer both). Figures are a year-1 estimate at your 24.0% rate — not tax advice; consult a CPA.
Schools (NCES district)
- District
- Elk Grove Unified
- NCES district ID
- 0612330
- Math proficiency
- 40% ▼ -5.00%
- Reading proficiency
- 51% ▼ -5.00%
- Median HH income
- $67,860
- Composite
- 40.72/100
- National rank
- #3658
- State rank
- #165 of 517 in CA
Livability — Florin
- Score
- 58/100
- State rank
- #673
- US rank
- #20705
Category grades
Schools grade is shown separately in the Schools card above.
Census & demographics
- Census place
- Florin, CA
- County
- Sacramento County · 1,539,646 people
- City population
- 60,532
- Metro
- Sacramento-Roseville-Folsom, CA
- Population (ZIP)
- 61,686
- Household income
- $81,778
- Rent vs Own
- Severe rent burden
- 1765.0
Population outlook (Sacramento County) Hauer SSP2
- Today (2025)
- 1,660,763 people
- By 2030
- 1,732,990 · +4.3%
- By 2040
- 1,855,755 · +11.7%
- By 2050
- 1,941,335 · +16.9%
- By 2075
- 2,046,162 · +23.2%
- By 2100
- 1,961,444 · +18.1%
Race, ethnicity, and origin ACS 2023
- Neighborhood character
- Highly diverse neighborhood (Simpson 0.75)
- Race & ethnicity
- Asian 37% Hispanic / Latino 26% White 16% Two or more races 12% Black 10% Pacific Islander 4%
- Hispanic origin (detail)
- Mexican 22%
- Common ancestry
- Italian 1% Russian 1% Portuguese 1%
- Foreign-born
- 35% · Vietnam, Canada, China
- Languages at home
- 47% English-only · Spanish 17% Other Asian/Pacific 13% Vietnamese 8%
Political lean MEDSL · Sacramento
- 2024 margin
- D (+19.7) · D 58.1% · R 38.4% · Other 3.5%
- 2008→2024 swing
- +0.7pp no change · 2008: 19.0pp · 2024: 19.7pp
- All cycles
- 2024: D+19.7 2020: D+25.3 2016: D+23.7 2012: D+16.3 2008: D+19.0
Not yet ingested
- Civics
- —
Market trends
- HPI YoY
- ▼ -7.49%
- Current HPI
- 962.47
- Rent YoY
- ▼ -0.24%
- Metro
- Sacramento-Roseville-Folsom, CA
- State GDP YoY
- ▲ 3.21%
- F500 in state
- 116
Industry mix (Fortune 500 HQ in CA)
| Industry | F500 HQs | Revenue |
|---|---|---|
| Technology | 27 | $1,492B |
|
||
| Financial Services | 3 | $174B |
|
||
| Retail | 3 | $44B |
|
||
| Insurance | 3 | $26B |
|
||
| Media / Entertainment | 2 | $115B |
|
||
| Pharmaceuticals / Biotech | 2 | $62B |
|
||
Cash-flow waterfall
monthlySold comps — $/sqft
last 12 mo · ≤1 miLoading sold comps…