55 Colonial Dr · Rancho Mirage, CA
Flood risk 1/10 · Minimal
- FEMA flood zone
- X (unshaded)
- Chance of flooding over 30 yrs
- 0.0%
- Est. flood insurance / yr
- $507 – $1,088
Fire risk 1/10 · Minimal
- Est. fire insurance / yr
- $659 – $1,223
Heat risk 9/10 · Severe
- Hot days now (above 114°F)
- 4 days/yr
- Hot days in 30 yrs
- 12 days/yr
Wind risk 1/10 · Minimal
- Chance of severe wind over 30 yrs
- —
Air-quality risk 4/10 · Minor
- Unhealthy air days now
- 5 days/yr
- Unhealthy air days in 30 yrs
- 7 days/yr
Risk factors via First Street. Map © Google.
Why this score? — see what drove the D- grade
The composite is a weighted blend of 9 inputs, each scored 0–100. Each bar is that input's sub-score; the figure is the points it added to the 100-point composite (weight × sub-score).
- ARV discount +14.6/15.0
- Cash flow +7.8/30.0
- 1% rule +3.7/10.0
- Rent growth +3.4/5.0
- Schools +2.7/10.0
- Livability +2.6/5.0
- Condition / age +2.5/5.0
- DSCR +1.9/10.0
- Appreciation +0.0/10.0
$575,000
🖨 Deal sheet (PDF) 📄 Offer letter ✓ Due diligence
Listing remarks MLS
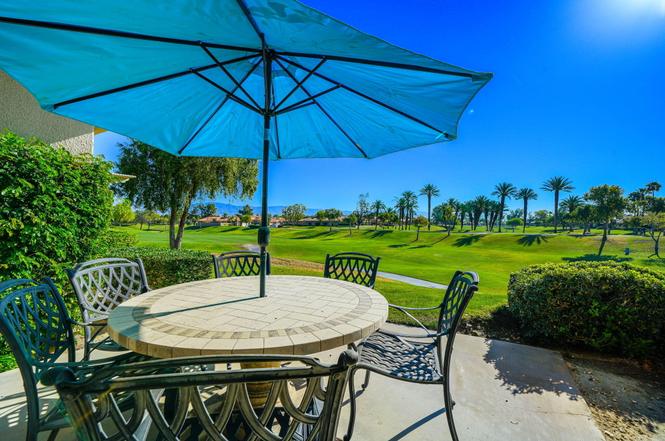
Located in Mission Hills Country Club's Deane Homes on fee land, this beautifully upgraded residence offers stunning fairway views of the 6th hole of the Pete Dye Resort Course. The home features hardwood flooring, wooden plantation shutters, and granite countertops throughout. Bathrooms are tastefully updated with granite finishes and frameless glass showers. Enjoy a private, thoughtfully designed courtyard with mature landscaping--perfect for relaxing or entertaining. Additional highlights include a new AC and heating system installed in October, plus a spacious three-car garage complete with abundant built-in storage and durable lava flow epoxy flooring.
Key facts
- Hardwood flooring
- Fairway views
- Mature landscaping
Tags
Neighborhood map
What this means for you Summary
Snapshot
- This is a 3-bed/2.0-bath condo listed at $575k.
Deal economics
- At list price, monthly cash flow is $-639 ($-8k/yr) — negative.
- To cash-flow at today's rent, offer at most $462k (19.6% below list).
- To meet the 1% rule (rent ≥ 1% of price), the offer needs to be $498k (13.4% below list).
- Recommended offer: $462k (19.6% below list) — sets the bar for cash-flow.
- Cap rate 5.0% vs local median 3.0% in Rancho Mirage — top-decile yield for the area; either an underpriced asset or a hidden risk that comps aren't pricing in. Stress-test before assuming the spread holds.
Location & tenants
- Location reads 51/100 on livability (#1,065 in CA) — a working-class tenant base; expect higher turnover. Strengths: employment A+; Watch: amenities F, commute F, cost of living F.
- Palm Springs Unified (suburban): math 21% / reading 42% proficiency, ranked #328 of 517 in CA (top 63%) — families likely to look elsewhere, expect single-tenant / working-renter base with shorter leases; 73% free/reduced lunch — lower-income household profile, screen leases tightly.
- Zoned schools: Rancho Mirage Elementary (309 students, 86% FRL); Nellie N. Coffman Middle (953 students, 98% FRL); Rancho Mirage High (math 15% / reading 38%, grade F, #804 of 1,170 statewide, top 69%, 1,491 students, 97% FRL) — zoned schools average 94% FRL vs 73% district-wide (20 pts higher); higher-poverty schools than district average — tighter screening recommended.
- Market conditions: Rents rising (+3.7%/yr); 532 active listings in the ZIP; 40 comparable units currently listed for rent nearby; rentals lingering (median 46d on market — plan ~5-8 weeks vacancy on turnover, expect pricing pressure); 65% of comp listings sitting > 30 days — soft ceiling on asking rent; solid renter incomes; 9,195 units permitted in Riverside County in 2024 (1,512 in 5+ unit buildings).
- At $4,982/mo this rent would consume 56% of the median local household income ($107k/yr) (locally 498% of renters already pay >50% of income on rent) — very limited rent-growth headroom before tenants either downsize or default.
Forward outlook
- Local home prices are declining (-3.0%/yr); year-one equity from $4k of loan paydown is wiped out by about $17k of value loss. Plan a longer hold.
- Riverside County population projected at +22% by 2050 — long-run rental-demand tailwind backs the buy-and-hold thesis.
Negotiation context
- It's been on market 76 days — a 6% lower offer ($540k) is reasonable based on typical stale-listing flexibility.
- 2 sale attempts since 27y ago with the ask held roughly flat each time — persistent listings suggest the price (not the market) is what's stuck; bring a comps-based counter.
- Current owner paid $246k; list at $575k implies a 134% gain — meaningful room to come down on a strong offer.
Risks & watch-outs
- Climate carrying-cost: extreme-heat days projected 4→12/yr by 2055 (HVAC capex compounding) — expect insurance premiums to compound above CPI over the hold.
Questions for the listing agent
- What do current leases actually rent for vs. the listed asking? Can we see a recent rent roll and the last 12 months of T-12 income?
- It's been on market 76 days. Have you received any prior offers? Is the seller open to a 20% concession, seller financing, or rate buy-down credit?
- What does the HOA fee cover, when was the last increase, and are there any pending special assessments or reserve-fund shortfalls?
- Any open or pending special assessments — roof, HVAC, plumbing, elevator, façade? What's the per-unit balance and payoff schedule, and is the seller paying it off at close or rolling it to the buyer?
- Why hasn't it sold? Are there any deal-killer items the seller is aware of (foundation, flood, title, zoning, code violations)?
- Is there a deadline driving the sale (1031 exchange, divorce, estate, relocation)? That informs how much negotiation room exists.
- The area grade is low — what's the realistic commute time and amenity access for the typical tenant pool here? Any planned neighborhood developments (good or bad) we should know about?
- What's the average days-on-market for RENTAL listings here right now (not sales)? A rising rental-DOM trend means longer vacancies and softer asking-rent achievability than the comps imply.
- What's the recent tenant-quality profile in this submarket — average credit score on applications, eviction rate, late-payment / NSF rate, and stable-employment percentage? A property-management company in the area should have these aggregated.
- How much new apartment / multifamily construction is in the pipeline within 1–3 miles? Heavy new supply (>2% of stock underway) typically softens rents 12–24 months out; light construction supports rent growth.
Investment metrics
- 1% rule
- 0.87% ✗
- Cap rate
- 4.96%
- Cash-on-cash
- -4.76%
- DSCR
- 0.79
- GRM
- 9.6
CMA / ARV
- ARV (median comp)
- $682,748
- List price
- $575,000
- Delta
- -15.78%
- Verdict
- UNDERPRICED
- Comps
- 20 within 1.0 mi
Projected returns pro-forma
-3.0% appreciation · 3.72% rent growth · sell at horizon
- IRR
- -23.3%
- Equity multiple
- 0.19×
- Total profit
- $-129,796
- Equity at exit
- $85,734
- IRR
- -15.8%
- Equity multiple
- 0.08×
- Total profit
- $-148,490
- Equity at exit
- $49,715
Cash invested: $161,000 (down + closing). Projections, not guarantees.
Landlord ↔ Tenant lean methodology
- Overall (STATE)
- 18 Strongly Tenant-Friendly
- State California
- 18 Strongly Tenant-Friendly · D+13
- County
- — inherits STATE
- City
- — inherits STATE
ZIP-level market 92270
- Rents YoY
- 3.7%
- Active inventory
- 532
- Price-to-rent
- 9.6×
Monthly cashflow live
- Estimated rent
- $4,982 high interval (Pro) →
- Mortgage (P&I)
- −$3,015
- Tax from tax record
- −$420 /mo · $5,042/yr
- Insurance
- −$240
- HOA
- −$900
- Vacancy / Maint / Mgmt
- −$1,046
- Net cashflow
- $-639
Break-even live
Sensitivity live
| Price | -10% $-314 | -5% $-476 | +0% $-639 | +5% $-802 | +10% $-965 |
|---|---|---|---|---|---|
| Rent | -10% $-1,033 | -5% $-836 | +0% $-639 | +5% $-442 | +10% $-245 |
| Rate | -1.0pp $-349 | -0.5pp $-493 | base $-639 | +0.5pp $-788 | +1.0pp $-940 |
UW: 25.0% down · 7.5% · 30yr · 1.5% tax · 5.0% vac · 8.0% maint · 8.0% mgmt
Financing live
Cash to close
- Down payment
- $143,750
- Closing costs
- $17,250
- Reserves months
- —
- Total cash needed
- —
Loan-product check · same deal, 3 products live
Conventional
25% down · 7.5% · 30yr
- Down + closing
- —
- Monthly P&I
- —
- Monthly cashflow
- —
- DSCR
- —
- Eligible?
- —
Personal DTI + credit; lowest rate.
DSCR
20% down · 8.5% · 30yr
- Down + closing
- —
- Monthly P&I
- —
- Monthly cashflow
- —
- DSCR
- —
- Eligible?
- —
No personal income docs; deal must DSCR.
Hard money
10% down · 12.0% · 12mo
- Down + closing
- —
- Monthly P&I
- —
- Monthly cashflow
- —
- DSCR
- —
- Eligible?
- —
Short-term bridge; refi at stabilization.
Rent comps 40 comps
| Address | Beds | Baths | Sqft | Rent | $/sqft | DOM | Units | Dist |
|---|---|---|---|---|---|---|---|---|
| 42 Colonial Dr Rancho Mirage, CA | 3.0 | 3.0 | 2005 | $3,600 | $1.80 | 23d | 1 | 0.07mi |
| 42 Colonial Dr Rancho Mirage, CA | 3.0 | 3.0 | 2005 | $3,600 | $1.80 | 4d | 1 | 0.07mi |
| 54 Pine Valley Dr Rancho Mirage, CA | 3.0 | 2.0 | 1620 | $5,000 | $3.09 | 45d | 1 | 0.24mi |
| 38 Pine Valley Dr Rancho Mirage, CA | 2.0 | 2.0 | 1620 | $6,500 | $4.01 | 45d | 1 | 0.26mi |
| 51 Pebble Beach Dr Rancho Mirage, CA | 3.0 | 2.0 | 1806 | $6,000 | $3.32 | 45d | 1 | 0.35mi |
| 69 Cabernet Rancho Mirage, CA | 2.0 | 2.0 | 1438 | $3,200 | $2.23 | 45d | 1 | 0.53mi |
| 91 Augusta Dr Rancho Mirage, CA | 2.0 | 2.0 | 1620 | $5,290 | $3.27 | 45d | 1 | 0.58mi |
| 462 Sunningdale Dr Rancho Mirage, CA | 2.0 | 2.0 | 1547 | $3,750 | $2.42 | 45d | 1 | 0.59mi |
| 22 San Leandro Ct Rancho Mirage, CA | 3.0 | 3.5 | 2563 | $5,500 | $2.15 | 45d | 1 | 0.59mi |
| 464 Sunningdale Dr Rancho Mirage, CA | 3.0 | 3.0 | 1751 | $6,000 | $3.43 | 45d | 1 | 0.60mi |
| 436 Sunningdale Dr Rancho Mirage, CA | 2.0 | 2.0 | 1535 | $4,000 | $2.61 | 45d | 1 | 0.62mi |
| 426 Forest Hills Dr Rancho Mirage, CA | 2.0 | 2.0 | 1535 | $3,600 | $2.35 | 26d | 1 | 0.67mi |
| 415 Forest Hills Dr Rancho Mirage, CA | 2.0 | 2.0 | 1535 | $3,300 | $2.15 | 45d | 1 | 0.70mi |
| 26 Carmenere Rancho Mirage, CA | 2.0 | 2.0 | 1438 | $6,000 | $4.17 | 45d | 1 | 0.73mi |
| 829 Inverness Dr Rancho Mirage, CA | 4.0 | 3.0 | 2527 | $11,000 | $4.35 | 14d | 1 | 0.76mi |
| 69 San Marino Cir Rancho Mirage, CA | 3.0 | 2.5 | 2601 | $3,795 | $1.46 | 23d | 1 | 0.78mi |
| 343 Forest Hills Dr Rancho Mirage, CA | 2.0 | 2.0 | 1535 | $4,500 | $2.93 | 19d | 1 | 0.79mi |
| 343 Forest Hills Dr Rancho Mirage, CA | 2.0 | 2.0 | 1535 | $4,500 | $2.93 | 45d | 1 | 0.79mi |
| 81 Claret Rancho Mirage, CA | 3.0 | 2.0 | 2329 | $4,995 | $2.14 | 45d | 1 | 0.81mi |
| 39 Barolo Rancho Mirage, CA | 2.0 | 2.5 | 2509 | $10,000 | $3.99 | 45d | 1 | 0.83mi |
| 118 Racquet Club Dr Rancho Mirage, CA | 2.0 | 2.0 | 1488 | $2,900 | $1.95 | 45d | 1 | 0.86mi |
| 82 Burgundy Rancho Mirage, CA | 2.0 | 2.0 | 1438 | $4,250 | $2.96 | 20d | 1 | 0.91mi |
| 107 Racquet Club Dr Rancho Mirage, CA | 2.0 | 2.0 | 1488 | $4,500 | $3.02 | 45d | 1 | 0.91mi |
| 714 Inverness Dr Rancho Mirage, CA | 3.0 | 3.0 | 2227 | $3,500 | $1.57 | 45d | 1 | 0.92mi |
| 70895 Ironwood Dr Rancho Mirage, CA | 4.0 | 2.5 | 2575 | $7,995 | $3.10 | 6d | 1 | 0.95mi |
| 162 Saint Thomas Pl Rancho Mirage, CA | 3.0 | 2.5 | 2477 | $6,000 | $2.42 | 45d | 1 | 0.97mi |
| 36726 Jasmine Ln Rancho Mirage, CA | 4.0 | 3.0 | 2539 | $14,000 | $5.51 | 45d | 1 | 1.01mi |
| 34 Magnum Rancho Mirage, CA | 2.0 | 2.0 | 1770 | $3,800 | $2.15 | 45d | 1 | 1.09mi |
| 35054 Mission Hills Dr Rancho Mirage, CA | 2.0 | 2.0 | 1396 | $2,549 | $1.83 | 6d | 1 | 1.17mi |
| 46 Vintage Rancho Mirage, CA | 2.0 | 2.0 | 1657 | $2,995 | $1.81 | 45d | 1 | 1.18mi |
| 20 Via Bella Rancho Mirage, CA | 3.0 | 2.5 | 2367 | $3,995 | $1.69 | 23d | 1 | 1.21mi |
| 21 Via Bella Rancho Mirage, CA | 3.0 | 2.0 | 2331 | $3,900 | $1.67 | 26d | 1 | 1.22mi |
| 18 Via Bella Rancho Mirage, CA | 3.0 | 3.0 | 2333 | $5,200 | $2.23 | 45d | 1 | 1.22mi |
| 35 Mission Ct Rancho Mirage, CA | 3.0 | 2.0 | 1382 | $4,125 | $2.98 | 45d | 1 | 1.23mi |
| 35082 Mission Hills Dr Rancho Mirage, CA | 2.0 | 2.5 | 1624 | $3,250 | $2.00 | 14d | 1 | 1.24mi |
| 38 Mission Ct Rancho Mirage, CA | 3.0 | 3.0 | 1382 | $3,500 | $2.53 | 45d | 1 | 1.24mi |
| 35090 Mission Hills Dr Rancho Mirage, CA | 2.0 | 2.0 | 1596 | $3,950 | $2.47 | 26d | 1 | 1.25mi |
| 8 Mission Ct Rancho Mirage, CA | 2.0 | 2.0 | 1540 | $2,500 | $1.62 | 20d | 1 | 1.28mi |
| 34 Paris Way Rancho Mirage, CA | 3.0 | 3.0 | 2101 | $6,000 | $2.86 | 45d | 1 | 1.28mi |
| 253 Loch Lomond Rd Rancho Mirage, CA | 3.0 | 4.0 | 2452 | $11,900 | $4.85 | 45d | 1 | 1.32mi |
HOA detail condo
- Monthly dues
- $900 · $10,800/yr
- Likely covers
- landscaping
- Assessments
- None detected in remarks — confirm with the listing agent.
Listing history 16 events
-
2026-06-15status $575,000 Pending 76 DOM
-
2026-06-13days on market $575,000 Active Under Contract 76 DOM
-
2026-06-13days on market $575,000 Active Under Contract 75 DOM
-
2026-06-09days on market $575,000 Active Under Contract 72 DOM
-
2026-06-08days on market $575,000 Active Under Contract 71 DOM
-
2026-06-07days on market $575,000 Active Under Contract 70 DOM
-
2026-06-04days on market $575,000 Active Under Contract 67 DOM
-
2026-06-03days on market $575,000 Active Under Contract 66 DOM
-
2026-06-02days on market $575,000 Active Under Contract 65 DOM
-
2026-06-01days on market $575,000 Active Under Contract 64 DOM
-
2026-05-31days on market $575,000 Active Under Contract 63 DOM
-
2026-05-16historical Active Under Contract 665-char remark
Show marketing remark (665 chars)
Located in Mission Hills Country Club's Deane Homes on fee land, this beautifully upgraded residence offers stunning fairway views of the 6th hole of the Pete Dye Resort Course. The home features hardwood flooring, wooden plantation shutters, and granite countertops throughout. Bathrooms are tastefully updated with granite finishes and frameless glass showers. Enjoy a private, thoughtfully designed courtyard with mature landscaping--perfect for relaxing or entertaining. Additional highlights include a new AC and heating system installed in October, plus a spacious three-car garage complete with abundant built-in storage and durable lava flow epoxy flooring.
-
2026-03-21$575,000 Active 665-char remark
Show marketing remark (665 chars)
Located in Mission Hills Country Club's Deane Homes on fee land, this beautifully upgraded residence offers stunning fairway views of the 6th hole of the Pete Dye Resort Course. The home features hardwood flooring, wooden plantation shutters, and granite countertops throughout. Bathrooms are tastefully updated with granite finishes and frameless glass showers. Enjoy a private, thoughtfully designed courtyard with mature landscaping--perfect for relaxing or entertaining. Additional highlights include a new AC and heating system installed in October, plus a spacious three-car garage complete with abundant built-in storage and durable lava flow epoxy flooring.
-
2000-04-18soldstatus $246,000
-
2000-03-03historical
-
1999-11-30$254,000
ⓘ Source: listings_history table (triggers on properties + properties_extension) + one-shot
backfill from property_details.listing_events for pre-trigger history.
Tax reassessment forecast CA · Resets to sale price
- Current annual tax
- $5,042 · $420/mo
- Projected year-2 tax
- $5,042 · $420/mo
- Expected delta
- $0/yr ($0/mo · 0.0%)
ⓘ Screening estimate from a state-policy table — verify with the county assessor before closing.
Climate risk First Street
- Flood 1/10 Low FEMA zone X (unshaded) · 0% chance over 30 yrs
- Wildfire 1/10 Low
- Heat 9/10 Extreme 4 d/yr ≥114°F today · 12 d/yr by 30 yrs out
- Wind 1/10 Low
- Air quality 4/10 Moderate 5 unhealthy d/yr today · 7 by 30 yrs out
Nearby sold comps map
Loading sold comps map…
Walkable amenities ~0.75 mi
Loading nearby amenities…
Taxation est. · year 1
- Rental income
- $59,788
- − Mortgage interest
- −$32,209
- − Property taxes
- −$5,042
- − Insurance
- −$2,875
- − Repairs & maintenance
- −$4,783
- − Management
- −$4,783
- − HOA
- −$10,800
- − Depreciation
- −$16,727
- Taxable loss
- −$17,431
- Est. tax savings @ 24.0%
- +$4,183
- After-tax cash flow
- $-3,485/yr
For passive investors: Depreciation is non-cash, so a rental often shows a tax loss while cash-flowing — sheltering income. Rental losses are passive: they offset passive income freely, and up to $25,000/yr can offset ordinary (W-2) income if you actively participate and your MAGI is under $100k (phasing out to $0 by $150k); unused losses carry forward. On sale, claimed depreciation is recaptured at up to 25%, and gains may owe capital-gains tax (a 1031 exchange can defer both). Figures are a year-1 estimate at your 24.0% rate — not tax advice; consult a CPA.
Schools (NCES district)
- District
- Palm Springs Unified
- NCES district ID
- 0629550
- Math proficiency
- 21% ▼ -7.00%
- Reading proficiency
- 42% ▬ 0.00%
- Median HH income
- $43,638
- Composite
- 26.76/100
- National rank
- #7131
- State rank
- #328 of 517 in CA
Livability — Rancho Mirage
- Score
- 51/100
- State rank
- #1065
- US rank
- #25255
Category grades
Schools grade is shown separately in the Schools card above.
Census & demographics
- Census place
- Rancho Mirage, CA
- County
- Riverside County · 2,287,001 people
- City population
- 17,563
- Metro
- Riverside-San Bernardino-Ontario, CA
- Population (ZIP)
- 17,563
- Household income
- $107,364
- Rent vs Own
- Severe rent burden
- 498.0
Population outlook (Riverside County) Hauer SSP2
- Today (2025)
- 2,664,475 people
- By 2030
- 2,802,692 · +5.2%
- By 2040
- 3,050,904 · +14.5%
- By 2050
- 3,256,783 · +22.2%
- By 2075
- 3,655,058 · +37.2%
- By 2100
- 3,766,594 · +41.4%
Race, ethnicity, and origin ACS 2023
- Neighborhood character
- Predominantly White (77%)
- Race & ethnicity
- White 77% Hispanic / Latino 15% Two or more races 6% Asian 4% Black 2%
- Hispanic origin (detail)
- Mexican 12%
- Common ancestry
- Slovak 4% Romanian 3% Lithuanian 3%
- Foreign-born
- 17% · Canada, South Korea, China
- Languages at home
- 81% English-only · Spanish 11% Other Indo-European 3% French/Haitian/Cajun 1%
Political lean MEDSL · Riverside
- 2024 margin
- Toss-up / Even · D 48.0% · R 49.3% · Other 2.6%
- 2008→2024 swing
- -3.6pp toward R · 2008: 2.3pp · 2024: -1.3pp
- All cycles
- 2024: R+1.3 2020: D+8.0 2016: D+4.3 2012: R+0.4 2008: D+2.3
Not yet ingested
- Civics
- —
Market trends
- HPI YoY
- ▼ -210.99%
- Current HPI
- 282.2957
- Rent YoY
- ▲ 3.72%
- Metro
- Riverside-San Bernardino-Ontario, CA
- State GDP YoY
- ▲ 3.21%
- F500 in state
- 116
Industry mix (Fortune 500 HQ in CA)
| Industry | F500 HQs | Revenue |
|---|---|---|
| Technology | 27 | $1,492B |
|
||
| Financial Services | 3 | $174B |
|
||
| Retail | 3 | $44B |
|
||
| Insurance | 3 | $26B |
|
||
| Media / Entertainment | 2 | $115B |
|
||
| Pharmaceuticals / Biotech | 2 | $62B |
|
||
Price history
+126.4% since first listed5 events — show timeline
- 2026-05-16 Contingent — GPSMLS
- 2026-03-21 Listed $575,000 GPSMLS
- 2000-04-18 Sold (Public Records) $246,000 Public Records
- 2000-03-03 Listing Removed — GPSMLS
- 1999-11-30 Listed $254,000 GPSMLS
Property tax history
+2.1%/yrLatest (2025): $5,042 · -0.9% YoY. Source: county tax records.
Cash-flow waterfall
monthlySold comps — $/sqft
last 12 mo · ≤1 miLoading sold comps…