1101 S Carolina St · Louisiana, MO
Flood risk 6/10 · Moderate
- FEMA flood zone
- X (unshaded)
- Chance of flooding over 30 yrs
- 0.72%
- Est. flood insurance / yr
- $507 – $1,088
Fire risk 1/10 · Minimal
- Est. fire insurance / yr
- $1,054 – $1,958
Heat risk 4/10 · Minor
- Hot days now (above 107°F)
- 7 days/yr
- Hot days in 30 yrs
- 19 days/yr
Wind risk 2/10 · Minimal
- Chance of severe wind over 30 yrs
- 1.0%
Air-quality risk 2/10 · Minimal
- Unhealthy air days now
- 1 days/yr
- Unhealthy air days in 30 yrs
- 2 days/yr
Risk factors via First Street. Map © Google.
Why this score? — see what drove the D grade
The composite is a weighted blend of 9 inputs, each scored 0–100. Each bar is that input's sub-score; the figure is the points it added to the 100-point composite (weight × sub-score).
- Cash flow +15.0/30.0
- ARV discount +7.5/15.0
- 1% rule +5.0/10.0
- DSCR +5.0/10.0
- Livability +3.6/5.0
- Schools +2.9/10.0
- Rent growth +2.5/5.0
- Condition / age +2.5/5.0
- Appreciation +0.3/10.0
$29,900
🖨 Deal sheet (PDF) 📄 Offer letter ✓ Due diligence
Listing remarks
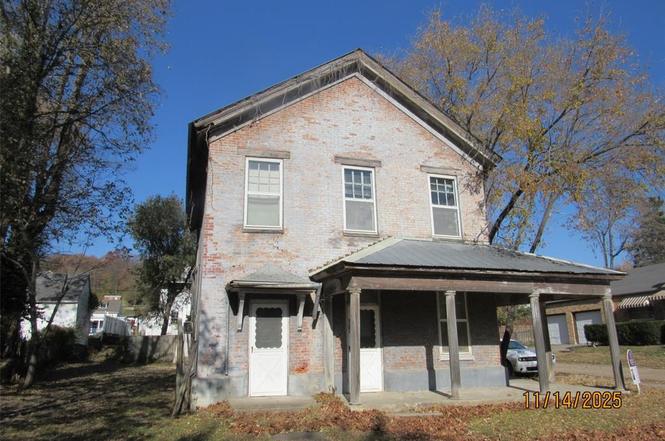
IF the walls could talk?!?! So much history in this 1880, 2438 sq ft 2 story brick home on corner lot!!Home has an awesome front porch! Great fireplace, large rooms, put some sweat equity in this home to make it yours or to fix up for rental properties. With the separate back entrance you could live in part and rent the other part!! It won't last long! SELLING AS IS WHERE IS!!
Key facts
- 6,839 sq ft lot
- Built 1880
- Listed 441 days
Neighborhood map
What this means for you Summary
Snapshot
- This is a 3-bed/2.0-bath other listed at $30k.
Deal economics
- At list price, monthly cash flow is $853 ($10k/yr) — positive.
- The deal already cash-flows at list — no discount required.
- Meets the 1% rule at list price ($1k rent vs $30k).
- Recommended offer: $26k (12.0% below list) — sets the bar for market timing.
- Cap rate 40.5% vs local median 9.2% in Louisiana — top-decile yield for the area; either an underpriced asset or a hidden risk that comps aren't pricing in. Stress-test before assuming the spread holds.
Location & tenants
- Location reads 71/100 on livability (#105 in MO) — a middle-class / working-renter tenant base. Strengths: cost of living A+, housing A+, crime A; Watch: amenities F, commute F, employment D-.
- Louisiana R-II (town): math 31% / reading 39% proficiency, ranked #227 of 324 in MO (top 70%) — families likely to look elsewhere, expect single-tenant / working-renter base with shorter leases.
- Zoned schools: Louisiana Elem. (math 27% / reading 37%, grade F, #761 of 1,115 statewide, top 72%, 322 students, 74% FRL); Louisiana High (math 17% / reading 44%, grade F, #373 of 521 statewide, top 72%, 226 students, 62% FRL).
- Market conditions: 32 active listings in the ZIP; 38 units permitted in Pike County in 2024 (0 in 5+ unit buildings).
Forward outlook
- Local home prices are declining (-3.0%/yr); year-one equity from $207 of loan paydown is wiped out by about $897 of value loss. Plan a longer hold.
- Pike County population projected to shrink 7% by 2050 — rents likely to lag national; underwrite the cash flow, not the appreciation.
- At projected returns (-3.0% appreciation + 3.0% rent growth), your $8k cash investment doubles in ~1 year — after that, you're playing with house money.
Negotiation context
- It's been on market 441 days — a 12% lower offer ($26k) is reasonable based on typical stale-listing flexibility.
Risks & watch-outs
- Watch-outs: built in 1880 — expect roof / HVAC / electrical / plumbing capex.
- Climate carrying-cost: major flood risk — expect insurance premiums to compound above CPI over the hold.
Questions for the listing agent
- It's been on market 441 days. Have you received any prior offers? Is the seller open to a 12% concession, seller financing, or rate buy-down credit?
- Built in 1880 — when were the roof, HVAC, electrical panel, plumbing, and water heater last replaced?
- Why hasn't it sold? Are there any deal-killer items the seller is aware of (foundation, flood, title, zoning, code violations)?
- Is there a deadline driving the sale (1031 exchange, divorce, estate, relocation)? That informs how much negotiation room exists.
- Schools are D-rated, which usually means shorter tenancies and higher turnover. Who's the typical renter profile here, and what's been the actual vacancy rate?
- The area grade is low — what's the realistic commute time and amenity access for the typical tenant pool here? Any planned neighborhood developments (good or bad) we should know about?
- What's the average days-on-market for RENTAL listings here right now (not sales)? A rising rental-DOM trend means longer vacancies and softer asking-rent achievability than the comps imply.
- What's the recent tenant-quality profile in this submarket — average credit score on applications, eviction rate, late-payment / NSF rate, and stable-employment percentage? A property-management company in the area should have these aggregated.
- How much new for-sale + rental construction is in the pipeline within 1–3 miles? Heavy new supply typically softens prices + rents 12–24 months out; constrained supply supports both.
Investment metrics
- 1% rule
- 4.39% ✓
- Cap rate
- 40.54%
- Cash-on-cash
- 122.32%
- DSCR
- 6.44
- GRM
- 1.9
CMA / ARV
No comps found within radius.
Projected returns pro-forma
-3.0% appreciation · 3.0% rent growth · sell at horizon
- IRR
- —
- Equity multiple
- 6.91×
- Total profit
- $49,516
- Equity at exit
- $4,458
- IRR
- —
- Equity multiple
- 14.51×
- Total profit
- $113,131
- Equity at exit
- $2,585
Cash invested: $8,372 (down + closing). Projections, not guarantees.
Landlord ↔ Tenant lean methodology
- Overall (STATE)
- 81 Strongly Landlord-Friendly
- State Missouri
- 81 Strongly Landlord-Friendly · R+10
- County
- — inherits STATE
- City
- — inherits STATE
ZIP-level market 63353
- Home prices YoY
- -5.0%
- Active inventory
- 32
- Price-to-rent
- 1.9×
Monthly cashflow live
- Estimated rent
- $1,313 medium interval (Pro) →
- Mortgage (P&I)
- −$157
- Tax from tax record
- −$15 /mo · $176/yr
- Insurance
- −$12
- HOA
- −$0
- Vacancy / Maint / Mgmt
- −$276
- Net cashflow
- $853
Break-even live
Sensitivity live
| Price | -10% $870 | -5% $862 | +0% $853 | +5% $845 | +10% $836 |
|---|---|---|---|---|---|
| Rent | -10% $750 | -5% $802 | +0% $853 | +5% $905 | +10% $957 |
| Rate | -1.0pp $868 | -0.5pp $861 | base $853 | +0.5pp $846 | +1.0pp $838 |
UW: 25.0% down · 7.5% · 30yr · 1.5% tax · 5.0% vac · 8.0% maint · 8.0% mgmt
Financing live
Cash to close
- Down payment
- $7,475
- Closing costs
- $897
- Reserves months
- —
- Total cash needed
- —
Loan-product check · same deal, 3 products live
Conventional
25% down · 7.5% · 30yr
- Down + closing
- —
- Monthly P&I
- —
- Monthly cashflow
- —
- DSCR
- —
- Eligible?
- —
Personal DTI + credit; lowest rate.
DSCR
20% down · 8.5% · 30yr
- Down + closing
- —
- Monthly P&I
- —
- Monthly cashflow
- —
- DSCR
- —
- Eligible?
- —
No personal income docs; deal must DSCR.
Hard money
10% down · 12.0% · 12mo
- Down + closing
- —
- Monthly P&I
- —
- Monthly cashflow
- —
- DSCR
- —
- Eligible?
- —
Short-term bridge; refi at stabilization.
Listing history 7 events
-
2026-01-07status Pending
-
2025-09-27price $29,900
-
2025-06-06price $34,900
-
2024-12-11price $40,000
-
2024-12-05price $45,000
-
2024-10-23$50,000 Active
-
1982-05-01soldstatus
ⓘ Source: listings_history table (triggers on properties + properties_extension) + one-shot
backfill from property_details.listing_events for pre-trigger history.
Tax reassessment forecast MO · Resets to sale price
- Current annual tax
- $176 · $15/mo
- Projected year-2 tax
- $290 · $24/mo
- Expected delta
- +$114/yr (+$10/mo · 64.8%)
ⓘ Screening estimate from a state-policy table — verify with the county assessor before closing.
Climate risk First Street
- Flood 6/10 Major FEMA zone X (unshaded) · 72% chance over 30 yrs
- Wildfire 1/10 Low
- Heat 4/10 Moderate 7 d/yr ≥107°F today · 19 d/yr by 30 yrs out
- Wind 2/10 Low 100% chance of damaging wind over 30 yrs
- Air quality 2/10 Low 1 unhealthy d/yr today · 2 by 30 yrs out
Nearby sold comps map
Loading sold comps map…
Walkable amenities ~0.75 mi
Loading nearby amenities…
Taxation est. · year 1
- Rental income
- $15,757
- − Mortgage interest
- −$1,675
- − Property taxes
- −$176
- − Insurance
- −$150
- − Repairs & maintenance
- −$1,261
- − Management
- −$1,261
- − Depreciation
- −$870
- Taxable income
- $10,366
- Est. tax owed @ 24.0%
- −$2,488
- After-tax cash flow
- $7,753/yr
For passive investors: Depreciation is non-cash, so a rental often shows a tax loss while cash-flowing — sheltering income. Rental losses are passive: they offset passive income freely, and up to $25,000/yr can offset ordinary (W-2) income if you actively participate and your MAGI is under $100k (phasing out to $0 by $150k); unused losses carry forward. On sale, claimed depreciation is recaptured at up to 25%, and gains may owe capital-gains tax (a 1031 exchange can defer both). Figures are a year-1 estimate at your 24.0% rate — not tax advice; consult a CPA.
Schools (NCES district)
- District
- Louisiana R-II
- NCES district ID
- 2919260
- Math proficiency
- 31% ▲ 1.00%
- Reading proficiency
- 39% ▬ 0.00%
- Median HH income
- $37,149
- Composite
- 29.1/100
- National rank
- #6595
- State rank
- #227 of 324 in MO
Livability — Louisiana
- Score
- 71/100
- State rank
- #105
- US rank
- #6899
Category grades
Schools grade is shown separately in the Schools card above.
Census & demographics
- Census place
- Louisiana, MO
- Population (ZIP)
- 4,935
Population outlook (Pike County) Hauer SSP2
- Today (2025)
- 17,895 people
- By 2030
- 17,591 · -1.7%
- By 2040
- 17,080 · -4.6%
- By 2050
- 16,589 · -7.3%
- By 2075
- 14,761 · -17.5%
- By 2100
- 11,606 · -35.1%
Race, ethnicity, and origin ACS 2023
- Neighborhood character
- Predominantly White (90%)
- Race & ethnicity
- White 90% Two or more races 6% Hispanic / Latino 3% Black 2%
- Common ancestry
- Romanian 3% Iranian 2% Lithuanian 1%
- Foreign-born
- 1% · Canada, China
- Languages at home
- 96% English-only · Spanish 3%
Political lean MEDSL · Pike
- 2024 margin
- Solid R (+57.9) · D 20.7% · R 78.6%
- 2008→2024 swing
- -48.0pp toward R · 2008: -9.9pp · 2024: -57.9pp
- All cycles
- 2024: R+57.9 2020: R+53.9 2016: R+47.0 2012: R+27.3 2008: R+9.9
Not yet ingested
- Civics
- —
Market trends
- HPI YoY
- ▼ -9.40%
- Current HPI
- 180.6084
- Rent YoY
- —
- Metro
- —
- State GDP YoY
- ▲ 1.84%
- F500 in state
- 20
Industry mix (Fortune 500 HQ in MO)
| Industry | F500 HQs | Revenue |
|---|---|---|
| Healthcare | 1 | $163B |
|
||
| Insurance | 1 | $21B |
|
||
| Industrial Technology | 1 | $17B |
|
||
| Retail | 1 | $16B |
|
||
| Industrial Distribution | 1 | $10B |
|
||
| Utilities | 1 | $9B |
|
||
Price history
-40.2% since first listed7 events — show timeline
- 2026-01-07 Pending — MARIS as Distributed by MLS Grid
- 2025-09-27 Price Changed $29,900 MARIS as Distributed by MLS Grid
- 2025-06-06 Price Changed $34,900 MARIS as Distributed by MLS Grid
- 2024-12-11 Price Changed $40,000 MARIS as Distributed by MLS Grid
- 2024-12-05 Price Changed $45,000 MARIS as Distributed by MLS Grid
- 2024-10-23 Listed $50,000 MARIS as Distributed by MLS Grid
- 1982-05-01 Sold (Public Records) — Public Records
Property tax history
-1.0%/yrLatest (2025): $176 · -36.8% YoY. Source: county tax records.
Cash-flow waterfall
monthlySold comps — $/sqft
last 12 mo · ≤1 miLoading sold comps…