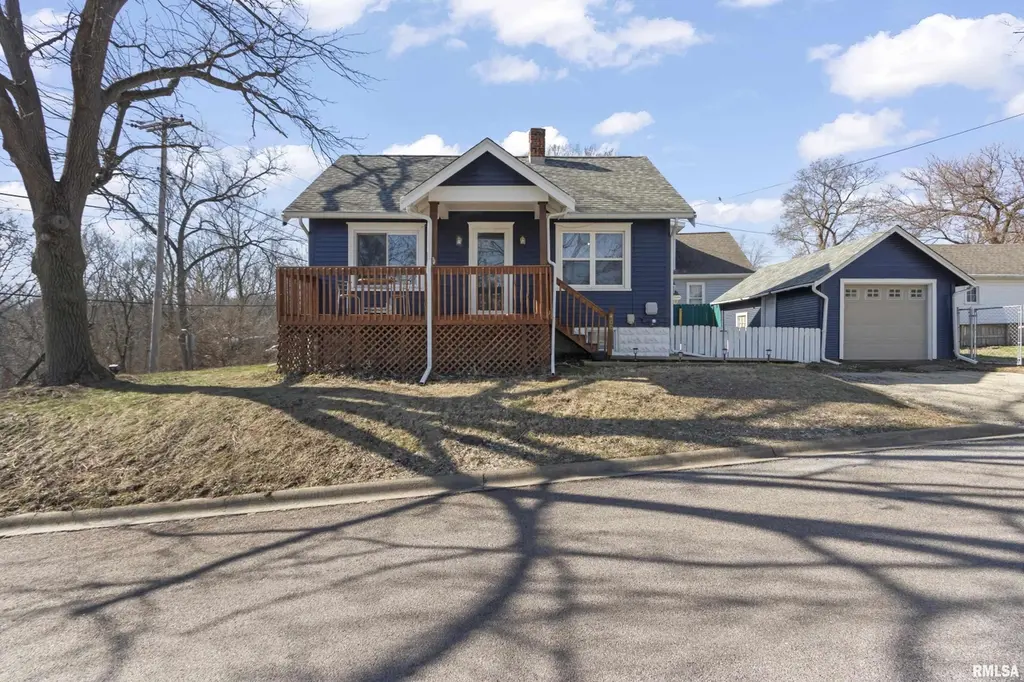
400 Pekin Ave · East Peoria, IL
Flood risk 1/10 · Minimal
- FEMA flood zone
- X (unshaded)
- Chance of flooding over 30 yrs
- 0.0%
- Est. flood insurance / yr
- $473 – $860
Fire risk 1/10 · Minimal
- Est. fire insurance / yr
- $804 – $1,492
Heat risk 3/10 · Minor
- Hot days now (above 104°F)
- 7 days/yr
- Hot days in 30 yrs
- 18 days/yr
Wind risk 2/10 · Minimal
- Chance of severe wind over 30 yrs
- 1.0%
Air-quality risk 3/10 · Minor
- Unhealthy air days now
- 1 days/yr
- Unhealthy air days in 30 yrs
- 3 days/yr
Risk factors via First Street. Map © Google.
Why this score? — see what drove the F grade
The composite is a weighted blend of 9 inputs, each scored 0–100. Each bar is that input's sub-score; the figure is the points it added to the 100-point composite (weight × sub-score).
- Cash flow +5.7/30.0
- Livability +3.8/5.0
- Rent growth +2.5/5.0
- Condition / age +2.5/5.0
- Schools +1.5/10.0
- 1% rule +1.4/10.0
- DSCR +0.1/10.0
- ARV discount +0.0/15.0
- Appreciation +0.0/10.0
$110,000
🖨 Deal sheet 📄 Offer letter ✓ Due diligence
Listing remarks
Sometimes it’s the simple ones that just get it right—clean updates, great space, and a home that feels easy to settle into from day one. Fresh paint inside and out gives it a clean, inviting feel, with a color palette that’s both stylish and easy to make your own. The living spaces feel bright and comfortable, with a layout that simply works for everyday life. Big-ticket items are already in place too, including a roof that’s only about four years old—one less thing to worry about as you settle in. Outside is where this home really separates itself. The large side yard isn’t just extra space—it’s a bit of a gardener’s paradise. Whether
Key facts
- Garage
- Built 1933
- Listed 40 days
Property features AI
Exterior
- Parking: Detached 1-car garage
- Utilities: Public water; Public sewer
- Home design: Single family residence; Shingle roof; Built in 1933
- Construction: Original construction (not new); Building area reported
- Exterior features: Fenced yard; Level lot; Paved road access
Interior
- Kitchen: Kitchen on the main level
- Bedrooms: Two bedrooms (one on the main level, one on the upper level)
- Flooring: Luxury vinyl plank flooring in living room and kitchen; Carpet in bedrooms and office; Laminate flooring in additional basement rooms
- Bathrooms: One full bathroom
- Heating & cooling: Electric heating; Central air conditioning
- Interior features: Full, partially finished basement; No fireplaces; Egress window in at least one bedroom
Neighborhood map
What this means for you Summary
Snapshot
- This is a 1-bed/1.0-bath single-family listed at $110k.
Deal economics
- At list price, monthly cash flow is $-225 ($-3k/yr) — negative.
- To cash-flow at today's rent, offer at most $70k (36.1% below list).
- To meet the 1% rule (rent ≥ 1% of price), the offer needs to be $71k (35.9% below list).
- Recommended offer: $70k (36.1% below list) — sets the bar for cash-flow.
Location & tenants
- Location reads 75/100 on livability (#209 in IL, #3,927 nationally) — a middle-class / working-renter tenant base. Strengths: cost of living A+, housing A+, health & safety A+; Watch: amenities D, commute F.
- East Peoria Chsd 309 (suburban): math 17% / reading 15% proficiency, ranked #482 of 620 in IL (top 78%) — low school quality limits family demand, transient renter base, plan for 1-2y turnover.
- Zoned schools: East Peoria High School (math 17% / reading 15%, grade F, #457 of 693 statewide, top 66%, 947 students, 0% FRL).
- Market conditions: 145 active listings in the ZIP; 2 comparable units currently listed for rent nearby; 77 units permitted in Tazewell County in 2024 (0 in 5+ unit buildings).
Forward outlook
- Local home prices are declining (-3.0%/yr); year-one equity from $761 of loan paydown is wiped out by about $3k of value loss. Plan a longer hold.
- Tazewell County population projected at -15% by 2050 — secular population decline; favor cash flow + early exit over multi-decade hold.
Negotiation context
- It's been on market 41 days — a 3% lower offer ($107k) is reasonable based on typical stale-listing flexibility.
- 2 sale attempts; this cycle's ask is 10% above the opening price — seller raised mid-cycle; expect resistance to lowballs.
Risks & watch-outs
- Watch-outs: built in 1933 — expect roof / HVAC / electrical / plumbing capex.
Questions for the listing agent
- What do current leases actually rent for vs. the listed asking? Can we see a recent rent roll and the last 12 months of T-12 income?
- It's been on market 41 days. Have you received any prior offers? Is the seller open to a 36% concession, seller financing, or rate buy-down credit?
- Built in 1933 — when were the roof, HVAC, electrical panel, plumbing, and water heater last replaced?
- Is there a deadline driving the sale (1031 exchange, divorce, estate, relocation)? That informs how much negotiation room exists.
- Schools are F-rated, which usually means shorter tenancies and higher turnover. Who's the typical renter profile here, and what's been the actual vacancy rate?
- The area grade is low — what's the realistic commute time and amenity access for the typical tenant pool here? Any planned neighborhood developments (good or bad) we should know about?
- What's the average days-on-market for RENTAL listings here right now (not sales)? A rising rental-DOM trend means longer vacancies and softer asking-rent achievability than the comps imply.
- What's the recent tenant-quality profile in this submarket — average credit score on applications, eviction rate, late-payment / NSF rate, and stable-employment percentage? A property-management company in the area should have these aggregated.
- How much new for-sale + rental construction is in the pipeline within 1–3 miles? Heavy new supply typically softens prices + rents 12–24 months out; constrained supply supports both.
Investment metrics
- 1% rule
- 0.64% ✗
- Cap rate
- 3.84%
- Cash-on-cash
- -8.76%
- DSCR
- 0.61
- GRM
- 13.0
CMA / ARV
- ARV (on-the-fly)
- $91,728
- Comps found
- 4
Show comp detail 4 sales within ~0.75 mi
| Address | Dist | Beds/Ba | Sqft | Sold | Price | $/sf | Match |
|---|---|---|---|---|---|---|---|
| 523 Pekin Ave | 0.12mi | 2/1.0 (+1) | 672 (-8%) | 14mo | $85,000 | $126 | 65 |
| 411 Pekin Ave | 0.04mi | 2/1.5 (+1) | 646 (-11%) | 19mo | $85,000 | $132 | 56 |
| 104 Fairview Ct | 0.68mi | 2/1.0 (+1) | 720 (-1%) | 13mo | $65,000 | $90 | 51 |
| 541 Monson St | 0.71mi | 2/1.0 (+1) | 792 (+9%) | 1mo | $75,000 | $95 | 46 |
Match score weights: distance 35% · size 25% · config 20% · recency 20%. Top-matched comps best support the ARV.
Projected returns pro-forma
-3.0% appreciation · 3.0% rent growth · sell at horizon
- IRR
- -31.8%
- Equity multiple
- -0.04×
- Total profit
- $-32,122
- Equity at exit
- $16,401
- IRR
- -35.9%
- Equity multiple
- -0.50×
- Total profit
- $-46,315
- Equity at exit
- $9,511
Cash invested: $30,800 (down + closing). Projections, not guarantees.
Landlord ↔ Tenant lean methodology
- Overall (STATE)
- 43 Moderately Tenant-Leaning
- State Illinois
- 43 Moderately Tenant-Leaning · D+7
- County
- — inherits STATE
- City
- — inherits STATE
ZIP-level market 61611
- Home prices YoY
- -30.8%
- Active inventory
- 145
- Price-to-rent
- 13.0×
Monthly cashflow live
- Estimated rent
- $705 medium interval (Pro) →
- Mortgage (P&I)
- −$577
- Tax from tax record
- −$159 /mo · $1,910/yr
- Insurance
- −$46
- HOA
- −$0
- Vacancy / Maint / Mgmt
- −$148
- Net cashflow
- $-225
Break-even live
UW: 25.0% down · 7.5% · 30yr · 1.5% tax · 5.0% vac · 8.0% maint · 8.0% mgmt
Financing live
Cash to close
- Down payment
- $27,500
- Closing costs
- $3,300
- Reserves months
- —
- Total cash needed
- —
Loan-product check · same deal, 3 products live
Conventional
25% down · 7.5% · 30yr
- Down + closing
- —
- Monthly P&I
- —
- Monthly cashflow
- —
- DSCR
- —
- Eligible?
- —
Personal DTI + credit; lowest rate.
DSCR
20% down · 8.5% · 30yr
- Down + closing
- —
- Monthly P&I
- —
- Monthly cashflow
- —
- DSCR
- —
- Eligible?
- —
No personal income docs; deal must DSCR.
Hard money
10% down · 12.0% · 12mo
- Down + closing
- —
- Monthly P&I
- —
- Monthly cashflow
- —
- DSCR
- —
- Eligible?
- —
Short-term bridge; refi at stabilization.
Rent comps 2 comps
| Address | Beds | Baths | Sqft | Rent | $/sqft | DOM | Units | Dist |
|---|---|---|---|---|---|---|---|---|
| 1107 Pekin Ave Unit B Creve Coeur, IL | 1.0 | 1.0 | 600 | $700 | $1.17 | 21d | 1 | 0.35mi |
| 928 S Stewart St Unit 1 Creve Coeur, IL | 1.0 | 1.0 | 630 | $725 | $1.15 | 21d | 1 | 1.47mi |
Listing history 25 events
-
2026-06-19days on market $110,000 Under Contract 41 DOM
-
2026-06-18days on market $110,000 Under Contract 40 DOM
-
2026-06-17days on market $110,000 Under Contract 39 DOM
-
2026-06-16days on market $110,000 Under Contract 38 DOM
-
2026-06-15days on market $110,000 Under Contract 37 DOM
-
2026-06-14days on market $110,000 Under Contract 35 DOM
-
2026-06-13days on market $110,000 Under Contract 34 DOM
-
2026-06-10days on market $110,000 Under Contract 32 DOM
-
2026-06-09days on market $110,000 Under Contract 31 DOM
-
2026-06-08days on market $110,000 Under Contract 30 DOM
-
2026-06-07days on market $110,000 Under Contract 29 DOM
-
2026-06-02statusdays on market $110,000 Under Contract 24 DOM
-
2026-06-01days on market $110,000 Active 23 DOM
-
2026-05-31days on market $110,000 Active 22 DOM
-
2026-05-30days on market $110,000 Active 21 DOM
-
2026-05-13status Active
-
2026-05-13price $110,000
-
2026-03-31status Pending
-
2026-03-27$99,900 Active
-
2026-03-23historical $99,900
-
2021-08-06historical
-
2021-08-06historical
-
2021-08-06historical
-
2021-08-06historical
-
2021-08-06historical
ⓘ Source: listings_history table (triggers on properties + properties_extension) + one-shot
backfill from property_details.listing_events for pre-trigger history.
Tax reassessment forecast IL · Partial reset (capped growth)
- Current annual tax
- $1,910 · $159/mo
- Projected year-2 tax
- $2,203 · $184/mo
- Expected delta
- +$294/yr (+$24/mo · 15.4%)
ⓘ Screening estimate from a state-policy table — verify with the county assessor before closing.
Climate risk First Street
- Flood 1/10 Low FEMA zone X (unshaded) · 0% chance over 30 yrs
- Wildfire 1/10 Low
- Heat 3/10 Moderate 7 d/yr ≥104°F today · 18 d/yr by 30 yrs out
- Wind 2/10 Low 100% chance of damaging wind over 30 yrs
- Air quality 3/10 Moderate 1 unhealthy d/yr today · 3 by 30 yrs out
Nearby sold comps map
Loading sold comps map…
Walkable amenities ~0.75 mi
Loading nearby amenities…
Taxation est. · year 1
- Rental income
- $8,461
- − Mortgage interest
- −$6,162
- − Property taxes
- −$1,910
- − Insurance
- −$550
- − Repairs & maintenance
- −$677
- − Management
- −$677
- − Depreciation
- −$3,200
- Taxable loss
- −$4,715
- Est. tax savings @ 24.0%
- +$1,132
- After-tax cash flow
- $-1,567/yr
For passive investors: Depreciation is non-cash, so a rental often shows a tax loss while cash-flowing — sheltering income. Rental losses are passive: they offset passive income freely, and up to $25,000/yr can offset ordinary (W-2) income if you actively participate and your MAGI is under $100k (phasing out to $0 by $150k); unused losses carry forward. On sale, claimed depreciation is recaptured at up to 25%, and gains may owe capital-gains tax (a 1031 exchange can defer both). Figures are a year-1 estimate at your 24.0% rate — not tax advice; consult a CPA.
Schools (NCES district)
- District
- East Peoria Chsd 309
- NCES district ID
- 1713230
- Math proficiency
- 17% ▼ -6.00%
- Reading proficiency
- 15% ▼ -9.00%
- Median HH income
- $51,439
- Composite
- 14.75/100
- National rank
- #9394
- State rank
- #482 of 620 in IL
Livability — East Peoria
- Score
- 75/100
- State rank
- #209
- US rank
- #3927
Category grades
Schools grade is shown separately in the Schools card above.
Census & demographics
- Census place
- East Peoria, IL
- City population
- 23,698
- Population (ZIP)
- 23,698
Population outlook (Tazewell County) Hauer SSP2
- Today (2025)
- 131,252 people
- By 2030
- 128,028 · -2.5%
- By 2040
- 120,443 · -8.2%
- By 2050
- 111,872 · -14.8%
- By 2075
- 89,843 · -31.5%
- By 2100
- 66,468 · -49.4%
Race, ethnicity, and origin ACS 2023
- Neighborhood character
- Predominantly White (92%)
- Race & ethnicity
- White 92% Two or more races 4% Hispanic / Latino 3% Black 1%
- Common ancestry
- Lithuanian 3% Italian 2% Romanian 2%
- Foreign-born
- 1%
- Languages at home
- 98% English-only · Spanish 1%
Political lean MEDSL · Tazewell
- 2024 margin
- Strong R (+26.7) · D 35.8% · R 62.5% · Other 1.8%
- 2008→2024 swing
- -20.6pp toward R · 2008: -6.0pp · 2024: -26.7pp
- All cycles
- 2024: R+26.7 2020: R+25.6 2016: R+28.5 2012: R+17.9 2008: R+6.0
Not yet ingested
- Civics
- —
Market trends
- HPI YoY
- ▼ -71.82%
- Current HPI
- 161.385
- Rent YoY
- —
- Metro
- —
- State GDP YoY
- ▲ 1.59%
- F500 in state
- 60
Industry mix (Fortune 500 HQ in IL)
| Industry | F500 HQs | Revenue |
|---|---|---|
| Insurance | 4 | $201B |
|
||
| Consumer Goods | 4 | $87B |
|
||
| Industrial Machinery | 3 | $64B |
|
||
| Healthcare | 2 | $55B |
|
||
| Retail / Pharmacy | 1 | $148B |
|
||
| Agriculture / Food | 1 | $86B |
|
||
Price history
+10.1% since first listed10 events — show timeline
- 2026-05-13 Relisted — RMLSA as Distributed by MLS Grid
- 2026-05-13 Price Changed $110,000 RMLSA as Distributed by MLS Grid
- 2026-03-31 Pending — RMLSA as Distributed by MLS Grid
- 2026-03-27 Listed $99,900 RMLSA as Distributed by MLS Grid
- 2026-03-23 Coming Soon $99,900 RMLSA as Distributed by MLS Grid
- 2021-08-06 Listing Removed — RMLSA as Distributed by MLS Grid
- 2021-08-06 Listing Removed — RMLSA as Distributed by MLS Grid
- 2021-08-06 Listing Removed — RMLSA as Distributed by MLS Grid
- 2021-08-06 Listing Removed — RMLSA as Distributed by MLS Grid
- 2021-08-06 Listing Removed — RMLSA as Distributed by MLS Grid
Property tax history
+6.6%/yrLatest (2024): $1,910 · +3.5% YoY. Source: county tax records.
Cash-flow waterfall
monthlySold comps — $/sqft
last 12 mo · ≤1 miLoading sold comps…