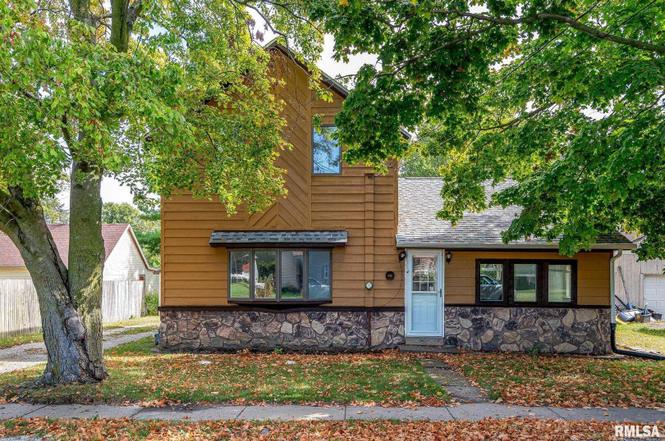
516 N Williams St · Reynolds, IL
Flood risk 1/10 · Minimal
- FEMA flood zone
- X (unshaded)
- Chance of flooding over 30 yrs
- 0.0%
- Est. flood insurance / yr
- $507 – $1,088
Fire risk 1/10 · Minimal
- Est. fire insurance / yr
- $804 – $1,492
Heat risk 3/10 · Minor
- Hot days now (above 103°F)
- 7 days/yr
- Hot days in 30 yrs
- 16 days/yr
Wind risk 2/10 · Minimal
- Chance of severe wind over 30 yrs
- —
Air-quality risk 2/10 · Minimal
- Unhealthy air days now
- 2 days/yr
- Unhealthy air days in 30 yrs
- 2 days/yr
Risk factors via First Street. Map © Google.
Why this score? — see what drove the C- grade
The composite is a weighted blend of 9 inputs, each scored 0–100. Each bar is that input's sub-score; the figure is the points it added to the 100-point composite (weight × sub-score).
- Cash flow +14.6/30.0
- ARV discount +12.4/15.0
- Appreciation +7.3/10.0
- 1% rule +4.6/10.0
- DSCR +4.4/10.0
- Livability +3.2/5.0
- Rent growth +2.5/5.0
- Schools +2.5/10.0
- Condition / age +2.5/5.0
$125,000
🖨 Deal sheet (PDF) 📄 Offer letter ✓ Due diligence
Listing remarks MLS
3 Bedroom, 1 and half bath, main floor laundry, 2 car garage, large yard close to the American legion in Reynolds. This home has a lot of character and charm! Needs a little TLC but will make a perfect home for the buyer looking for that small town living. All the mechanicals are newer. Furnace, A/C, hot water heater, electrical panel and the half bath was added after seller purchased this home. Home is being sold as is.
Key facts
- 0.24 acre lot
- 2 garage spots
- Built 1930
Neighborhood map
What this means for you Summary
Snapshot
- This is a 3-bed/1.5-bath single-family listed at $125k.
Deal economics
- At list price, monthly cash flow is $29 ($348/yr) — positive.
- The deal already cash-flows at list — no discount required.
- To meet the 1% rule (rent ≥ 1% of price), the offer needs to be $120k (3.6% below list).
- Recommended offer: $120k (3.6% below list) — sets the bar for 1% rule.
Location & tenants
- Location reads 65/100 on livability (#660 in IL) — a middle-class / working-renter tenant base. Strengths: employment A+, cost of living A+, housing A+; Watch: amenities F, commute F, health & safety F.
- Rockridge CUSD 300 (rural): math 25% / reading 29% proficiency, ranked #257 of 620 in IL (top 42%) — low school quality limits family demand, transient renter base, plan for 1-2y turnover; only 16% free/reduced lunch — higher-income household profile.
- Zoned schools: Andalusia Elem School (math 18% / reading 27%, grade F, #934 of 2,056 statewide, top 46%, 236 students, 0% FRL); Rockridge Jr High School (math 25% / reading 26%, grade F, #322 of 665 statewide, top 49%, 233 students, 0% FRL); Rockridge High School (math 42% / reading 42%, grade F, #76 of 693 statewide, top 12%, 343 students, 0% FRL) — zoned schools average 0% FRL vs 16% district-wide (16 pts lower); this property's tenant base skews higher-income than the district average.
- Market conditions: 4 active listings in the ZIP; 116 units permitted in Rock Island County in 2024 (50 in 5+ unit buildings).
Forward outlook
- In year one you build about $7k of equity ($864 loan paydown + $6k appreciation (4.6% local appreciation)).
- Rock Island County population projected at -12% by 2050 — secular population decline; favor cash flow + early exit over multi-decade hold.
- At projected returns (4.6% appreciation + 3.0% rent growth), your $35k cash investment doubles in ~5 years — after that, you're playing with house money.
- By year 6, paydown + projected appreciation supports a ~$35k cash-out refi (75% LTV) — recoverable capital for the next deal without selling this one.
Negotiation context
- Only 0 days on market — expect competitive offers; lowballing is unlikely to land.
- 8 sale attempts since 22y ago with the ask held roughly flat each time — persistent listings suggest the price (not the market) is what's stuck; bring a comps-based counter.
Risks & watch-outs
- Watch-outs: built in 1930 — expect roof / HVAC / electrical / plumbing capex.
Questions for the listing agent
- Built in 1930 — when were the roof, HVAC, electrical panel, plumbing, and water heater last replaced?
- Is there a deadline driving the sale (1031 exchange, divorce, estate, relocation)? That informs how much negotiation room exists.
- Schools are D-rated, which usually means shorter tenancies and higher turnover. Who's the typical renter profile here, and what's been the actual vacancy rate?
- What's the average days-on-market for RENTAL listings here right now (not sales)? A rising rental-DOM trend means longer vacancies and softer asking-rent achievability than the comps imply.
- What's the recent tenant-quality profile in this submarket — average credit score on applications, eviction rate, late-payment / NSF rate, and stable-employment percentage? A property-management company in the area should have these aggregated.
- How much new for-sale + rental construction is in the pipeline within 1–3 miles? Heavy new supply typically softens prices + rents 12–24 months out; constrained supply supports both.
Investment metrics
- 1% rule
- 0.96% ✗
- Cap rate
- 6.57%
- Cash-on-cash
- 0.99%
- DSCR
- 1.04
- GRM
- 8.6
CMA / ARV
- ARV (on-the-fly)
- $140,360
- Comps found
- 5
Show comp detail 5 sales within ~0.75 mi
| Address | Dist | Beds/Ba | Sqft | Sold | Price | $/sf | Match |
|---|---|---|---|---|---|---|---|
| 101 Hartman St | 0.13mi | 3/2.0 | 1,188 (+2%) | 13mo | $146,000 | $123 | 77 |
| 507 N Bush St | 0.21mi | 3/1.5 | 1,203 (+4%) | 13mo | $230,000 | $191 | 73 |
| 606 W Edgington St | 0.40mi | 3/2.0 | 1,176 (+1%) | 10mo | $133,500 | $114 | 68 |
| 704 W Edgington St | 0.43mi | 3/1.5 | 1,112 (-4%) | 13mo | $135,100 | $121 | 62 |
| 711 W Main St | 0.51mi | 3/1.0 | 1,298 (+12%) | 10mo | $149,500 | $115 | 46 |
Match score weights: distance 35% · size 25% · config 20% · recency 20%. Top-matched comps best support the ARV.
Projected returns pro-forma
4.56% appreciation · 3.0% rent growth · sell at horizon
- IRR
- 12.6%
- Equity multiple
- 1.79×
- Total profit
- $27,585
- Equity at exit
- $67,510
- IRR
- 13.8%
- Equity multiple
- 3.39×
- Total profit
- $83,476
- Equity at exit
- $113,852
Cash invested: $35,000 (down + closing). Projections, not guarantees.
Landlord ↔ Tenant lean methodology
- Overall (STATE)
- 43 Moderately Tenant-Leaning
- State Illinois
- 43 Moderately Tenant-Leaning · D+7
- County
- — inherits STATE
- City
- — inherits STATE
ZIP-level market 61279
- Home prices YoY
- 3.4%
- Active inventory
- 4
- Price-to-rent
- 8.6×
Monthly cashflow live
- Estimated rent
- $1,205 medium interval (Pro) →
- Mortgage (P&I)
- −$656
- Tax from tax record
- −$215 /mo · $2,580/yr
- Insurance
- −$52
- HOA
- −$0
- Vacancy / Maint / Mgmt
- −$253
- Net cashflow
- $29
Break-even live
Sensitivity live
| Price | -10% $100 | -5% $64 | +0% $29 | +5% $-6 | +10% $-42 |
|---|---|---|---|---|---|
| Rent | -10% $-66 | -5% $-19 | +0% $29 | +5% $77 | +10% $124 |
| Rate | -1.0pp $92 | -0.5pp $61 | base $29 | +0.5pp $-3 | +1.0pp $-36 |
UW: 25.0% down · 7.5% · 30yr · 1.5% tax · 5.0% vac · 8.0% maint · 8.0% mgmt
Financing live
Cash to close
- Down payment
- $31,250
- Closing costs
- $3,750
- Reserves months
- —
- Total cash needed
- —
Loan-product check · same deal, 3 products live
Conventional
25% down · 7.5% · 30yr
- Down + closing
- —
- Monthly P&I
- —
- Monthly cashflow
- —
- DSCR
- —
- Eligible?
- —
Personal DTI + credit; lowest rate.
DSCR
20% down · 8.5% · 30yr
- Down + closing
- —
- Monthly P&I
- —
- Monthly cashflow
- —
- DSCR
- —
- Eligible?
- —
No personal income docs; deal must DSCR.
Hard money
10% down · 12.0% · 12mo
- Down + closing
- —
- Monthly P&I
- —
- Monthly cashflow
- —
- DSCR
- —
- Eligible?
- —
Short-term bridge; refi at stabilization.
Listing history 32 events
-
2026-05-24status Pending
-
2026-05-24status Pending
-
2026-05-23status Pending
-
2026-02-03soldstatus $125,000
-
2026-02-02soldstatus $125,000 Closed
-
2026-02-02soldstatus $125,000 Closed
-
2026-02-02soldstatus $125,000 Closed
-
2026-02-02soldstatus $125,000 Closed
-
2026-01-08status Pending
-
2026-01-06historical
-
2025-11-24status Pending
-
2025-11-22historical
-
2025-11-22historical
-
2025-10-09$125,000
-
2025-10-09Active
-
2023-09-15soldstatus $82,400 429-char remark
Show marketing remark (429 chars)
3 Bedroom, 1 and half bath, main floor laundry, 2 car garage, large yard close to the American legion in Reynolds. This home has a lot of character and charm! Needs a little TLC but will make a perfect home for the buyer looking for that small town living. All the mechanicals are newer. Furnace, A/C, hot water heater, electrical panel and the half bath was added after seller purchased this home. Home is being sold as is.
-
2023-09-15soldstatus $82,400 Closed 429-char remark
Show marketing remark (429 chars)
3 Bedroom, 1 and half bath, main floor laundry, 2 car garage, large yard close to the American legion in Reynolds. This home has a lot of character and charm! Needs a little TLC but will make a perfect home for the buyer looking for that small town living. All the mechanicals are newer. Furnace, A/C, hot water heater, electrical panel and the half bath was added after seller purchased this home. Home is being sold as is.
-
2023-08-10status Pending 429-char remark
Show marketing remark (429 chars)
3 Bedroom, 1 and half bath, main floor laundry, 2 car garage, large yard close to the American legion in Reynolds. This home has a lot of character and charm! Needs a little TLC but will make a perfect home for the buyer looking for that small town living. All the mechanicals are newer. Furnace, A/C, hot water heater, electrical panel and the half bath was added after seller purchased this home. Home is being sold as is.
-
2023-07-13$89,000 429-char remark
Show marketing remark (429 chars)
3 Bedroom, 1 and half bath, main floor laundry, 2 car garage, large yard close to the American legion in Reynolds. This home has a lot of character and charm! Needs a little TLC but will make a perfect home for the buyer looking for that small town living. All the mechanicals are newer. Furnace, A/C, hot water heater, electrical panel and the half bath was added after seller purchased this home. Home is being sold as is.
-
2023-07-13$89,000 Active 429-char remark
Show marketing remark (429 chars)
3 Bedroom, 1 and half bath, main floor laundry, 2 car garage, large yard close to the American legion in Reynolds. This home has a lot of character and charm! Needs a little TLC but will make a perfect home for the buyer looking for that small town living. All the mechanicals are newer. Furnace, A/C, hot water heater, electrical panel and the half bath was added after seller purchased this home. Home is being sold as is.
-
2021-08-06historical
-
2015-09-30soldstatus $75,000
-
2015-09-30soldstatus $75,000
-
2015-09-30soldstatus $75,000
-
2015-05-28$79,900
-
2015-05-28$79,900
-
2005-09-16soldstatus $79,500
-
2005-09-06soldstatus $79,500
-
2005-05-11$82,000
-
2004-06-11soldstatus $75,000
-
2004-06-10soldstatus $75,000
-
2004-03-18$79,900
ⓘ Source: listings_history table (triggers on properties + properties_extension) + one-shot
backfill from property_details.listing_events for pre-trigger history.
Tax reassessment forecast IL · Partial reset (capped growth)
- Current annual tax
- $2,580 · $215/mo
- Projected year-2 tax
- $2,709 · $226/mo
- Expected delta
- +$129/yr (+$11/mo · 5.0%)
ⓘ Screening estimate from a state-policy table — verify with the county assessor before closing.
Climate risk First Street
- Flood 1/10 Low FEMA zone X (unshaded) · 0% chance over 30 yrs
- Wildfire 1/10 Low
- Heat 3/10 Moderate 7 d/yr ≥103°F today · 16 d/yr by 30 yrs out
- Wind 2/10 Low
- Air quality 2/10 Low 2 unhealthy d/yr today · 2 by 30 yrs out
Nearby sold comps map
Loading sold comps map…
Walkable amenities ~0.75 mi
Loading nearby amenities…
Taxation est. · year 1
- Rental income
- $14,455
- − Mortgage interest
- −$7,002
- − Property taxes
- −$2,580
- − Insurance
- −$625
- − Repairs & maintenance
- −$1,156
- − Management
- −$1,156
- − Depreciation
- −$3,636
- Taxable loss
- −$1,702
- Est. tax savings @ 24.0%
- +$408
- After-tax cash flow
- $756/yr
For passive investors: Depreciation is non-cash, so a rental often shows a tax loss while cash-flowing — sheltering income. Rental losses are passive: they offset passive income freely, and up to $25,000/yr can offset ordinary (W-2) income if you actively participate and your MAGI is under $100k (phasing out to $0 by $150k); unused losses carry forward. On sale, claimed depreciation is recaptured at up to 25%, and gains may owe capital-gains tax (a 1031 exchange can defer both). Figures are a year-1 estimate at your 24.0% rate — not tax advice; consult a CPA.
Schools (NCES district)
- District
- Rockridge CUSD 300
- NCES district ID
- 1734440
- Math proficiency
- 25% ▼ -3.00%
- Reading proficiency
- 29% ▼ -3.00%
- Median HH income
- $68,124
- Composite
- 25.44/100
- National rank
- #7451
- State rank
- #257 of 620 in IL
Livability — Reynolds
- Score
- 65/100
- State rank
- #660
- US rank
- #13542
Category grades
Schools grade is shown separately in the Schools card above.
Census & demographics
- Census place
- Reynolds, IL
- Population (ZIP)
- 960
Population outlook (Rock Island County) Hauer SSP2
- Today (2025)
- 140,982 people
- By 2030
- 137,705 · -2.3%
- By 2040
- 130,512 · -7.4%
- By 2050
- 123,841 · -12.2%
- By 2075
- 109,851 · -22.1%
- By 2100
- 90,922 · -35.5%
Race, ethnicity, and origin ACS 2023
- Neighborhood character
- Predominantly White (97%)
- Race & ethnicity
- White 97% Two or more races 2%
- Common ancestry
- English 8% Serbian 2% Portuguese 1%
- Foreign-born
- 1% · China, Vietnam
Political lean MEDSL · Rock Island
- 2024 margin
- Lean D (+9.6) · D 53.9% · R 44.4% · Other 1.7%
- 2008→2024 swing
- -15.0pp toward R · 2008: 24.6pp · 2024: 9.6pp
- All cycles
- 2024: D+9.6 2020: D+12.1 2016: D+8.4 2012: D+21.9 2008: D+24.6
Not yet ingested
- Civics
- —
Market trends
- HPI YoY
- ▲ 4.56%
- Current HPI
- 139.5821
- Rent YoY
- —
- Metro
- —
- State GDP YoY
- ▲ 1.59%
- F500 in state
- 60
Industry mix (Fortune 500 HQ in IL)
| Industry | F500 HQs | Revenue |
|---|---|---|
| Insurance | 4 | $201B |
|
||
| Consumer Goods | 4 | $87B |
|
||
| Industrial Machinery | 3 | $64B |
|
||
| Healthcare | 2 | $55B |
|
||
| Retail / Pharmacy | 1 | $148B |
|
||
| Agriculture / Food | 1 | $86B |
|
||
Price history
+56.4% since first listed32 events — show timeline
- 2026-05-24 Pending — MRED as Distributed by MLS Grid
- 2026-05-24 Pending — MRED as Distributed by MLS Grid
- 2026-05-23 Pending — MRED as Distributed by MLS Grid
- 2026-02-03 Sold (Public Records) $125,000 Public Records
- 2026-02-02 Sold (MLS) $125,000 MRED as Distributed by MLS Grid
- 2026-02-02 Sold (MLS) $125,000 MRED as Distributed by MLS Grid
- 2026-02-02 Sold (MLS) $125,000 MRED as Distributed by MLS Grid
- 2026-02-02 Sold (MLS) $125,000 MRED as Distributed by MLS Grid
- 2026-01-08 Pending — MRED as Distributed by MLS Grid
- 2026-01-06 Listing Removed — MRED as Distributed by MLS Grid
- 2025-11-24 Pending — RMLSA as Distributed by MLS Grid
- 2025-11-22 Listing Removed — RMLSA as Distributed by MLS Grid
- 2025-11-22 Listing Removed — MRED as Distributed by MLS Grid
- 2025-10-09 Listed — RMLSA as Distributed by MLS Grid
- 2025-10-09 Listed $125,000 MRED as Distributed by MLS Grid
- 2023-09-15 Sold (MLS) $82,400 RMLSA as Distributed by MLS Grid
- 2023-09-15 Sold (MLS) $82,400 MRED as Distributed by MLS Grid
- 2023-08-10 Pending — RMLSA as Distributed by MLS Grid
- 2023-07-13 Listed $89,000 RMLSA as Distributed by MLS Grid
- 2023-07-13 Listed $89,000 MRED as Distributed by MLS Grid
- 2021-08-06 Listing Removed — RMLSA as Distributed by MLS Grid
- 2015-09-30 Sold (Public Records) $75,000 Public Records
- 2015-09-30 Sold (MLS) $75,000 MRED as Distributed by MLS Grid
- 2015-09-30 Sold (MLS) $75,000 RMLSA as Distributed by MLS Grid
- 2015-05-28 Listed $79,900 MRED as Distributed by MLS Grid
- 2015-05-28 Listed $79,900 RMLSA as Distributed by MLS Grid
- 2005-09-16 Sold (Public Records) $79,500 Public Records
- 2005-09-06 Sold (MLS) $79,500 RMLSA as Distributed by MLS Grid
- 2005-05-11 Listed $82,000 RMLSA as Distributed by MLS Grid
- 2004-06-11 Sold (Public Records) $75,000 Public Records
- 2004-06-10 Sold (MLS) $75,000 RMLSA as Distributed by MLS Grid
- 2004-03-18 Listed $79,900 RMLSA as Distributed by MLS Grid
Property tax history
+1.6%/yrLatest (2024): $2,580 · +8.7% YoY. Source: county tax records.
Cash-flow waterfall
monthlySold comps — $/sqft
last 12 mo · ≤1 miLoading sold comps…