2312 Reeder Dr · Lake Isabella, CA
Flood risk 3/10 · Minor
- FEMA flood zone
- X (unshaded)
- Chance of flooding over 30 yrs
- 0.2%
- Est. flood insurance / yr
- $507 – $1,088
Fire risk 9/10 · Severe
- Est. fire insurance / yr
- $659 – $1,223
Heat risk 6/10 · Moderate
- Hot days now (above 93°F)
- 10 days/yr
- Hot days in 30 yrs
- 27 days/yr
Wind risk 1/10 · Minimal
- Chance of severe wind over 30 yrs
- —
Air-quality risk 10/10 · Severe
- Unhealthy air days now
- 24 days/yr
- Unhealthy air days in 30 yrs
- 30 days/yr
Risk factors via First Street. Map © Google.
Why this score? — see what drove the B- grade
The composite is a weighted blend of 9 inputs, each scored 0–100. Each bar is that input's sub-score; the figure is the points it added to the 100-point composite (weight × sub-score).
- Cash flow +30.0/30.0
- 1% rule +10.0/10.0
- DSCR +10.0/10.0
- Appreciation +7.8/10.0
- Schools +2.6/10.0
- Livability +2.6/5.0
- Rent growth +2.5/5.0
- Condition / age +2.5/5.0
- ARV discount +0.0/15.0
$95,000
🖨 Deal sheet 📄 Offer letter ✓ Due diligence
Listing remarks MLS
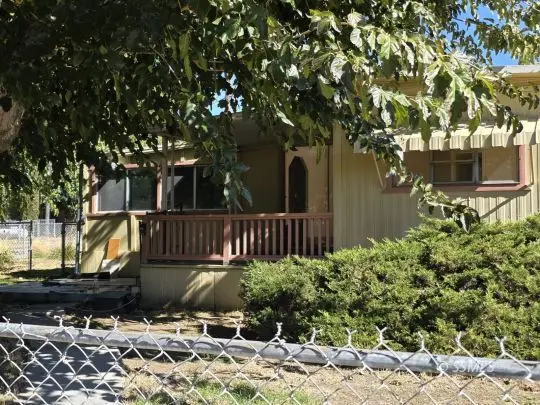
Situated on a nice corner lot, this older 2 bedroom, 1-1/2 bath mobile home offers great potential with a few upgrades. The fully fenced yard provides privacy and plenty of space, featuring a charming front-yard gazebo perfect for entertaining or relaxing. Enjoy the extra large garage for parking or storage, and a spacious enclosed awning area with a pellet stove-perfect for those cozy evenings and added ambiance. Whether you are looking for a starter home or a solid rental investment, this property offers both value and versatility.
Key facts
- Front-yard gazebo
- Extra large garage
- Pellet stove
Tags
Neighborhood map
What this means for you Summary
Snapshot
- This is a 2-bed/1.5-bath single-family listed at $95k.
Deal economics
- At list price, monthly cash flow is $525 ($6k/yr) — positive.
- The deal already cash-flows at list — no discount required.
- Meets the 1% rule at list price ($2k rent vs $95k).
- Recommended offer: $84k (12.0% below list) — sets the bar for market timing.
- Cap rate 12.9% vs local median 7.4% in Lake Isabella — top-decile yield for the area; either an underpriced asset or a hidden risk that comps aren't pricing in. Stress-test before assuming the spread holds.
Location & tenants
- Location reads 52/100 on livability (#999 in CA) — a working-class tenant base; expect higher turnover. Strengths: housing A, cost of living B+; Watch: crime C-, schools F, amenities F.
- Kernville Union Elementary (rural): math 20% / reading 37% proficiency, ranked #1,128 of 1,400 in CA (top 81%) — low school quality limits family demand, transient renter base, plan for 1-2y turnover; 65% free/reduced lunch — lower-income household profile, screen leases tightly.
- Market conditions: 135 active listings in the ZIP; 3,244 units permitted in Kern County in 2024 (73 in 5+ unit buildings).
Forward outlook
- In year one you build about $6k of equity ($657 loan paydown + $5k appreciation (5.5% local appreciation)).
- Kern County population projected at +17% by 2050 — long-run rental-demand tailwind backs the buy-and-hold thesis.
- At projected returns (5.5% appreciation + 3.0% rent growth), your $27k cash investment doubles in ~3 years — after that, you're playing with house money.
- By year 6, paydown + projected appreciation supports a ~$32k cash-out refi (75% LTV) — recoverable capital for the next deal without selling this one.
Negotiation context
- It's been on market 226 days — a 12% lower offer ($84k) is reasonable based on typical stale-listing flexibility.
- 2 sale attempts; this cycle's ask has dropped $20k (17%) from the opening price — seller is motivated, your offer sets the floor, not the list.
Risks & watch-outs
- Climate carrying-cost: severe wildfire risk; extreme-heat days projected 10→27/yr by 2055 (HVAC capex compounding) — expect insurance premiums to compound above CPI over the hold.
Questions for the listing agent
- It's been on market 226 days. Have you received any prior offers? Is the seller open to a 12% concession, seller financing, or rate buy-down credit?
- Built in 1967 — when were the roof, HVAC, electrical panel, plumbing, and water heater last replaced?
- Why hasn't it sold? Are there any deal-killer items the seller is aware of (foundation, flood, title, zoning, code violations)?
- Is there a deadline driving the sale (1031 exchange, divorce, estate, relocation)? That informs how much negotiation room exists.
- Schools are F-rated, which usually means shorter tenancies and higher turnover. Who's the typical renter profile here, and what's been the actual vacancy rate?
- What's the average days-on-market for RENTAL listings here right now (not sales)? A rising rental-DOM trend means longer vacancies and softer asking-rent achievability than the comps imply.
- What's the recent tenant-quality profile in this submarket — average credit score on applications, eviction rate, late-payment / NSF rate, and stable-employment percentage? A property-management company in the area should have these aggregated.
- How much new for-sale + rental construction is in the pipeline within 1–3 miles? Heavy new supply typically softens prices + rents 12–24 months out; constrained supply supports both.
Investment metrics
- 1% rule
- 1.58% ✓
- Cap rate
- 12.93%
- Cash-on-cash
- 23.70%
- DSCR
- 2.05
- GRM
- 5.3
CMA / ARV
- ARV (median comp)
- $71,170
- List price
- $95,000
- Delta
- 33.48%
- Verdict
- OVERPRICED
- Comps
- 20 within 1.0 mi
Show comp detail 5 sales within ~0.75 mi
| Address | Dist | Beds/Ba | Sqft | Sold | Price | $/sf | Match |
|---|---|---|---|---|---|---|---|
| 2348 Sweetwater Dr | 0.29mi | 3/1.0 (+1) | 960 (-4%) | 3mo | $197,500 | $206 | 70 |
| 2013 Kem | 0.41mi | 2/1.0 | 926 (-7%) | 8mo | $115,000 | $124 | 60 |
| 2032 Rainbow Dr | 0.38mi | 2/1.0 | 1,128 (+13%) | 1mo | $178,500 | $158 | 58 |
| 2216 Angler Ave | 0.52mi | 2/1.0 | 929 (-7%) | 23mo | $150,000 | $161 | 43 |
| 2612 Flower St | 0.64mi | 2/1.0 | 926 (-7%) | 18mo | $186,800 | $202 | 41 |
Match score weights: distance 35% · size 25% · config 20% · recency 20%. Top-matched comps best support the ARV.
Projected returns pro-forma
5.55% appreciation · 3.0% rent growth · sell at horizon
- IRR
- 34.5%
- Equity multiple
- 3.20×
- Total profit
- $58,400
- Equity at exit
- $57,041
- IRR
- 32.5%
- Equity multiple
- 6.50×
- Total profit
- $146,365
- Equity at exit
- $101,205
Cash invested: $26,600 (down + closing). Projections, not guarantees.
Landlord ↔ Tenant lean methodology
- Overall (STATE)
- 18 Strongly Tenant-Friendly
- State California
- 18 Strongly Tenant-Friendly · D+13
- County
- — inherits STATE
- City
- — inherits STATE
ZIP-level market 93240
- Home prices YoY
- 1.6%
- Active inventory
- 135
- Price-to-rent
- 5.3×
Monthly cashflow live
- Estimated rent
- $1,502 medium interval (Pro) →
- Mortgage (P&I)
- −$498
- Tax from tax record
- −$124 /mo · $1,485/yr
- Insurance
- −$40
- HOA
- −$0
- Vacancy / Maint / Mgmt
- −$316
- Net cashflow
- $525
Break-even live
UW: 25.0% down · 7.5% · 30yr · 1.5% tax · 5.0% vac · 8.0% maint · 8.0% mgmt
Financing live
Cash to close
- Down payment
- $23,750
- Closing costs
- $2,850
- Reserves months
- —
- Total cash needed
- —
Loan-product check · same deal, 3 products live
Conventional
25% down · 7.5% · 30yr
- Down + closing
- —
- Monthly P&I
- —
- Monthly cashflow
- —
- DSCR
- —
- Eligible?
- —
Personal DTI + credit; lowest rate.
DSCR
20% down · 8.5% · 30yr
- Down + closing
- —
- Monthly P&I
- —
- Monthly cashflow
- —
- DSCR
- —
- Eligible?
- —
No personal income docs; deal must DSCR.
Hard money
10% down · 12.0% · 12mo
- Down + closing
- —
- Monthly P&I
- —
- Monthly cashflow
- —
- DSCR
- —
- Eligible?
- —
Short-term bridge; refi at stabilization.
Listing history 19 events
-
2026-06-18days on market $95,000 Active 226 DOM
-
2026-06-17days on market $95,000 Active 225 DOM
-
2026-06-16days on market $95,000 Active 224 DOM
-
2026-06-15days on market $95,000 Active 223 DOM
-
2026-06-14days on market $95,000 Active 221 DOM
-
2026-06-13days on market $95,000 Active 220 DOM
-
2026-06-10days on market $95,000 Active 218 DOM
-
2026-06-09days on market $95,000 Active 217 DOM
-
2026-06-08days on market $95,000 Active 216 DOM
-
2026-06-07days on market $95,000 Active 215 DOM
-
2026-06-05days on market $95,000 Active 212 DOM
-
2026-06-03days on market $95,000 Active 211 DOM
-
2026-06-03days on market $95,000 Active 210 DOM
-
2026-06-01days on market $95,000 Active 209 DOM
-
2026-05-31days on market $95,000 Active 208 DOM
-
2026-05-04price $95,000 539-char remark
Show marketing remark (539 chars)
Situated on a nice corner lot, this older 2 bedroom, 1-1/2 bath mobile home offers great potential with a few upgrades. The fully fenced yard provides privacy and plenty of space, featuring a charming front-yard gazebo perfect for entertaining or relaxing. Enjoy the extra large garage for parking or storage, and a spacious enclosed awning area with a pellet stove-perfect for those cozy evenings and added ambiance. Whether you are looking for a starter home or a solid rental investment, this property offers both value and versatility.
-
2026-03-29status Active 539-char remark
Show marketing remark (539 chars)
Situated on a nice corner lot, this older 2 bedroom, 1-1/2 bath mobile home offers great potential with a few upgrades. The fully fenced yard provides privacy and plenty of space, featuring a charming front-yard gazebo perfect for entertaining or relaxing. Enjoy the extra large garage for parking or storage, and a spacious enclosed awning area with a pellet stove-perfect for those cozy evenings and added ambiance. Whether you are looking for a starter home or a solid rental investment, this property offers both value and versatility.
-
2025-12-30price $105,000 539-char remark
Show marketing remark (539 chars)
Situated on a nice corner lot, this older 2 bedroom, 1-1/2 bath mobile home offers great potential with a few upgrades. The fully fenced yard provides privacy and plenty of space, featuring a charming front-yard gazebo perfect for entertaining or relaxing. Enjoy the extra large garage for parking or storage, and a spacious enclosed awning area with a pellet stove-perfect for those cozy evenings and added ambiance. Whether you are looking for a starter home or a solid rental investment, this property offers both value and versatility.
-
2025-10-27$115,000 Active 539-char remark
Show marketing remark (539 chars)
Situated on a nice corner lot, this older 2 bedroom, 1-1/2 bath mobile home offers great potential with a few upgrades. The fully fenced yard provides privacy and plenty of space, featuring a charming front-yard gazebo perfect for entertaining or relaxing. Enjoy the extra large garage for parking or storage, and a spacious enclosed awning area with a pellet stove-perfect for those cozy evenings and added ambiance. Whether you are looking for a starter home or a solid rental investment, this property offers both value and versatility.
ⓘ Source: listings_history table (triggers on properties + properties_extension) + one-shot
backfill from property_details.listing_events for pre-trigger history.
Tax reassessment forecast CA · Resets to sale price
- Current annual tax
- $1,485 · $124/mo
- Projected year-2 tax
- $1,485 · $124/mo
- Expected delta
- $0/yr ($0/mo · 0.0%)
ⓘ Screening estimate from a state-policy table — verify with the county assessor before closing.
Climate risk First Street
- Flood 3/10 Moderate FEMA zone X (unshaded) · 20% chance over 30 yrs
- Wildfire 9/10 Extreme
- Heat 6/10 Major 10 d/yr ≥93°F today · 27 d/yr by 30 yrs out
- Wind 1/10 Low
- Air quality 10/10 Extreme 24 unhealthy d/yr today · 30 by 30 yrs out
Nearby sold comps map
Loading sold comps map…
Walkable amenities ~0.75 mi
Loading nearby amenities…
Taxation est. · year 1
- Rental income
- $18,029
- − Mortgage interest
- −$5,321
- − Property taxes
- −$1,485
- − Insurance
- −$475
- − Repairs & maintenance
- −$1,442
- − Management
- −$1,442
- − Depreciation
- −$2,764
- Taxable income
- $5,100
- Est. tax owed @ 24.0%
- −$1,224
- After-tax cash flow
- $5,081/yr
For passive investors: Depreciation is non-cash, so a rental often shows a tax loss while cash-flowing — sheltering income. Rental losses are passive: they offset passive income freely, and up to $25,000/yr can offset ordinary (W-2) income if you actively participate and your MAGI is under $100k (phasing out to $0 by $150k); unused losses carry forward. On sale, claimed depreciation is recaptured at up to 25%, and gains may owe capital-gains tax (a 1031 exchange can defer both). Figures are a year-1 estimate at your 24.0% rate — not tax advice; consult a CPA.
Schools (NCES district)
- District
- Kernville Union Elementary
- NCES district ID
- 0619590
- Math proficiency
- 20% ▲ 4.00%
- Reading proficiency
- 37% ▲ 11.00%
- Median HH income
- $29,896
- Composite
- 25.91/100
- National rank
- #12766
- State rank
- #1128 of 1400 in CA
Livability — Lake Isabella
- Score
- 52/100
- State rank
- #999
- US rank
- #24814
Category grades
Schools grade is shown separately in the Schools card above.
Census & demographics
- Census place
- Lake Isabella, CA
- City population
- 5,622
- Population (ZIP)
- 5,622
Population outlook (Kern County) Hauer SSP2
- Today (2025)
- 947,286 people
- By 2030
- 978,984 · +3.3%
- By 2040
- 1,045,018 · +10.3%
- By 2050
- 1,105,232 · +16.7%
- By 2075
- 1,229,538 · +29.8%
- By 2100
- 1,238,059 · +30.7%
Race, ethnicity, and origin ACS 2023
- Neighborhood character
- Predominantly White (78%)
- Race & ethnicity
- White 78% Hispanic / Latino 13% Two or more races 5% Asian 2% Native American 1%
- Hispanic origin (detail)
- Mexican 11%
- Common ancestry
- Italian 3% Portuguese 2% Iranian 2%
- Foreign-born
- 5% · Canada, South Korea
- Languages at home
- 93% English-only · Spanish 4% Korean 1% Other Asian/Pacific 1%
Political lean MEDSL · Kern
- 2024 margin
- Strong R (+21.1) · D 38.2% · R 59.3% · Other 2.5%
- 2008→2024 swing
- -3.3pp toward R · 2008: -17.8pp · 2024: -21.1pp
- All cycles
- 2024: R+21.1 2020: R+10.2 2016: R+15.0 2012: R+20.9 2008: R+17.8
Not yet ingested
- Civics
- —
Market trends
- HPI YoY
- ▲ 5.55%
- Current HPI
- 341.2481
- Rent YoY
- —
- Metro
- —
- State GDP YoY
- ▲ 3.21%
- F500 in state
- 116
Industry mix (Fortune 500 HQ in CA)
| Industry | F500 HQs | Revenue |
|---|---|---|
| Technology | 27 | $1,492B |
|
||
| Financial Services | 3 | $174B |
|
||
| Retail | 3 | $44B |
|
||
| Insurance | 3 | $26B |
|
||
| Media / Entertainment | 2 | $115B |
|
||
| Pharmaceuticals / Biotech | 2 | $62B |
|
||
Price history
-17.4% since first listed4 events — show timeline
- 2026-05-04 Price Changed $95,000 SSMLS
- 2026-03-29 Relisted — SSMLS
- 2025-12-30 Price Changed $105,000 SSMLS
- 2025-10-27 Listed $115,000 SSMLS
Property tax history
+1.6%/yrLatest (2025): $1,485 · +1.4% YoY. Source: county tax records.
Cash-flow waterfall
monthlySold comps — $/sqft
last 12 mo · ≤1 miLoading sold comps…