350 E San Jacinto #133 · Perris, CA
Flood risk 4/10 · Minor
- FEMA flood zone
- X (unshaded)
- Chance of flooding over 30 yrs
- 0.2%
- Est. flood insurance / yr
- $507 – $1,088
Fire risk 8/10 · Major
- Est. fire insurance / yr
- $659 – $1,223
Heat risk 7/10 · Major
- Hot days now (above 104°F)
- 7 days/yr
- Hot days in 30 yrs
- 19 days/yr
Wind risk 1/10 · Minimal
- Chance of severe wind over 30 yrs
- —
Air-quality risk 5/10 · Moderate
- Unhealthy air days now
- 8 days/yr
- Unhealthy air days in 30 yrs
- 10 days/yr
Risk factors via First Street. Map © Google.
Why this score? — see what drove the B+ grade
The composite is a weighted blend of 9 inputs, each scored 0–100. Each bar is that input's sub-score; the figure is the points it added to the 100-point composite (weight × sub-score).
- Cash flow +30.0/30.0
- ARV discount +15.0/15.0
- 1% rule +10.0/10.0
- DSCR +10.0/10.0
- Rent growth +4.4/5.0
- Livability +3.4/5.0
- Schools +3.0/10.0
- Condition / age +2.5/5.0
- Appreciation +0.0/10.0
$80,888
🖨 Deal sheet 📄 Offer letter ✓ Due diligence
Listing remarks
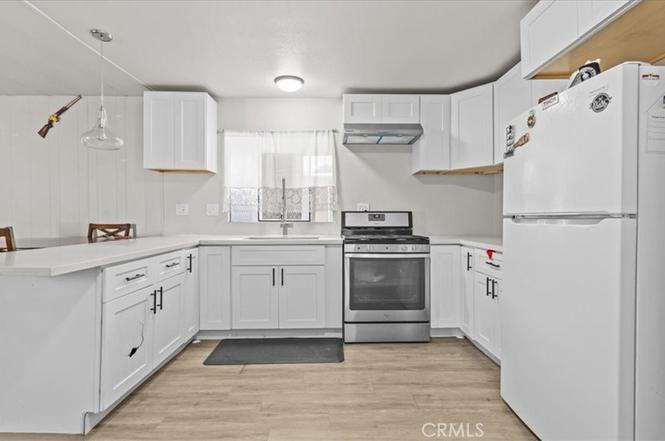
Welcome to one of the best values in Perris. This updated two bedroom two bath manufactured home offers modern upgrades affordability and a desirable community lifestyle making it an excellent opportunity for owner occupants or downsizers. Renovations completed in 2022 include new laminate flooring throughout a fully remodeled kitchen with quartz countertops soft close cabinetry and drawers a new stove and updated fixtures. The open living area features a mini split system providing efficient and controlled temperature comfort year round. Both bathrooms have been upgraded with newer vanities offering a clean modern look. Priced under $90,000 this is one of the lowest priced mobile homes cur
Key facts
- Quartz countertops
- Newer vanities
- Soft close cabinetry
Tags
Property features AI
Finance
- Other: Rent may include pool (see remarks)
- Financial info: Land lease (amount listed separately)
- HOA & community: Community amenities: pool, spa, clubhouse, sport court, multipurpose/recreation room, gym/exercise room, playground
Exterior
- Parking: Carport; Has parking; Located in Lake Perris Village park
- Security: Controlled access (community)
- Utilities: Public sewer; District/public water
- Home design: Single-family / single body type; Single story; Mobile home remains on site; Front-facing entry
- Construction: Year built per public records
- Exterior features: Community in-ground pool; Park nearby; No landscaping
Interior
- Bedrooms: Entry level is on the first floor
- Bathrooms: 2 full bathrooms
- Heating & cooling: Central furnace heating
- Interior features: Front entry; One-level home; Community spa (in-ground)
- Laundry & utility: Indoor laundry with washer hookup; Gas dryer hookup
Neighborhood map
What this means for you Summary
Snapshot
- This is a 2-bed/2.0-bath manufactured listed at $81k.
Deal economics
- At list price, monthly cash flow is $1k ($14k/yr) — positive.
- The deal already cash-flows at list — no discount required.
- Meets the 1% rule at list price ($2k rent vs $81k).
- Recommended offer: $74k (9.0% below list) — sets the bar for market timing.
- Cap rate 23.6% vs local median 3.7% in Perris — top-decile yield for the area; either an underpriced asset or a hidden risk that comps aren't pricing in. Stress-test before assuming the spread holds.
Location & tenants
- Location reads 67/100 on livability (#322 in CA) — a middle-class / working-renter tenant base. Strengths: housing A+, commute B; Watch: crime C-, health & safety D, schools F.
- Perris Union High (suburban): math 21% / reading 48% proficiency, ranked #282 of 517 in CA (top 54%) — families likely to look elsewhere, expect single-tenant / working-renter base with shorter leases; 72% free/reduced lunch — lower-income household profile, screen leases tightly.
- Market conditions: Rents rising fast (+7.7%/yr); 136 active listings in the ZIP; 8 comparable units currently listed for rent nearby; rentals leasing fast (median 2d on market — plan ~1-2 weeks tenant-placement turnaround); solid renter incomes; 9,195 units permitted in Riverside County in 2024 (1,512 in 5+ unit buildings).
Forward outlook
- Local home prices are declining (-3.0%/yr); year-one equity from $559 of loan paydown is wiped out by about $2k of value loss. Plan a longer hold.
- Riverside County population projected at +22% by 2050 — long-run rental-demand tailwind backs the buy-and-hold thesis.
- At projected returns (-3.0% appreciation + 7.7% rent growth), your $23k cash investment doubles in ~2 years — after that, you're playing with house money.
Negotiation context
- It's been on market 114 days — a 9% lower offer ($74k) is reasonable based on typical stale-listing flexibility.
- 4 sale attempts; this cycle's ask has dropped $8k (9%) from the opening price — seller is motivated, your offer sets the floor, not the list.
Risks & watch-outs
- Climate carrying-cost: severe wildfire risk; extreme-heat days projected 7→19/yr by 2055 (HVAC capex compounding) — expect insurance premiums to compound above CPI over the hold.
Questions for the listing agent
- It's been on market 114 days. Have you received any prior offers? Is the seller open to a 9% concession, seller financing, or rate buy-down credit?
- Why hasn't it sold? Are there any deal-killer items the seller is aware of (foundation, flood, title, zoning, code violations)?
- Is there a deadline driving the sale (1031 exchange, divorce, estate, relocation)? That informs how much negotiation room exists.
- Schools are F-rated, which usually means shorter tenancies and higher turnover. Who's the typical renter profile here, and what's been the actual vacancy rate?
- What's the average days-on-market for RENTAL listings here right now (not sales)? A rising rental-DOM trend means longer vacancies and softer asking-rent achievability than the comps imply.
- What's the recent tenant-quality profile in this submarket — average credit score on applications, eviction rate, late-payment / NSF rate, and stable-employment percentage? A property-management company in the area should have these aggregated.
- How much new for-sale + rental construction is in the pipeline within 1–3 miles? Heavy new supply typically softens prices + rents 12–24 months out; constrained supply supports both.
Investment metrics
- 1% rule
- 2.70% ✓
- Cap rate
- 23.58%
- Cash-on-cash
- 61.75%
- DSCR
- 3.75
- GRM
- 3.1
CMA / ARV
- ARV (on-the-fly)
- $113,750
- Comps found
- 4
Show comp detail 4 sales within ~0.75 mi
| Address | Dist | Beds/Ba | Sqft | Sold | Price | $/sf | Match |
|---|---|---|---|---|---|---|---|
| 350 E San Jacinto Ave #145 | 0.00mi | 2/2.0 | 1,000 (+10%) | 12mo | $96,600 | $97 | 73 |
| 350 E San Jacinto Ave #150 | 0.00mi | 3/2.0 (+1) | 864 (-5%) | 18mo | $105,000 | $122 | 72 |
| 350 E San Jacinto Ave #217 | 0.00mi | 3/1.0 (+1) | 800 (-12%) | 23mo | $99,999 | $125 | 52 |
| 350 E San Jacinto Ave #112 | 0.00mi | 3/2.0 (+1) | 1,040 (+14%) | 24mo | $130,000 | $125 | 52 |
Match score weights: distance 35% · size 25% · config 20% · recency 20%. Top-matched comps best support the ARV.
Projected returns pro-forma
-3.0% appreciation · 7.69% rent growth · sell at horizon
- IRR
- 65.9%
- Equity multiple
- 4.18×
- Total profit
- $71,948
- Equity at exit
- $12,061
- IRR
- 71.7%
- Equity multiple
- 10.15×
- Total profit
- $207,155
- Equity at exit
- $6,994
Cash invested: $22,649 (down + closing). Projections, not guarantees.
Landlord ↔ Tenant lean methodology
- Overall (STATE)
- 18 Strongly Tenant-Friendly
- State California
- 18 Strongly Tenant-Friendly · D+13
- County
- — inherits STATE
- City
- — inherits STATE
ZIP-level market 92571
- Home prices YoY
- -9.4%
- Rents YoY
- 7.7%
- Active inventory
- 136
- Price-to-rent
- 3.1×
Monthly cashflow live
- Estimated rent
- $2,183 high interval (Pro) →
- Mortgage (P&I)
- −$424
- Tax est. 1.5%
- −$101 /mo · $1,213/yr
- Insurance
- −$34
- HOA
- −$0
- Vacancy / Maint / Mgmt
- −$458
- Net cashflow
- $1,166
Break-even live
UW: 25.0% down · 7.5% · 30yr · 1.5% tax · 5.0% vac · 8.0% maint · 8.0% mgmt
Financing live
Cash to close
- Down payment
- $20,222
- Closing costs
- $2,427
- Reserves months
- —
- Total cash needed
- —
Loan-product check · same deal, 3 products live
Conventional
25% down · 7.5% · 30yr
- Down + closing
- —
- Monthly P&I
- —
- Monthly cashflow
- —
- DSCR
- —
- Eligible?
- —
Personal DTI + credit; lowest rate.
DSCR
20% down · 8.5% · 30yr
- Down + closing
- —
- Monthly P&I
- —
- Monthly cashflow
- —
- DSCR
- —
- Eligible?
- —
No personal income docs; deal must DSCR.
Hard money
10% down · 12.0% · 12mo
- Down + closing
- —
- Monthly P&I
- —
- Monthly cashflow
- —
- DSCR
- —
- Eligible?
- —
Short-term bridge; refi at stabilization.
Rent comps 8 comps
| Address | Beds | Baths | Sqft | Rent | $/sqft | DOM | Units | Dist |
|---|---|---|---|---|---|---|---|---|
| 342 Wilkerson Ave Perris, CA | 2.0 | 2.0 | 920 | $1,595 | $1.73 | 1d | 1 | 0.28mi |
| 290 Wilson Ave Perris, CA | 1.0–3.0 | 1.0–2.0 | 875 | $1,738 | $1.98 | 1d | 7 | 0.34mi |
| 1093 Johns Rd Perris, CA | 3.0 | 2.0 | 1100 | $2,500 | $2.27 | 14d | 1 | 0.84mi |
| 1355 S Perris Blvd Perris, CA | 2.0 | 1.0 | 962 | $1,975 | $2.05 | 1d | 1 | 1.01mi |
| 1687 Sycamore St Perris, CA | 3.0 | 2.0 | 1100 | $7,500 | $6.82 | 1d | 1 | 1.44mi |
| 1188 Witt St Perris, CA | 2.0 | 1.0 | 900 | $2,800 | $3.11 | 1d | 1 | 1.45mi |
| 2036 Orchard Dr Perris, CA | 2.0 | 2.0 | 1005 | $2,095 | $2.08 | 2d | 1 | 1.48mi |
| 2036 Orchard Dr Perris, CA | 2.0 | 2.0 | 1005 | $2,095 | $2.08 | 1d | 1 | 1.48mi |
Listing history 24 events
-
2026-06-18days on market $80,888 Active 114 DOM
-
2026-06-17days on market $80,888 Active 113 DOM
-
2026-06-16days on market $80,888 Active 112 DOM
-
2026-06-15days on market $80,888 Active 111 DOM
-
2026-06-13days on market $80,888 Active 109 DOM
-
2026-06-13days on market $80,888 Active 108 DOM
-
2026-06-09days on market $80,888 Active 105 DOM
-
2026-06-08days on market $80,888 Active 104 DOM
-
2026-06-07days on market $80,888 Active 103 DOM
-
2026-06-04days on market $80,888 Active 100 DOM
-
2026-06-03pricedays on market $80,888 Active 99 DOM
-
2026-06-02days on market $88,800 Active 98 DOM
-
2026-06-01days on market $88,800 Active 97 DOM
-
2026-05-31days on market $88,800 Active 96 DOM
-
2026-02-24$88,800 Active
-
2025-09-30historical
-
2025-09-01$94,900 Active
-
2025-08-31historical
-
2025-08-22price $95,000
-
2025-06-19price $99,999
-
2025-04-21$120,000 Active
-
2025-03-10historical
-
2025-01-11price $120,000
-
2025-01-10$12,000 Active
ⓘ Source: listings_history table (triggers on properties + properties_extension) + one-shot
backfill from property_details.listing_events for pre-trigger history.
Climate risk First Street
- Flood 4/10 Moderate FEMA zone X (unshaded) · 20% chance over 30 yrs
- Wildfire 8/10 Severe
- Heat 7/10 Severe 7 d/yr ≥104°F today · 19 d/yr by 30 yrs out
- Wind 1/10 Low
- Air quality 5/10 Major 8 unhealthy d/yr today · 10 by 30 yrs out
Nearby sold comps map
Loading sold comps map…
Walkable amenities ~0.75 mi
Loading nearby amenities…
Taxation est. · year 1
- Rental income
- $26,196
- − Mortgage interest
- −$4,531
- − Property taxes
- −$1,213
- − Insurance
- −$404
- − Repairs & maintenance
- −$2,096
- − Management
- −$2,096
- − Depreciation
- −$2,353
- Taxable income
- $13,502
- Est. tax owed @ 24.0%
- −$3,241
- After-tax cash flow
- $10,746/yr
For passive investors: Depreciation is non-cash, so a rental often shows a tax loss while cash-flowing — sheltering income. Rental losses are passive: they offset passive income freely, and up to $25,000/yr can offset ordinary (W-2) income if you actively participate and your MAGI is under $100k (phasing out to $0 by $150k); unused losses carry forward. On sale, claimed depreciation is recaptured at up to 25%, and gains may owe capital-gains tax (a 1031 exchange can defer both). Figures are a year-1 estimate at your 24.0% rate — not tax advice; consult a CPA.
Schools (NCES district)
- District
- Perris Union High
- NCES district ID
- 0630210
- Math proficiency
- 21% ▲ 2.00%
- Reading proficiency
- 48% ▲ 5.00%
- Median HH income
- $49,210
- Composite
- 29.75/100
- National rank
- #6439
- State rank
- #282 of 517 in CA
Livability — Perris
- Score
- 67/100
- State rank
- #322
- US rank
- #10902
Category grades
Schools grade is shown separately in the Schools card above.
Census & demographics
- Census place
- Perris, CA
- County
- Riverside County · 2,287,001 people
- City population
- 118,178
- Metro
- Riverside-San Bernardino-Ontario, CA
- Population (ZIP)
- 60,096
- Household income
- $92,309
- Rent vs Own
- Severe rent burden
- 1152.0
Population outlook (Riverside County) Hauer SSP2
- Today (2025)
- 2,664,475 people
- By 2030
- 2,802,692 · +5.2%
- By 2040
- 3,050,904 · +14.5%
- By 2050
- 3,256,783 · +22.2%
- By 2075
- 3,655,058 · +37.2%
- By 2100
- 3,766,594 · +41.4%
Race, ethnicity, and origin ACS 2023
- Neighborhood character
- Predominantly Hispanic (78%)
- Race & ethnicity
- Hispanic / Latino 78% Two or more races 18% Black 9% White 8% Asian 3% Native American 1%
- Hispanic origin (detail)
- Mexican 70%
- Common ancestry
- Lithuanian 1%
- Foreign-born
- 30% · Canada, Jamaica
- Languages at home
- 34% English-only · Spanish 62% Tagalog/Filipino 1%
Political lean MEDSL · Riverside
- 2024 margin
- Toss-up / Even · D 48.0% · R 49.3% · Other 2.6%
- 2008→2024 swing
- -3.6pp toward R · 2008: 2.3pp · 2024: -1.3pp
- All cycles
- 2024: R+1.3 2020: D+8.0 2016: D+4.3 2012: R+0.4 2008: D+2.3
Not yet ingested
- Civics
- —
Market trends
- HPI YoY
- ▼ -43.87%
- Current HPI
- 421.3426
- Rent YoY
- ▲ 7.69%
- Metro
- Riverside-San Bernardino-Ontario, CA
- State GDP YoY
- ▲ 3.21%
- F500 in state
- 116
Industry mix (Fortune 500 HQ in CA)
| Industry | F500 HQs | Revenue |
|---|---|---|
| Technology | 27 | $1,492B |
|
||
| Financial Services | 3 | $174B |
|
||
| Retail | 3 | $44B |
|
||
| Insurance | 3 | $26B |
|
||
| Media / Entertainment | 2 | $115B |
|
||
| Pharmaceuticals / Biotech | 2 | $62B |
|
||
Price history
+640.0% since first listed10 events — show timeline
- 2026-02-24 Listed $88,800 CRMLS
- 2025-09-30 Listing Removed — CRMLS
- 2025-09-01 Listed $94,900 CRMLS
- 2025-08-31 Listing Removed — CRMLS
- 2025-08-22 Price Changed $95,000 CRMLS
- 2025-06-19 Price Changed $99,999 CRMLS
- 2025-04-21 Listed $120,000 CRMLS
- 2025-03-10 Listing Removed — CRMLS
- 2025-01-11 Price Changed $120,000 CRMLS
- 2025-01-10 Listed $12,000 CRMLS
Property tax history
-4.8%/yrLatest (2025): $52 · +5.8% YoY. Source: county tax records.
Cash-flow waterfall
monthlySold comps — $/sqft
last 12 mo · ≤1 miLoading sold comps…