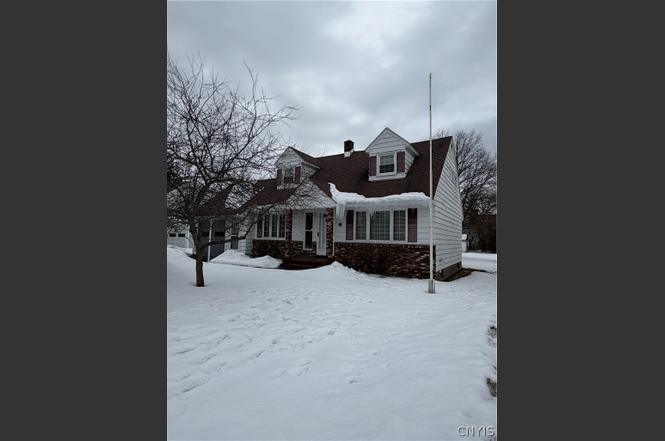
1227 Hillview Dr · Utica, NY
Flood risk 1/10 · Minimal
- FEMA flood zone
- X (unshaded)
- Chance of flooding over 30 yrs
- 0.0%
- Est. flood insurance / yr
- $473 – $860
Fire risk 2/10 · Minimal
- Est. fire insurance / yr
- $691 – $1,283
Heat risk 3/10 · Minor
- Hot days now (above 95°F)
- 7 days/yr
- Hot days in 30 yrs
- 18 days/yr
Wind risk 2/10 · Minimal
- Chance of severe wind over 30 yrs
- 1.0%
Air-quality risk 2/10 · Minimal
- Unhealthy air days now
- 0 days/yr
- Unhealthy air days in 30 yrs
- 1 days/yr
Risk factors via First Street. Map © Google.
Why this score? — see what drove the C grade
The composite is a weighted blend of 9 inputs, each scored 0–100. Each bar is that input's sub-score; the figure is the points it added to the 100-point composite (weight × sub-score).
- Cash flow +17.3/30.0
- ARV discount +10.5/15.0
- Appreciation +10.0/10.0
- DSCR +5.4/10.0
- Livability +4.0/5.0
- 1% rule +3.7/10.0
- Schools +2.9/10.0
- Rent growth +2.5/5.0
- Condition / age +2.5/5.0
$220,000
🖨 Deal sheet 📄 Offer letter ✓ Due diligence
Listing remarks
Welcome to this well-maintained 3-bedroom, 1.5-bath home located in desirable East Utica, just minutes from parks, schools, shopping, and all the conveniences of Utica. Inside and you’ll immediately appreciate the beautiful hardwood floors that flow throughout much of the home, adding warmth and character to the living spaces. The spacious primary bedroom offers plenty of room for a king-sized bed and additional furniture, creating a comfortable retreat at the end of the day. The bright and inviting sunroom is a true highlight — oversized and filled with natural light, it’s the perfect space for morning coffee, a playroom, home office, or simply relaxing year-round. Downst
Key facts
- Well-kept yard
- Second kitchen
- Sunroom
Tags
Neighborhood map
What this means for you Summary
Snapshot
- This is a 3-bed/1.0-bath single-family listed at $220k.
Deal economics
- At list price, monthly cash flow is $161 ($2k/yr) — positive.
- The deal already cash-flows at list — no discount required.
- To meet the 1% rule (rent ≥ 1% of price), the offer needs to be $191k (13.3% below list).
- Recommended offer: $191k (13.3% below list) — sets the bar for 1% rule.
Location & tenants
- Location reads 80/100 on livability (#104 in NY, #1,589 nationally) — a professional / high-income tenant draw. Strengths: commute A+, cost of living A+, housing A+; Watch: employment D, schools D-, crime F.
- Utica City School District (urban): math 33% / reading 38% proficiency, ranked #562 of 590 in NY (top 95%) — families likely to look elsewhere, expect single-tenant / working-renter base with shorter leases; 71% free/reduced lunch — lower-income household profile, screen leases tightly.
- Market conditions: 143 active listings in the ZIP; 5 comparable units currently listed for rent nearby; rentals lingering (median 44d on market — plan ~5-8 weeks vacancy on turnover, expect pricing pressure); 100% of comp listings sitting > 30 days — soft ceiling on asking rent; 204 units permitted in Oneida County in 2024 (68 in 5+ unit buildings).
- This rent runs 44% of the median local income ($53k/yr) — at the standard rent-burdened threshold; future hikes will face affordability resistance.
Forward outlook
- In year one you build about $24k of equity ($2k loan paydown + $22k appreciation (10.0% local appreciation)).
- Oneida County population projected at -12% by 2050 — secular population decline; favor cash flow + early exit over multi-decade hold.
- At projected returns (10.0% appreciation + 3.0% rent growth), your $62k cash investment doubles in ~3 years — after that, you're playing with house money.
- By year 2, paydown + projected appreciation supports a ~$38k cash-out refi (75% LTV) — recoverable capital for the next deal without selling this one.
Negotiation context
- Only 14 days on market — expect competitive offers; lowballing is unlikely to land.
Questions for the listing agent
- Built in 1961 — when were the roof, HVAC, electrical panel, plumbing, and water heater last replaced?
- Is there a deadline driving the sale (1031 exchange, divorce, estate, relocation)? That informs how much negotiation room exists.
- Schools are D-rated, which usually means shorter tenancies and higher turnover. Who's the typical renter profile here, and what's been the actual vacancy rate?
- Crime grade is F in this area — have there been break-ins, vandalism, or insurance claims at this property in the last 3 years? What carrier currently insures it and at what premium?
- What's the average days-on-market for RENTAL listings here right now (not sales)? A rising rental-DOM trend means longer vacancies and softer asking-rent achievability than the comps imply.
- What's the recent tenant-quality profile in this submarket — average credit score on applications, eviction rate, late-payment / NSF rate, and stable-employment percentage? A property-management company in the area should have these aggregated.
- How much new for-sale + rental construction is in the pipeline within 1–3 miles? Heavy new supply typically softens prices + rents 12–24 months out; constrained supply supports both.
Investment metrics
- 1% rule
- 0.87% ✗
- Cap rate
- 7.17%
- Cash-on-cash
- 3.15%
- DSCR
- 1.14
- GRM
- 9.6
CMA / ARV
- ARV (on-the-fly)
- $235,470
- Comps found
- 12
Show comp detail 12 sales within ~0.75 mi
| Address | Dist | Beds/Ba | Sqft | Sold | Price | $/sf | Match |
|---|---|---|---|---|---|---|---|
| 916 Armory Dr | 0.29mi | 3/2.0 | 1,386 (-2%) | 5mo | $275,000 | $198 | 75 |
| 1129 Hilton Ave | 0.28mi | 4/1.5 (+1) | 1,344 (-5%) | 5mo | $185,400 | $138 | 68 |
| 1615 Depeyster Ave | 0.59mi | 3/2.0 | 1,434 (+2%) | 7mo | $278,000 | $194 | 59 |
| 1105 South St | 0.49mi | 3/1.0 | 1,344 (-5%) | 12mo | $140,000 | $104 | 59 |
| 1406 Hillside Rd | 0.73mi | 3/1.5 | 1,430 (+1%) | 6mo | $273,000 | $191 | 57 |
| 1515 Gibson Rd | 0.45mi | 3/1.0 | 1,260 (-11%) | 6mo | $225,000 | $179 | 56 |
| 1135 Mc Quade Ave | 0.49mi | 4/2.0 (+1) | 1,370 (-3%) | 11mo | $160,000 | $117 | 54 |
| 726 Sherman Dr | 0.42mi | 3/1.5 | 1,610 (+14%) | 5mo | $266,500 | $166 | 51 |
| 1612 Copperfield St | 0.49mi | 4/2.0 (+1) | 1,540 (+9%) | 10mo | $239,900 | $156 | 44 |
| 820 James St | 0.54mi | 3/1.0 | 1,200 (-15%) | 7mo | $200,000 | $167 | 44 |
| 1014 Ontario St | 0.71mi | 3/1.0 | 1,250 (-11%) | 12mo | $219,000 | $175 | 38 |
| 1036 Morris St | 0.74mi | 4/2.0 (+1) | 1,504 (+7%) | 11mo | $149,400 | $99 | 36 |
Match score weights: distance 35% · size 25% · config 20% · recency 20%. Top-matched comps best support the ARV.
Projected returns pro-forma
10.0% appreciation · 3.0% rent growth · sell at horizon
- IRR
- 26.5%
- Equity multiple
- 3.11×
- Total profit
- $130,023
- Equity at exit
- $198,193
- IRR
- 23.2%
- Equity multiple
- 7.08×
- Total profit
- $374,653
- Equity at exit
- $427,412
Cash invested: $61,600 (down + closing). Projections, not guarantees.
Landlord ↔ Tenant lean methodology
- Overall (STATE)
- 15 Strongly Tenant-Friendly
- State New York
- 15 Strongly Tenant-Friendly · D+10
- County
- — inherits STATE
- City
- — inherits STATE
ZIP-level market 13501
- Home prices YoY
- 5.6%
- Active inventory
- 143
- Price-to-rent
- 9.6×
Monthly cashflow live
- Estimated rent
- $1,907 medium interval (Pro) →
- Mortgage (P&I)
- −$1,154
- Tax from tax record
- −$100 /mo · $1,197/yr
- Insurance
- −$92
- HOA
- −$0
- Vacancy / Maint / Mgmt
- −$400
- Net cashflow
- $161
Break-even live
UW: 25.0% down · 7.5% · 30yr · 1.5% tax · 5.0% vac · 8.0% maint · 8.0% mgmt
Financing live
Cash to close
- Down payment
- $55,000
- Closing costs
- $6,600
- Reserves months
- —
- Total cash needed
- —
Loan-product check · same deal, 3 products live
Conventional
25% down · 7.5% · 30yr
- Down + closing
- —
- Monthly P&I
- —
- Monthly cashflow
- —
- DSCR
- —
- Eligible?
- —
Personal DTI + credit; lowest rate.
DSCR
20% down · 8.5% · 30yr
- Down + closing
- —
- Monthly P&I
- —
- Monthly cashflow
- —
- DSCR
- —
- Eligible?
- —
No personal income docs; deal must DSCR.
Hard money
10% down · 12.0% · 12mo
- Down + closing
- —
- Monthly P&I
- —
- Monthly cashflow
- —
- DSCR
- —
- Eligible?
- —
Short-term bridge; refi at stabilization.
Rent comps 5 comps
| Address | Beds | Baths | Sqft | Rent | $/sqft | DOM | Units | Dist |
|---|---|---|---|---|---|---|---|---|
| 807 Eagle St Utica, NY | 3.0 | 1.0 | 1526 | $1,300 | $0.85 | 43d | 1 | 0.37mi |
| 1124 Dudley Ave Unit 1 Utica, NY | 3.0 | 1.0 | 1300 | $1,400 | $1.08 | 43d | 1 | 0.98mi |
| 214 Wildwood Rdg Frankfort, NY | 2.0 | 1.5 | 1040 | $2,200 | $2.12 | 43d | 1 | 1.27mi |
| 221 Elizabeth St #2 Utica, NY | 2.0 | 1.0 | 1100 | $2,000 | $1.82 | 44d | 1 | 1.38mi |
| 239 Genesee St Utica, NY | 1.0–2.0 | 1.0–2.0 | 1200 | $2,700 | $2.25 | 43d | 15 | 1.47mi |
Listing history 2 events
-
2026-03-19status Pending
-
2026-03-05$220,000 Active
ⓘ Source: listings_history table (triggers on properties + properties_extension) + one-shot
backfill from property_details.listing_events for pre-trigger history.
Tax reassessment forecast NY · Partial reset (capped growth)
- Current annual tax
- $1,197 · $100/mo
- Projected year-2 tax
- $2,457 · $205/mo
- Expected delta
- +$1,261/yr (+$105/mo · 105.3%)
ⓘ Screening estimate from a state-policy table — verify with the county assessor before closing.
Climate risk First Street
- Flood 1/10 Low FEMA zone X (unshaded) · 0% chance over 30 yrs
- Wildfire 2/10 Low
- Heat 3/10 Moderate 7 d/yr ≥95°F today · 18 d/yr by 30 yrs out
- Wind 2/10 Low 100% chance of damaging wind over 30 yrs
- Air quality 2/10 Low 0 unhealthy d/yr today · 1 by 30 yrs out
Nearby sold comps map
Loading sold comps map…
Walkable amenities ~0.75 mi
Loading nearby amenities…
Taxation est. · year 1
- Rental income
- $22,885
- − Mortgage interest
- −$12,323
- − Property taxes
- −$1,197
- − Insurance
- −$1,100
- − Repairs & maintenance
- −$1,831
- − Management
- −$1,831
- − Depreciation
- −$6,400
- Taxable loss
- −$1,797
- Est. tax savings @ 24.0%
- +$431
- After-tax cash flow
- $2,369/yr
For passive investors: Depreciation is non-cash, so a rental often shows a tax loss while cash-flowing — sheltering income. Rental losses are passive: they offset passive income freely, and up to $25,000/yr can offset ordinary (W-2) income if you actively participate and your MAGI is under $100k (phasing out to $0 by $150k); unused losses carry forward. On sale, claimed depreciation is recaptured at up to 25%, and gains may owe capital-gains tax (a 1031 exchange can defer both). Figures are a year-1 estimate at your 24.0% rate — not tax advice; consult a CPA.
Schools (NCES district)
- District
- Utica City School District
- NCES district ID
- 3629370
- Math proficiency
- 33% ▼ -7.00%
- Reading proficiency
- 38% ▲ 2.00%
- Median HH income
- $31,834
- Composite
- 29.01/100
- National rank
- #6613
- State rank
- #562 of 590 in NY
Livability — Utica
- Score
- 80/100
- State rank
- #104
- US rank
- #1589
Category grades
Schools grade is shown separately in the Schools card above.
Census & demographics
- Census place
- Utica, NY
- County
- Oneida County · 89,710 people
- City population
- 72,968
- Metro
- Utica-Rome, NY
- Population (ZIP)
- 38,931
- Household income
- $52,548
- Rent vs Own
- Severe rent burden
- 2251.0
Population outlook (Oneida County) Hauer SSP2
- Today (2025)
- 225,223 people
- By 2030
- 220,384 · -2.1%
- By 2040
- 209,071 · -7.2%
- By 2050
- 197,920 · -12.1%
- By 2075
- 175,541 · -22.1%
- By 2100
- 148,491 · -34.1%
Race, ethnicity, and origin ACS 2023
- Neighborhood character
- Highly diverse neighborhood (Simpson 0.70)
- Race & ethnicity
- White 49% Two or more races 15% Hispanic / Latino 14% Black 14% Asian 14%
- Hispanic origin (detail)
- Puerto Rican 8% Dominican 4%
- Common ancestry
- American 8% Romanian 3% Lithuanian 1%
- Foreign-born
- 25% · Canada, Philippines, Vietnam
- Languages at home
- 62% English-only · Other Asian/Pacific 11% Russian/Polish/Slavic 10% Spanish 9%
Political lean MEDSL · Oneida
- 2024 margin
- Strong R (+21.3) · D 39.4% · R 60.6%
- 2008→2024 swing
- -15.2pp toward R · 2008: -6.1pp · 2024: -21.3pp
- All cycles
- 2024: R+21.3 2020: R+15.5 2016: R+21.1 2012: R+5.3 2008: R+6.1
Not yet ingested
- Civics
- —
Market trends
- HPI YoY
- ▲ 20.28%
- Current HPI
- 382.3726
- Rent YoY
- —
- Metro
- Utica-Rome, NY
- State GDP YoY
- ▲ 2.60%
- F500 in state
- 92
Industry mix (Fortune 500 HQ in NY)
| Industry | F500 HQs | Revenue |
|---|---|---|
| Financial Services | 10 | $950B |
|
||
| Consumer Goods | 9 | $162B |
|
||
| Insurance | 4 | $225B |
|
||
| Telecommunications | 2 | $144B |
|
||
| Pharmaceuticals | 2 | $112B |
|
||
| Media / Entertainment | 2 | $69B |
|
||
Price history
2 events — show timeline
- 2026-03-19 Pending — CNYIS
- 2026-03-05 Listed $220,000 CNYIS
Property tax history
-3.2%/yrLatest (2025): $1,197 · -22.4% YoY. Source: county tax records.
Cash-flow waterfall
monthlySold comps — $/sqft
last 12 mo · ≤1 miLoading sold comps…