4525 Greenfields Rd · Macon-Bibb County, GA
Flood risk 1/10 · Minimal
- FEMA flood zone
- X (unshaded)
- Chance of flooding over 30 yrs
- 0.0%
- Est. flood insurance / yr
- $507 – $1,088
Fire risk 1/10 · Minimal
- Est. fire insurance / yr
- $963 – $1,789
Heat risk 7/10 · Major
- Hot days now (above 108°F)
- 7 days/yr
- Hot days in 30 yrs
- 17 days/yr
Wind risk 6/10 · Moderate
- Chance of severe wind over 30 yrs
- 72.0%
Air-quality risk 4/10 · Minor
- Unhealthy air days now
- 3 days/yr
- Unhealthy air days in 30 yrs
- 5 days/yr
Risk factors via First Street. Map © Google.
Why this score? — see what drove the B grade
The composite is a weighted blend of 9 inputs, each scored 0–100. Each bar is that input's sub-score; the figure is the points it added to the 100-point composite (weight × sub-score).
- Cash flow +28.8/30.0
- ARV discount +15.0/15.0
- DSCR +10.0/10.0
- 1% rule +7.5/10.0
- Rent growth +2.9/5.0
- Livability +2.5/5.0
- Condition / age +2.5/5.0
- Schools +1.2/10.0
- Appreciation +0.0/10.0
$83,888
🖨 Deal sheet 📄 Offer letter ✓ Due diligence
Listing remarks MLS
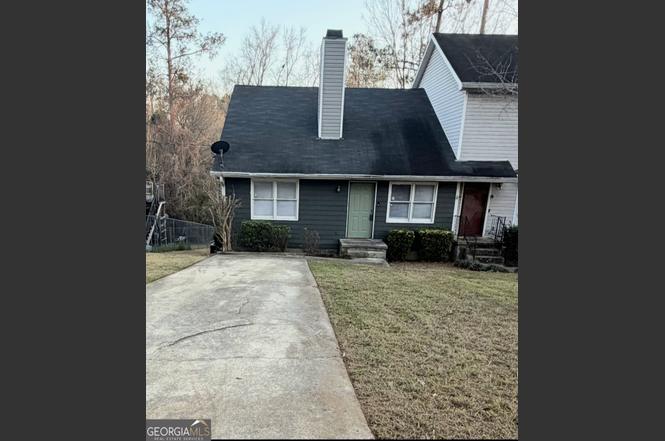
Convenient North Macon location! This single family attached home has 2 bedrooms, 2 bathrooms, and a great room with fireplace. The dining room is separate from the kitchen, and a porch is just off the kitchen. With a little work, this home would make a great starter home or investment. Please contact the listing agent for more details.
Key facts
- New siding
- New water heater
- Close to shops
Tags
Neighborhood map
What this means for you Summary
Snapshot
- This is a 2-bed/2.0-bath single-family listed at $84k.
Deal economics
- At list price, monthly cash flow is $281 ($3k/yr) — positive.
- The deal already cash-flows at list — no discount required.
- Meets the 1% rule at list price ($1k rent vs $84k).
- Recommended offer: $81k (3.0% below list) — sets the bar for market timing.
- Cap rate 10.3% vs local median 5.4% in Macon-Bibb County — top-decile yield for the area; either an underpriced asset or a hidden risk that comps aren't pricing in. Stress-test before assuming the spread holds.
Location & tenants
- Location reads: area grade B — affects rentability + tenant quality, not the cash-flow math above.
- Bibb County (urban): math 11% / reading 18% proficiency, ranked #161 of 174 in GA (top 92%) — low school quality limits family demand, transient renter base, plan for 1-2y turnover; 75% free/reduced lunch — lower-income household profile, screen leases tightly.
- Zoned schools: Carter Elementary School (math 32% / reading 32%, grade F, #582 of 1,228 statewide, top 50%, 481 students, 100% FRL); Howard High School (math 2% / reading 5%, grade F, #413 of 424 statewide, top 99%, 1,076 students, 100% FRL) — zoned schools average 100% FRL vs 75% district-wide (25 pts higher); higher-poverty schools than district average — tighter screening recommended.
- Market conditions: Rents rising (+1.7%/yr); 235 active listings in the ZIP; 25 comparable units currently listed for rent nearby; rentals at typical pace (median 21d on market — plan ~3-4 weeks tenant-placement turnaround); 40% of comp listings sitting > 30 days — soft ceiling on asking rent; solid renter incomes; 154 units permitted in Bibb County in 2024 (0 in 5+ unit buildings).
- This rent is only 16% of the median local income ($78k/yr) — well below the 30% rent-burden line; pricing power to push rent on renewal without tenant pushback.
Forward outlook
- Local home prices are declining (-3.0%/yr); year-one equity from $580 of loan paydown is wiped out by about $3k of value loss. Plan a longer hold.
- Bibb County population projected at -12% by 2050 — secular population decline; favor cash flow + early exit over multi-decade hold.
- At projected returns (-3.0% appreciation + 1.7% rent growth), your $23k cash investment doubles in ~10 years — after that, you're playing with house money.
Negotiation context
- It's been on market 35 days — a 3% lower offer ($81k) is reasonable based on typical stale-listing flexibility.
- 2 sale attempts since 10y ago; this cycle's ask has dropped $16k (16%) from the opening price — seller is motivated, your offer sets the floor, not the list.
- Current owner paid $22k; list at $84k implies a 282% gain — meaningful room to come down on a strong offer.
Risks & watch-outs
- Climate carrying-cost: major wind risk, 72% chance of damaging wind over 30y; extreme-heat days projected 7→17/yr by 2055 (HVAC capex compounding) — expect insurance premiums to compound above CPI over the hold.
Questions for the listing agent
- It's been on market 35 days. Have you received any prior offers? Is the seller open to a 3% concession, seller financing, or rate buy-down credit?
- Is there a deadline driving the sale (1031 exchange, divorce, estate, relocation)? That informs how much negotiation room exists.
- What's the average days-on-market for RENTAL listings here right now (not sales)? A rising rental-DOM trend means longer vacancies and softer asking-rent achievability than the comps imply.
- What's the recent tenant-quality profile in this submarket — average credit score on applications, eviction rate, late-payment / NSF rate, and stable-employment percentage? A property-management company in the area should have these aggregated.
- How much new for-sale + rental construction is in the pipeline within 1–3 miles? Heavy new supply typically softens prices + rents 12–24 months out; constrained supply supports both.
Investment metrics
- 1% rule
- 1.25% ✓
- Cap rate
- 10.31%
- Cash-on-cash
- 14.36%
- DSCR
- 1.64
- GRM
- 6.7
CMA / ARV
- ARV (on-the-fly)
- $124,320
- Comps found
- 6
Show comp detail 6 sales within ~0.75 mi
| Address | Dist | Beds/Ba | Sqft | Sold | Price | $/sf | Match |
|---|---|---|---|---|---|---|---|
| 4571 Shadow Lawn Dr | 0.20mi | 2/1.0 | 1,113 (-1%) | 1mo | $37,000 | $33 | 84 |
| 4354 Barrington Pl | 0.19mi | 2/1.5 | 1,092 (-2%) | 8mo | $145,000 | $133 | 78 |
| 4606 Lakewood Ave | 0.25mi | 2/1.0 | 1,077 (-4%) | 19mo | $119,500 | $111 | 62 |
| 4516 Bon Ayer Cir | 0.47mi | 3/2.0 (+1) | 1,026 (-8%) | 12mo | $190,000 | $185 | 49 |
| 4418 Ayers Rd | 0.28mi | 3/1.0 (+1) | 1,012 (-10%) | 17mo | $69,000 | $68 | 47 |
| 3910 Thompson Rd | 0.52mi | 2/1.0 | 1,080 (-4%) | 24mo | $60,000 | $56 | 46 |
Match score weights: distance 35% · size 25% · config 20% · recency 20%. Top-matched comps best support the ARV.
Projected returns pro-forma
-3.0% appreciation · 1.71% rent growth · sell at horizon
- IRR
- 3.3%
- Equity multiple
- 1.13×
- Total profit
- $2,957
- Equity at exit
- $12,508
- IRR
- 11.6%
- Equity multiple
- 1.86×
- Total profit
- $20,230
- Equity at exit
- $7,253
Cash invested: $23,489 (down + closing). Projections, not guarantees.
Landlord ↔ Tenant lean methodology
- Overall (STATE)
- 90 Strongly Landlord-Friendly
- State Georgia
- 90 Strongly Landlord-Friendly · R+3
- County
- — inherits STATE
- City
- — inherits STATE
ZIP-level market 31210
- Rents YoY
- 1.7%
- Active inventory
- 235
- Price-to-rent
- 6.7×
Monthly cashflow live
- Estimated rent
- $1,050 high interval (Pro) →
- Mortgage (P&I)
- −$440
- Tax from tax record
- −$73 /mo · $881/yr
- Insurance
- −$35
- HOA
- −$0
- Vacancy / Maint / Mgmt
- −$220
- Net cashflow
- $281
Break-even live
UW: 25.0% down · 7.5% · 30yr · 1.5% tax · 5.0% vac · 8.0% maint · 8.0% mgmt
Financing live
Cash to close
- Down payment
- $20,972
- Closing costs
- $2,517
- Reserves months
- —
- Total cash needed
- —
Loan-product check · same deal, 3 products live
Conventional
25% down · 7.5% · 30yr
- Down + closing
- —
- Monthly P&I
- —
- Monthly cashflow
- —
- DSCR
- —
- Eligible?
- —
Personal DTI + credit; lowest rate.
DSCR
20% down · 8.5% · 30yr
- Down + closing
- —
- Monthly P&I
- —
- Monthly cashflow
- —
- DSCR
- —
- Eligible?
- —
No personal income docs; deal must DSCR.
Hard money
10% down · 12.0% · 12mo
- Down + closing
- —
- Monthly P&I
- —
- Monthly cashflow
- —
- DSCR
- —
- Eligible?
- —
Short-term bridge; refi at stabilization.
Rent comps 25 comps
| Address | Beds | Baths | Sqft | Rent | $/sqft | DOM | Units | Dist |
|---|---|---|---|---|---|---|---|---|
| 4375 Barrington Pl Macon, GA | 1.0 | 1.5 | 1144 | $1,050 | $0.92 | 13d | 1 | 0.13mi |
| 4353 Barrington Pl Macon, GA | 2.0 | 1.5 | 1108 | $1,000 | $0.90 | 13d | 1 | 0.19mi |
| 4342 Barrington Pl Macon, GA | 2.0 | 1.5 | 1092 | $950 | $0.87 | 21d | 1 | 0.23mi |
| 4357 Azalea Dr Unit 4357 Macon, GA | 2.0 | 1.0 | 750 | $750 | $1.00 | 43d | 1 | 0.26mi |
| 4250 Ayers Rd Macon, GA | 2.0 | 1.0 | 1008 | $1,100 | $1.09 | 13d | 1 | 0.30mi |
| 4126 Ayers Rd Macon, GA | 2.0 | 1.0 | 900 | $750 | $0.83 | 13d | 1 | 0.37mi |
| 200 Charter Ln Macon, GA | 1.0–3.0 | 1.0–2.0 | 1088 | $1,322 | $1.21 | 13d | 18 | 0.43mi |
| 230 Roycrest Dr Macon, GA | 3.0 | 2.0 | 1261 | $1,300 | $1.03 | 43d | 1 | 0.60mi |
| 4033 N Napier Ave Unit 6 Macon, GA | 2.0 | 1.5 | 1000 | $850 | $0.85 | 43d | 1 | 0.68mi |
| 3808 Fairmont Ave Unit A Macon, GA | 1.0 | 1.0 | 793 | $595 | $0.75 | 43d | 1 | 0.72mi |
| 4145 Forest Ave W Macon, GA | 3.0 | 1.0 | 1285 | $1,195 | $0.93 | 43d | 1 | 0.79mi |
| 3834 Mercer St Macon, GA | 2.0 | 1.0 | 1000 | $875 | $0.88 | 43d | 1 | 0.80mi |
| 3840 Napier Ave Macon, GA | 3.0 | 1.0 | 1365 | $1,350 | $0.99 | 13d | 1 | 0.82mi |
| 3576 Vineville Ave Unit 3550-D-LT Macon, GA | 2.0 | 2.0 | 863 | $995 | $1.15 | 13d | 1 | 0.83mi |
| 3775 Grand Ave Macon, GA | 3.0 | 2.0 | 1240 | $1,175 | $0.95 | 13d | 1 | 0.86mi |
| 133 Auburn Ave Macon, GA | 2.0 | 1.0 | 880 | $895 | $1.02 | 43d | 1 | 0.92mi |
| 3413 Vineville Ave Unit 3419 Macon, GA | 3.0 | 1.5 | 1200 | $1,200 | $1.00 | 21d | 1 | 1.02mi |
| 3634 Dawn St Macon, GA | 3.0 | 1.0 | 999 | $850 | $0.85 | 43d | 1 | 1.05mi |
| 3324 Vineville Ave Unit 57C Macon, GA | 2.0 | 1.0 | 914 | $1,050 | $1.15 | 13d | 1 | 1.15mi |
| 3324 Vineville Ave Unit 63B Macon, GA | 2.0 | 1.0 | 1125 | $1,050 | $0.93 | 21d | 1 | 1.15mi |
| 3330 Ridge Ave Unit D4 Macon, GA | 2.0 | 1.5 | 1056 | $1,050 | $0.99 | 13d | 1 | 1.16mi |
| 3495 Charleston Cir Macon, GA | 3.0 | 1.0 | 1048 | $799 | $0.76 | 21d | 1 | 1.24mi |
| 3495 Charleston Cir Macon, GA | 3.0 | 1.0 | 1048 | $875 | $0.83 | 43d | 1 | 1.24mi |
| 3266 Highpoint Dr Unit 593-B Macon, GA | 2.0 | 1.5 | 1120 | $1,100 | $0.98 | 43d | 1 | 1.33mi |
| 3163 High Point Dr Macon, GA | 3.0 | 1.0 | 1100 | $1,125 | $1.02 | 21d | 1 | 1.45mi |
Listing history 7 events
-
2026-04-09status Under Contract
-
2026-04-03price $83,888
-
2026-03-23price $88,777
-
2026-03-17price $93,888
-
2026-03-05$99,900 New
-
2016-11-29soldstatus $21,988 338-char remark
Show marketing remark (338 chars)
Convenient North Macon location! This single family attached home has 2 bedrooms, 2 bathrooms, and a great room with fireplace. The dining room is separate from the kitchen, and a porch is just off the kitchen. With a little work, this home would make a great starter home or investment. Please contact the listing agent for more details.
-
2016-09-15$26,100 338-char remark
Show marketing remark (338 chars)
Convenient North Macon location! This single family attached home has 2 bedrooms, 2 bathrooms, and a great room with fireplace. The dining room is separate from the kitchen, and a porch is just off the kitchen. With a little work, this home would make a great starter home or investment. Please contact the listing agent for more details.
ⓘ Source: listings_history table (triggers on properties + properties_extension) + one-shot
backfill from property_details.listing_events for pre-trigger history.
Tax reassessment forecast GA · Resets to sale price
- Current annual tax
- $881 · $73/mo
- Projected year-2 tax
- $881 · $73/mo
- Expected delta
- $0/yr ($0/mo · 0.0%)
ⓘ Screening estimate from a state-policy table — verify with the county assessor before closing.
Climate risk First Street
- Flood 1/10 Low FEMA zone X (unshaded) · 0% chance over 30 yrs
- Wildfire 1/10 Low
- Heat 7/10 Severe 7 d/yr ≥108°F today · 17 d/yr by 30 yrs out
- Wind 6/10 Major 72% chance of damaging wind over 30 yrs
- Air quality 4/10 Moderate 3 unhealthy d/yr today · 5 by 30 yrs out
Nearby sold comps map
Loading sold comps map…
Walkable amenities ~0.75 mi
Loading nearby amenities…
Taxation est. · year 1
- Rental income
- $12,597
- − Mortgage interest
- −$4,699
- − Property taxes
- −$881
- − Insurance
- −$419
- − Repairs & maintenance
- −$1,008
- − Management
- −$1,008
- − Depreciation
- −$2,440
- Taxable income
- $2,142
- Est. tax owed @ 24.0%
- −$514
- After-tax cash flow
- $2,858/yr
For passive investors: Depreciation is non-cash, so a rental often shows a tax loss while cash-flowing — sheltering income. Rental losses are passive: they offset passive income freely, and up to $25,000/yr can offset ordinary (W-2) income if you actively participate and your MAGI is under $100k (phasing out to $0 by $150k); unused losses carry forward. On sale, claimed depreciation is recaptured at up to 25%, and gains may owe capital-gains tax (a 1031 exchange can defer both). Figures are a year-1 estimate at your 24.0% rate — not tax advice; consult a CPA.
Schools (NCES district)
- District
- Bibb County
- NCES district ID
- 1300420
- Math proficiency
- 11% ▼ -14.00%
- Reading proficiency
- 18% ▼ -11.00%
- Median HH income
- $37,426
- Composite
- 12.13/100
- National rank
- #9654
- State rank
- #161 of 174 in GA
Livability — Macon-Bibb County
No livability data for this city. (Only ~50 U.S. cities are tracked.)
Census & demographics
- Census place
- Macon-Bibb County, GA
- County
- Bibb County · 164,332 people
- City population
- 143,186
- Metro
- Macon-Bibb County, GA
- Population (ZIP)
- 33,288
- Household income
- $78,447
- Rent vs Own
- Severe rent burden
- 1845.0
Population outlook (Bibb County) Hauer SSP2
- Today (2025)
- 148,772 people
- By 2030
- 145,904 · -1.9%
- By 2040
- 139,404 · -6.3%
- By 2050
- 131,603 · -11.5%
- By 2075
- 111,050 · -25.4%
- By 2100
- 83,346 · -44.0%
Race, ethnicity, and origin ACS 2023
- Neighborhood character
- Diverse neighborhood (Simpson 0.62)
- Race & ethnicity
- White 52% Black 32% Two or more races 7% Hispanic / Latino 6% Asian 4%
- Hispanic origin (detail)
- Mexican 2% Cuban 1%
- Common ancestry
- Slovak 3% Serbian 1% Italian 1%
- Foreign-born
- 5% · Canada, China, South Korea
- Languages at home
- 93% English-only · Spanish 3% Other Indo-European 1% Chinese 1%
Political lean MEDSL · Bibb
- 2024 margin
- Strong D (+22.4) · D 61.0% · R 38.5%
- 2008→2024 swing
- +4.4pp toward D · 2008: 18.0pp · 2024: 22.4pp
- All cycles
- 2024: D+22.4 2020: D+23.8 2016: D+20.2 2012: D+20.0 2008: D+18.0
Not yet ingested
- Civics
- —
Market trends
- HPI YoY
- ▼ -144.60%
- Current HPI
- 172.1313
- Rent YoY
- ▲ 1.71%
- Metro
- Macon-Bibb County, GA
- State GDP YoY
- ▲ 2.66%
- F500 in state
- 28
Industry mix (Fortune 500 HQ in GA)
| Industry | F500 HQs | Revenue |
|---|---|---|
| Paper / Packaging | 2 | $29B |
|
||
| Retail | 1 | $160B |
|
||
| Transportation / Logistics | 1 | $91B |
|
||
| Airlines | 1 | $62B |
|
||
| Consumer Goods | 1 | $47B |
|
||
| Utilities | 1 | $25B |
|
||
Price history
+221.4% since first listed7 events — show timeline
- 2026-04-09 Pending — GAMLS
- 2026-04-03 Price Changed $83,888 GAMLS
- 2026-03-23 Price Changed $88,777 GAMLS
- 2026-03-17 Price Changed $93,888 GAMLS
- 2026-03-05 Listed $99,900 GAMLS
- 2016-11-29 Sold (MLS) $21,988 MGMLS
- 2016-09-15 Listed $26,100 MGMLS
Property tax history
+11.8%/yrLatest (2025): $881 · +7.0% YoY. Source: county tax records.
Cash-flow waterfall
monthlySold comps — $/sqft
last 12 mo · ≤1 miLoading sold comps…