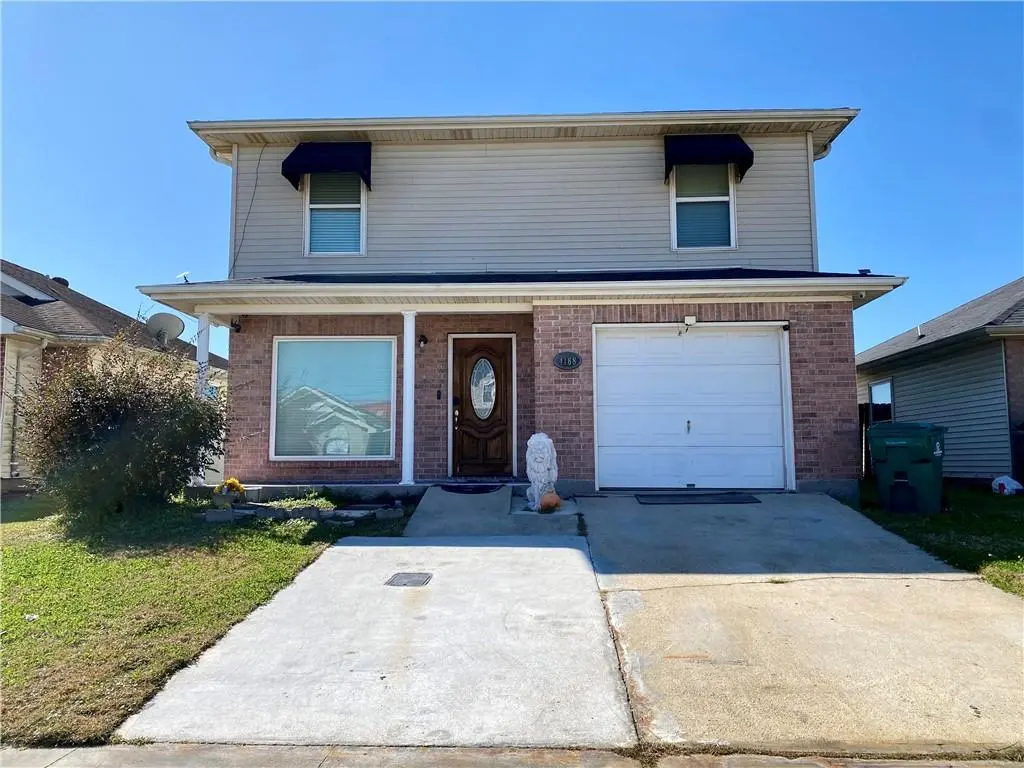
4168 Lac Saint Pierre Dr · Harvey, LA
Flood risk 8/10 · Major
- FEMA flood zone
- X
- Chance of flooding over 30 yrs
- 0.6%
- Est. flood insurance / yr
- $507 – $1,088
Fire risk 1/10 · Minimal
- Est. fire insurance / yr
- $1,269 – $2,357
Heat risk 10/10 · Severe
- Hot days now (above 108°F)
- 7 days/yr
- Hot days in 30 yrs
- 21 days/yr
Wind risk 10/10 · Severe
- Chance of severe wind over 30 yrs
- 99.0%
Air-quality risk 2/10 · Minimal
- Unhealthy air days now
- 2 days/yr
- Unhealthy air days in 30 yrs
- 2 days/yr
Risk factors via First Street. Map © Google.
Why this score? — see what drove the C grade
The composite is a weighted blend of 9 inputs, each scored 0–100. Each bar is that input's sub-score; the figure is the points it added to the 100-point composite (weight × sub-score).
- Cash flow +19.6/30.0
- ARV discount +15.0/15.0
- DSCR +6.2/10.0
- 1% rule +5.0/10.0
- Livability +3.2/5.0
- Schools +2.5/10.0
- Condition / age +2.5/5.0
- Rent growth +1.5/5.0
- Appreciation +0.0/10.0
$210,000
🖨 Deal sheet 📄 Offer letter ✓ Due diligence
Listing remarks MLS
Don't let this opportunity pass to acquire this beautiful, well maintained 4-bedroom, 2.5- bathroom home, located in an X Flood zone, featuring granite countertops in the kitchen, as well as ceramic tile and wood flooring throughout, and a spacious backyard for family gatherings to enjoy crawfish boils/barbeque. Call today to schedule a private tour.
Key facts
- Wood flooring
- Spacious backyard
- Granite countertops
Tags
Neighborhood map
What this means for you Summary
Snapshot
- This is a 4-bed/2.5-bath single-family listed at $210k.
Deal economics
- At list price, monthly cash flow is $177 ($2k/yr) — positive.
- The deal already cash-flows at list — no discount required.
- To meet the 1% rule (rent ≥ 1% of price), the offer needs to be $209k (0.3% below list).
- Recommended offer: $185k (12.0% below list) — sets the bar for market timing.
- Cap rate 7.7% vs local median 4.8% in Harvey — top-decile yield for the area; either an underpriced asset or a hidden risk that comps aren't pricing in. Stress-test before assuming the spread holds.
Location & tenants
- Location reads 64/100 on livability (#166 in LA) — a middle-class / working-renter tenant base. Strengths: cost of living A+, housing A+; Watch: schools D+, crime F, amenities F.
- Jefferson Parish (suburban): math 24% / reading 34% proficiency, ranked #44 of 98 in LA (top 45%) — low school quality limits family demand, transient renter base, plan for 1-2y turnover; 70% free/reduced lunch — lower-income household profile, screen leases tightly.
- Market conditions: Rents falling (-3.9%/yr); 187 active listings in the ZIP; 4 comparable units currently listed for rent nearby; rentals at typical pace (median 24d on market — plan ~3-4 weeks tenant-placement turnaround); 518 units permitted in Jefferson Parish in 2024 (43 in 5+ unit buildings).
- This rent runs 40% of the median local income ($62k/yr) — at the standard rent-burdened threshold; future hikes will face affordability resistance.
Forward outlook
- Local home prices are declining (-3.0%/yr); year-one equity from $1k of loan paydown is wiped out by about $6k of value loss. Plan a longer hold.
Negotiation context
- It's been on market 140 days — a 12% lower offer ($185k) is reasonable based on typical stale-listing flexibility.
- 5 sale attempts since 4y ago; this cycle's ask is 10400% above the opening price — seller raised mid-cycle; expect resistance to lowballs.
Risks & watch-outs
- Watch-outs: flood insurance adds $66/mo.
- Climate carrying-cost: severe flood risk; severe wind risk, 99% chance of damaging wind over 30y; extreme-heat days projected 7→21/yr by 2055 (HVAC capex compounding) — expect insurance premiums to compound above CPI over the hold.
Questions for the listing agent
- It's been on market 140 days. Have you received any prior offers? Is the seller open to a 12% concession, seller financing, or rate buy-down credit?
- What's the actual annual flood-insurance premium (NFIP or private), and is the property in a SFHA with mandatory coverage?
- Why hasn't it sold? Are there any deal-killer items the seller is aware of (foundation, flood, title, zoning, code violations)?
- Is there a deadline driving the sale (1031 exchange, divorce, estate, relocation)? That informs how much negotiation room exists.
- Schools are D-rated, which usually means shorter tenancies and higher turnover. Who's the typical renter profile here, and what's been the actual vacancy rate?
- Crime grade is F in this area — have there been break-ins, vandalism, or insurance claims at this property in the last 3 years? What carrier currently insures it and at what premium?
- What's the average days-on-market for RENTAL listings here right now (not sales)? A rising rental-DOM trend means longer vacancies and softer asking-rent achievability than the comps imply.
- What's the recent tenant-quality profile in this submarket — average credit score on applications, eviction rate, late-payment / NSF rate, and stable-employment percentage? A property-management company in the area should have these aggregated.
- How much new for-sale + rental construction is in the pipeline within 1–3 miles? Heavy new supply typically softens prices + rents 12–24 months out; constrained supply supports both.
Investment metrics
- 1% rule
- 1.00% ✗
- Cap rate
- 7.68%
- Cash-on-cash
- 4.97%
- DSCR
- 1.22
- GRM
- 8.4
CMA / ARV
- ARV (median comp)
- $265,685
- List price
- $210,000
- Delta
- -20.96%
- Verdict
- UNDERPRICED
- Comps
- 20 within 1.0 mi
Show comp detail 3 sales within ~0.75 mi
| Address | Dist | Beds/Ba | Sqft | Sold | Price | $/sf | Match |
|---|---|---|---|---|---|---|---|
| 1928 Lac La Belle Dr | 0.16mi | 4/2.5 | 1,557 (-2%) | 1mo | $211,000 | $136 | 88 |
| 3932 E Bamboo Dr | 0.28mi | 3/2.0 (-1) | 1,710 (+8%) | 10mo | $206,000 | $120 | 59 |
| 3939 Bayou Oaks Dr | 0.27mi | 3/2.0 (-1) | 1,796 (+13%) | 4mo | $233,975 | $130 | 55 |
Match score weights: distance 35% · size 25% · config 20% · recency 20%. Top-matched comps best support the ARV.
Projected returns pro-forma
-3.0% appreciation · 0.0% rent growth · sell at horizon
- IRR
- -14.1%
- Equity multiple
- 0.51×
- Total profit
- $-28,852
- Equity at exit
- $31,312
- IRR
- -11.2%
- Equity multiple
- 0.42×
- Total profit
- $-34,133
- Equity at exit
- $18,157
Cash invested: $58,800 (down + closing). Projections, not guarantees.
Landlord ↔ Tenant lean methodology
- Overall (STATE)
- 90 Strongly Landlord-Friendly
- State Louisiana
- 90 Strongly Landlord-Friendly · R+12
- County
- — inherits STATE
- City
- — inherits STATE
ZIP-level market 70058
- Rents YoY
- -3.9%
- Active inventory
- 187
- Price-to-rent
- 8.4×
Monthly cashflow live
- Estimated rent
- $2,093 medium interval (Pro) →
- Mortgage (P&I)
- −$1,101
- Tax from tax record
- −$221 /mo · $2,657/yr
- Insurance
- −$88
- Flood insurance flood zone
- −$66 /mo · $798/yr
- HOA
- −$0
- Vacancy / Maint / Mgmt
- −$440
- Net cashflow
- $177
Break-even live
UW: 25.0% down · 7.5% · 30yr · 1.5% tax · 5.0% vac · 8.0% maint · 8.0% mgmt
Financing live
Cash to close
- Down payment
- $52,500
- Closing costs
- $6,300
- Reserves months
- —
- Total cash needed
- —
Loan-product check · same deal, 3 products live
Conventional
25% down · 7.5% · 30yr
- Down + closing
- —
- Monthly P&I
- —
- Monthly cashflow
- —
- DSCR
- —
- Eligible?
- —
Personal DTI + credit; lowest rate.
DSCR
20% down · 8.5% · 30yr
- Down + closing
- —
- Monthly P&I
- —
- Monthly cashflow
- —
- DSCR
- —
- Eligible?
- —
No personal income docs; deal must DSCR.
Hard money
10% down · 12.0% · 12mo
- Down + closing
- —
- Monthly P&I
- —
- Monthly cashflow
- —
- DSCR
- —
- Eligible?
- —
Short-term bridge; refi at stabilization.
Rent comps 4 comps
| Address | Beds | Baths | Sqft | Rent | $/sqft | DOM | Units | Dist |
|---|---|---|---|---|---|---|---|---|
| 81 Lake Lynn Dr Harvey, LA | 3.0 | 2.5 | 1686 | $1,900 | $1.13 | 23d | 1 | 0.28mi |
| 2323 N Harper Dr Harvey, LA | 3.0 | 2.0 | 1678 | $3,000 | $1.79 | 43d | 1 | 1.29mi |
| 3251 Wall Blvd Gretna, LA | 1.0–3.0 | 1.0–2.0 | 1174 | $2,500 | $2.13 | 1d | 1 | 1.47mi |
| 1401 Drake Ln Gretna, LA | 3.0 | 2.0 | 1296 | $2,150 | $1.66 | 23d | 1 | 1.50mi |
Listing history 24 events
-
2026-06-18days on market $210,000 Active 140 DOM
-
2026-06-17days on market $210,000 Active 139 DOM
-
2026-06-16days on market $210,000 Active 138 DOM
-
2026-06-15days on market $210,000 Active 137 DOM
-
2026-06-13days on market $210,000 Active 135 DOM
-
2026-06-10days on market $210,000 Active 132 DOM
-
2026-06-09days on market $210,000 Active 131 DOM
-
2026-06-08days on market $210,000 Active 130 DOM
-
2026-06-07days on market $210,000 Active 129 DOM
-
2026-06-03days on market $210,000 Active 125 DOM
-
2026-06-02days on market $210,000 Active 124 DOM
-
2026-06-01days on market $210,000 Active 123 DOM
-
2026-05-31days on market $210,000 Active 122 DOM
-
2026-05-20price $210,000 352-char remark
Show marketing remark (352 chars)
Don't let this opportunity pass to acquire this beautiful, well maintained 4-bedroom, 2.5- bathroom home, located in an X Flood zone, featuring granite countertops in the kitchen, as well as ceramic tile and wood flooring throughout, and a spacious backyard for family gatherings to enjoy crawfish boils/barbeque. Call today to schedule a private tour.
-
2026-05-19price $210,000 352-char remark
Show marketing remark (352 chars)
Don't let this opportunity pass to acquire this beautiful, well maintained 4-bedroom, 2.5- bathroom home, located in an X Flood zone, featuring granite countertops in the kitchen, as well as ceramic tile and wood flooring throughout, and a spacious backyard for family gatherings to enjoy crawfish boils/barbeque. Call today to schedule a private tour.
-
2026-04-12$2,000
-
2026-01-28$220,000 Active 352-char remark
Show marketing remark (352 chars)
Don't let this opportunity pass to acquire this beautiful, well maintained 4-bedroom, 2.5- bathroom home, located in an X Flood zone, featuring granite countertops in the kitchen, as well as ceramic tile and wood flooring throughout, and a spacious backyard for family gatherings to enjoy crawfish boils/barbeque. Call today to schedule a private tour.
-
2022-03-18soldstatus $210,000 Closed
-
2022-02-15status Pending
-
2022-02-11$195,000
-
2022-02-11$195,000 Active
-
2010-05-26soldstatus $146,000
-
2004-06-01soldstatus $113,900
ⓘ Source: listings_history table (triggers on properties + properties_extension) + one-shot
backfill from property_details.listing_events for pre-trigger history.
Tax reassessment forecast LA · Resets to sale price
- Current annual tax
- $2,657 · $221/mo
- Projected year-2 tax
- $2,657 · $221/mo
- Expected delta
- $0/yr ($0/mo · 0.0%)
ⓘ Screening estimate from a state-policy table — verify with the county assessor before closing.
Climate risk First Street
- Flood 8/10 Severe FEMA zone X · 60% chance over 30 yrs
- Wildfire 1/10 Low
- Heat 10/10 Extreme 7 d/yr ≥108°F today · 21 d/yr by 30 yrs out
- Wind 10/10 Extreme 99% chance of damaging wind over 30 yrs
- Air quality 2/10 Low 2 unhealthy d/yr today · 2 by 30 yrs out
Nearby sold comps map
Loading sold comps map…
Walkable amenities ~0.75 mi
Loading nearby amenities…
Taxation est. · year 1
- Rental income
- $25,116
- − Mortgage interest
- −$11,763
- − Property taxes
- −$2,657
- − Insurance
- −$1,847
- − Repairs & maintenance
- −$2,009
- − Management
- −$2,009
- − Depreciation
- −$6,109
- Taxable loss
- −$1,279
- Est. tax savings @ 24.0%
- +$307
- After-tax cash flow
- $2,429/yr
For passive investors: Depreciation is non-cash, so a rental often shows a tax loss while cash-flowing — sheltering income. Rental losses are passive: they offset passive income freely, and up to $25,000/yr can offset ordinary (W-2) income if you actively participate and your MAGI is under $100k (phasing out to $0 by $150k); unused losses carry forward. On sale, claimed depreciation is recaptured at up to 25%, and gains may owe capital-gains tax (a 1031 exchange can defer both). Figures are a year-1 estimate at your 24.0% rate — not tax advice; consult a CPA.
Schools (NCES district)
- District
- Jefferson Parish
- NCES district ID
- 2200840
- Math proficiency
- 24% ▼ -36.00%
- Reading proficiency
- 34% ▼ -30.00%
- Median HH income
- $48,421
- Composite
- 25.19/100
- National rank
- #7511
- State rank
- #44 of 98 in LA
Livability — Harvey
- Score
- 64/100
- State rank
- #166
- US rank
- #13980
Category grades
Schools grade is shown separately in the Schools card above.
Census & demographics
- County
- Jefferson Parish · 426,999 people
- City population
- 39,578
- Metro
- New Orleans-Metairie, LA
- Population (ZIP)
- 39,578
- Household income
- $62,416
- Rent vs Own
- Severe rent burden
- 1992.0
Population outlook (Jefferson County) Hauer SSP2
- Today (2025)
- 451,696 people
- By 2030
- 455,451 · +0.8%
- By 2040
- 458,308 · +1.5%
- By 2050
- 461,031 · +2.1%
- By 2075
- 476,351 · +5.5%
- By 2100
- 499,377 · +10.6%
Race, ethnicity, and origin ACS 2023
- Neighborhood character
- Diverse neighborhood (Simpson 0.60)
- Race & ethnicity
- Black 58% White 20% Hispanic / Latino 13% Asian 7% Two or more races 4%
- Hispanic origin (detail)
- Mexican 1% Dominican 1%
- Common ancestry
- Lithuanian 4% Hispanic 1%
- Foreign-born
- 13% · Canada, Vietnam
- Languages at home
- 81% English-only · Spanish 10% Vietnamese 5% French/Haitian/Cajun 2%
Political lean MEDSL · Jefferson
- 2024 margin
- R (+12.9) · D 42.5% · R 55.5% · Other 2.1%
- 2008→2024 swing
- +13.6pp toward D · 2008: -26.6pp · 2024: -12.9pp
- All cycles
- 2024: R+12.9 2020: R+11.1 2016: R+14.8 2012: R+18.4 2008: R+26.6
Not yet ingested
- Civics
- —
Market trends
- HPI YoY
- ▼ -96.82%
- Current HPI
- 156.1052
- Rent YoY
- ▼ -3.88%
- Metro
- New Orleans-Metairie, LA
- State GDP YoY
- ▲ 3.29%
- F500 in state
- 10
Industry mix (Fortune 500 HQ in LA)
| Industry | F500 HQs | Revenue |
|---|---|---|
| Telecommunications | 2 | $23B |
|
||
| Utilities | 1 | $12B |
|
||
| Wholesale / Distribution | 1 | $5B |
|
||
| Advertising | 1 | $2B |
|
||
Price history
+84.4% since first listed11 events — show timeline
- 2026-05-20 Price Changed $210,000 AcadianaMLS
- 2026-05-19 Price Changed $210,000 GSREIN
- 2026-04-12 Listed for Rent $2,000 RAAMLS
- 2026-01-28 Listed $220,000 GSREIN
- 2026-01-28 Listed $220,000 AcadianaMLS
- 2022-03-18 Sold (MLS) $210,000 GSREIN
- 2022-02-15 Pending — GSREIN
- 2022-02-11 Listed $195,000 GSREIN
- 2022-02-11 Listed $195,000 AcadianaMLS
- 2010-05-26 Sold (Public Records) $146,000 Public Records
- 2004-06-01 Sold (Public Records) $113,900 Public Records
Property tax history
+4.5%/yrLatest (2025): $2,657 · +0.3% YoY. Source: county tax records.
Cash-flow waterfall
monthlySold comps — $/sqft
last 12 mo · ≤1 miLoading sold comps…