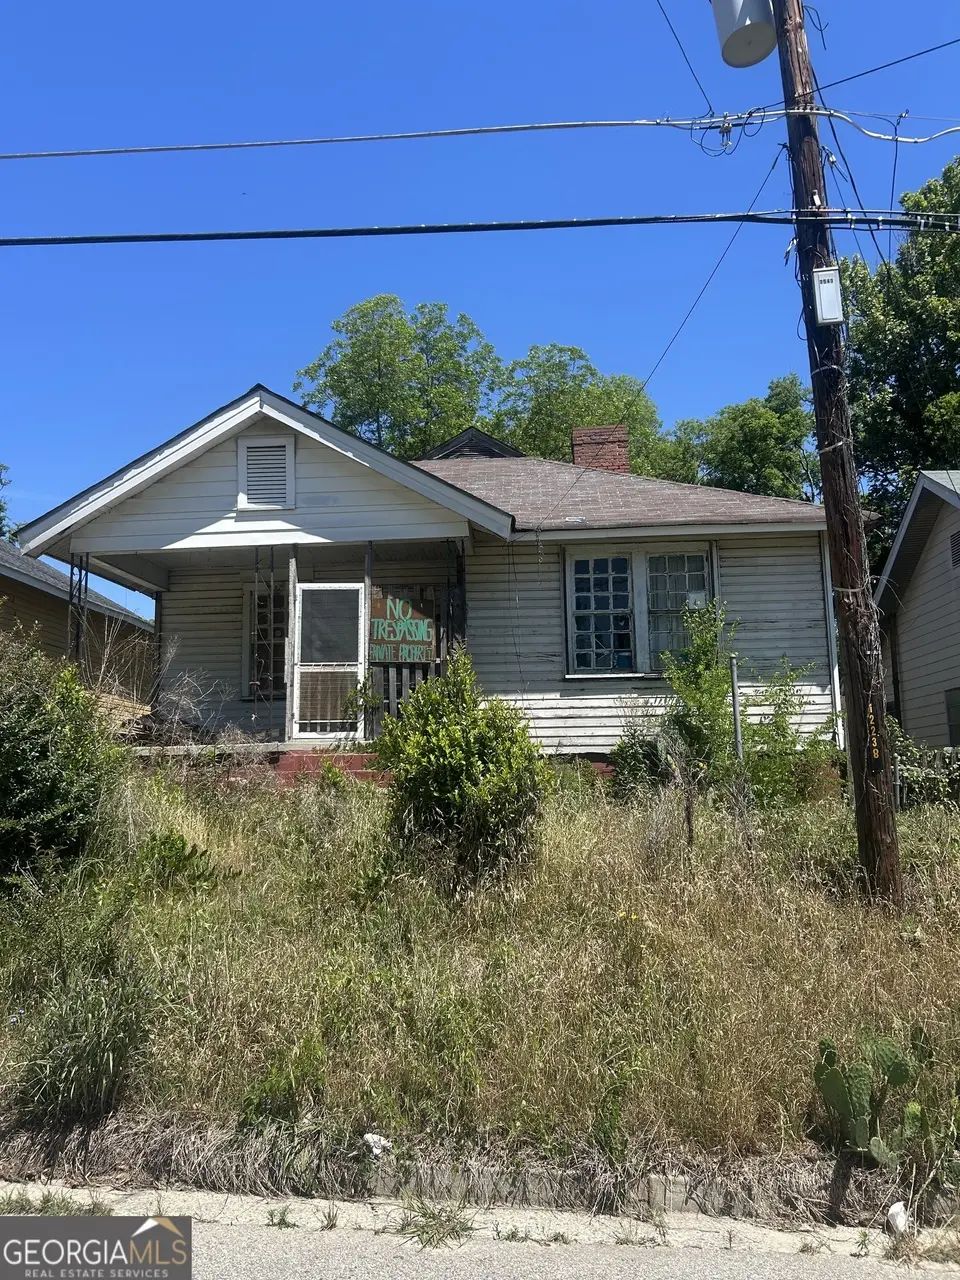
3543 Brookdale Ave · Macon-Bibb County, GA
Flood risk 1/10 · Minimal
- FEMA flood zone
- X (unshaded)
- Chance of flooding over 30 yrs
- 0.0%
- Est. flood insurance / yr
- $507 – $1,088
Fire risk 1/10 · Minimal
- Est. fire insurance / yr
- $963 – $1,789
Heat risk 7/10 · Major
- Hot days now (above 108°F)
- 7 days/yr
- Hot days in 30 yrs
- 17 days/yr
Wind risk 6/10 · Moderate
- Chance of severe wind over 30 yrs
- 66.0%
Air-quality risk 4/10 · Minor
- Unhealthy air days now
- 3 days/yr
- Unhealthy air days in 30 yrs
- 5 days/yr
Risk factors via First Street. Map © Google.
Why this score? — see what drove the D grade
The composite is a weighted blend of 9 inputs, each scored 0–100. Each bar is that input's sub-score; the figure is the points it added to the 100-point composite (weight × sub-score).
- Cash flow +15.0/30.0
- ARV discount +7.5/15.0
- 1% rule +5.0/10.0
- DSCR +5.0/10.0
- Rent growth +3.7/5.0
- Livability +2.5/5.0
- Condition / age +2.5/5.0
- Schools +1.2/10.0
- Appreciation +0.0/10.0
$25,000
🖨 Deal sheet 📄 Offer letter ✓ Due diligence
Listing remarks
Investment opportunity located near the historic Vineville Historic District, offering convenient access to downtown Macon. This property is ideally positioned for easy commuting, shopping, and dining, making it a great option for investors or buyers looking to add value. While the home does require TLC, it has solid structure and is ready for someone with vision to unlock its full potential. Whether you're looking to renovate and resell or create a long term rental, this property presents a promising opportunity in a well-established area.
Key facts
- Solid structure
- 6,534 sq ft lot
- Built 1942
Tags
Neighborhood map
What this means for you Summary
Snapshot
- This is a 3-bed/1.0-bath single-family listed at $25k.
Deal economics
- At list price, monthly cash flow is $783 ($9k/yr) — positive.
- The deal already cash-flows at list — no discount required.
- Meets the 1% rule at list price ($1k rent vs $25k).
- Recommended offer: $25k (1.5% below list) — sets the bar for market timing.
- Cap rate 43.9% vs local median 5.4% in Macon-Bibb County — top-decile yield for the area; either an underpriced asset or a hidden risk that comps aren't pricing in. Stress-test before assuming the spread holds.
Location & tenants
- Location reads: area grade D — affects rentability + tenant quality, not the cash-flow math above.
- Bibb County (urban): math 11% / reading 18% proficiency, ranked #161 of 174 in GA (top 92%) — low school quality limits family demand, transient renter base, plan for 1-2y turnover; 75% free/reduced lunch — lower-income household profile, screen leases tightly.
- Market conditions: Rents rising fast (+4.6%/yr); 255 active listings in the ZIP; 40 comparable units currently listed for rent nearby; rentals at typical pace (median 21d on market — plan ~3-4 weeks tenant-placement turnaround); lower-income renter base — watch delinquency; 154 units permitted in Bibb County in 2024 (0 in 5+ unit buildings).
- This rent runs 37% of the median local income ($39k/yr) — at the standard rent-burdened threshold; future hikes will face affordability resistance.
Forward outlook
- Local home prices are declining (-3.0%/yr); year-one equity from $173 of loan paydown is wiped out by about $750 of value loss. Plan a longer hold.
- Bibb County population projected at -12% by 2050 — secular population decline; favor cash flow + early exit over multi-decade hold.
- At projected returns (-3.0% appreciation + 4.6% rent growth), your $7k cash investment doubles in ~1 year — after that, you're playing with house money.
Negotiation context
- It's been on market 30 days — a 2% lower offer ($25k) is reasonable based on typical stale-listing flexibility.
Risks & watch-outs
- Watch-outs: built in 1942 — expect roof / HVAC / electrical / plumbing capex.
- Climate carrying-cost: major wind risk, 66% chance of damaging wind over 30y; extreme-heat days projected 7→17/yr by 2055 (HVAC capex compounding) — expect insurance premiums to compound above CPI over the hold.
Questions for the listing agent
- Built in 1942 — when were the roof, HVAC, electrical panel, plumbing, and water heater last replaced?
- Is there a deadline driving the sale (1031 exchange, divorce, estate, relocation)? That informs how much negotiation room exists.
- The area grade is low — what's the realistic commute time and amenity access for the typical tenant pool here? Any planned neighborhood developments (good or bad) we should know about?
- What's the average days-on-market for RENTAL listings here right now (not sales)? A rising rental-DOM trend means longer vacancies and softer asking-rent achievability than the comps imply.
- What's the recent tenant-quality profile in this submarket — average credit score on applications, eviction rate, late-payment / NSF rate, and stable-employment percentage? A property-management company in the area should have these aggregated.
- How much new for-sale + rental construction is in the pipeline within 1–3 miles? Heavy new supply typically softens prices + rents 12–24 months out; constrained supply supports both.
Investment metrics
- 1% rule
- 4.79% ✓
- Cap rate
- 43.87%
- Cash-on-cash
- 134.22%
- DSCR
- 6.97
- GRM
- 1.7
CMA / ARV
- ARV (median comp)
- $61,611
- List price
- $25,000
- Delta
- -59.42%
- Verdict
- UNDERPRICED
- Comps
- 20 within 1.0 mi
Show comp detail 12 sales within ~0.75 mi
| Address | Dist | Beds/Ba | Sqft | Sold | Price | $/sf | Match |
|---|---|---|---|---|---|---|---|
| 3449 Ridge Ave | 0.41mi | 3/1.5 | 1,526 (+6%) | 10mo | $213,000 | $140 | 60 |
| 173 Gardner St | 0.30mi | 4/2.0 (+1) | 1,590 (+11%) | 1mo | $79,000 | $50 | 58 |
| 3717 Avon Rd | 0.56mi | 3/2.0 | 1,412 (-2%) | 11mo | $260,000 | $184 | 58 |
| 239 Belvedere Dr | 0.48mi | 3/2.0 | 1,485 (+3%) | 13mo | $263,000 | $177 | 57 |
| 3432 Vineville Ave | 0.26mi | 2/0.5 (-1) | 1,277 (-11%) | 7mo | $85,000 | $67 | 57 |
| 3481 Hillcrest Ave | 0.52mi | 3/2.0 | 1,545 (+8%) | 10mo | $115,000 | $74 | 50 |
| 3698 Berkley Dr | 0.49mi | 3/2.0 | 1,616 (+12%) | 4mo | $250,000 | $155 | 49 |
| 3928 Grand Ave | 0.47mi | 4/2.5 (+1) | 1,333 (-7%) | 9mo | $70,000 | $53 | 48 |
| 3715 American Blvd | 0.36mi | 2/1.5 (-1) | 1,242 (-14%) | 11mo | $48,500 | $39 | 45 |
| 3470 Habersham Ave | 0.67mi | 2/1.0 (-1) | 1,540 (+7%) | 9mo | $27,500 | $18 | 44 |
| 4106 Mumford Rd | 0.69mi | 3/1.0 | 1,276 (-11%) | 11mo | $109,900 | $86 | 40 |
| 3419 Hillcrest Rd | 0.73mi | 2/2.0 (-1) | 1,268 (-12%) | 11mo | $75,000 | $59 | 28 |
Match score weights: distance 35% · size 25% · config 20% · recency 20%. Top-matched comps best support the ARV.
Projected returns pro-forma
-3.0% appreciation · 4.61% rent growth · sell at horizon
- IRR
- —
- Equity multiple
- 7.83×
- Total profit
- $47,797
- Equity at exit
- $3,728
- IRR
- —
- Equity multiple
- 17.32×
- Total profit
- $114,232
- Equity at exit
- $2,162
Cash invested: $7,000 (down + closing). Projections, not guarantees.
Landlord ↔ Tenant lean methodology
- Overall (STATE)
- 90 Strongly Landlord-Friendly
- State Georgia
- 90 Strongly Landlord-Friendly · R+3
- County
- — inherits STATE
- City
- — inherits STATE
ZIP-level market 31204
- Rents YoY
- 4.6%
- Active inventory
- 255
- Price-to-rent
- 1.7×
Monthly cashflow live
- Estimated rent
- $1,197 high interval (Pro) →
- Mortgage (P&I)
- −$131
- Tax from tax record
- −$21 /mo · $251/yr
- Insurance
- −$10
- HOA
- −$0
- Vacancy / Maint / Mgmt
- −$251
- Net cashflow
- $783
Break-even live
UW: 25.0% down · 7.5% · 30yr · 1.5% tax · 5.0% vac · 8.0% maint · 8.0% mgmt
Financing live
Cash to close
- Down payment
- $6,250
- Closing costs
- $750
- Reserves months
- —
- Total cash needed
- —
Loan-product check · same deal, 3 products live
Conventional
25% down · 7.5% · 30yr
- Down + closing
- —
- Monthly P&I
- —
- Monthly cashflow
- —
- DSCR
- —
- Eligible?
- —
Personal DTI + credit; lowest rate.
DSCR
20% down · 8.5% · 30yr
- Down + closing
- —
- Monthly P&I
- —
- Monthly cashflow
- —
- DSCR
- —
- Eligible?
- —
No personal income docs; deal must DSCR.
Hard money
10% down · 12.0% · 12mo
- Down + closing
- —
- Monthly P&I
- —
- Monthly cashflow
- —
- DSCR
- —
- Eligible?
- —
Short-term bridge; refi at stabilization.
Rent comps 40 comps
| Address | Beds | Baths | Sqft | Rent | $/sqft | DOM | Units | Dist |
|---|---|---|---|---|---|---|---|---|
| 3495 Charleston Cir Macon, GA | 3.0 | 1.0 | 1048 | $875 | $0.83 | 44d | 1 | 0.19mi |
| 3495 Charleston Cir Macon, GA | 3.0 | 1.0 | 1048 | $799 | $0.76 | 21d | 1 | 0.19mi |
| 3324 Vineville Ave Unit 63B Macon, GA | 2.0 | 1.0 | 1125 | $1,050 | $0.93 | 21d | 1 | 0.23mi |
| 3324 Vineville Ave Unit 57C Macon, GA | 2.0 | 1.0 | 914 | $1,050 | $1.15 | 13d | 1 | 0.23mi |
| 3469 Kingsbury Dr Macon, GA | 4.0 | 2.0 | 1100 | $1,295 | $1.18 | 44d | 1 | 0.23mi |
| 3413 Vineville Ave Unit 3419 Macon, GA | 3.0 | 1.5 | 1200 | $1,200 | $1.00 | 21d | 1 | 0.29mi |
| 3840 Napier Ave Macon, GA | 3.0 | 1.0 | 1365 | $1,350 | $0.99 | 13d | 1 | 0.30mi |
| 3330 Ridge Ave Unit D4 Macon, GA | 2.0 | 1.5 | 1056 | $1,050 | $0.99 | 13d | 1 | 0.31mi |
| 3834 Mercer St Macon, GA | 2.0 | 1.0 | 1000 | $875 | $0.88 | 44d | 1 | 0.35mi |
| 133 Auburn Ave Macon, GA | 2.0 | 1.0 | 880 | $895 | $1.02 | 44d | 1 | 0.36mi |
| 4033 N Napier Ave Unit 6 Macon, GA | 2.0 | 1.5 | 1000 | $850 | $0.85 | 44d | 1 | 0.39mi |
| 3775 Grand Ave Macon, GA | 3.0 | 2.0 | 1240 | $1,175 | $0.95 | 13d | 1 | 0.40mi |
| 3588 Morgan Dr Macon, GA | 4.0 | 1.0 | 1080 | $1,200 | $1.11 | 21d | 1 | 0.44mi |
| 201 Ridgewood Ave Macon, GA | 3.0 | 1.5 | 1600 | $1,200 | $0.75 | 21d | 1 | 0.45mi |
| 209 Ridgewood Ave Unit 209 Macon, GA | 3.0 | 1.5 | 1600 | $1,200 | $0.75 | 21d | 1 | 0.49mi |
| 3346 Shaw Dr Macon, GA | 3.0 | 1.0 | 1094 | $895 | $0.82 | 21d | 1 | 0.59mi |
| 4145 Forest Ave W Macon, GA | 3.0 | 1.0 | 1285 | $1,195 | $0.93 | 44d | 1 | 0.61mi |
| 3320 Guthrie Dr Macon, GA | 4.0 | 2.0 | 1800 | $1,500 | $0.83 | 44d | 1 | 0.66mi |
| 3634 Dawn St Macon, GA | 3.0 | 1.0 | 999 | $850 | $0.85 | 44d | 1 | 0.69mi |
| 4126 Ayers Rd Macon, GA | 2.0 | 1.0 | 900 | $750 | $0.83 | 13d | 1 | 0.70mi |
| 3266 Highpoint Dr Unit 593-B Macon, GA | 2.0 | 1.5 | 1120 | $1,100 | $0.98 | 44d | 1 | 0.74mi |
| 230 Roycrest Dr Macon, GA | 3.0 | 2.0 | 1261 | $1,300 | $1.03 | 44d | 1 | 0.75mi |
| 4250 Ayers Rd Macon, GA | 2.0 | 1.0 | 1008 | $1,100 | $1.09 | 13d | 1 | 0.81mi |
| 3163 High Point Dr Macon, GA | 3.0 | 1.0 | 1100 | $1,125 | $1.02 | 21d | 1 | 0.82mi |
| 1076 Carlisle Ave Macon, GA | 3.0 | 1.0 | 1025 | $1,065 | $1.04 | 21d | 1 | 0.95mi |
| 4353 Barrington Pl Macon, GA | 2.0 | 1.5 | 1108 | $1,000 | $0.90 | 13d | 1 | 0.98mi |
| 1097 Edna Pl Macon, GA | 2.0 | 1.0 | 1299 | $1,300 | $1.00 | 44d | 1 | 0.99mi |
| 4342 Barrington Pl Macon, GA | 2.0 | 1.5 | 1092 | $950 | $0.87 | 21d | 1 | 1.00mi |
| 2755 Vineville Ave Unit B Macon, GA | 3.0 | 2.0 | 900 | $1,375 | $1.53 | 44d | 1 | 1.07mi |
| 255 Hawthorn Trl Macon, GA | 3.0 | 2.5 | 1566 | $1,545 | $0.99 | 44d | 1 | 1.12mi |
| 1187 Edna Pl Unit S-0501 Macon, GA | 3.0 | 2.0 | 1200 | $1,000 | $0.83 | 21d | 1 | 1.16mi |
| 1187 Edna Pl Unit S-0503 Macon, GA | 3.0 | 2.0 | 1200 | $1,125 | $0.94 | 21d | 1 | 1.16mi |
| 1187 Edna Pl Unit S-1208 Macon, GA | 2.0 | 2.0 | 1000 | $850 | $0.85 | 13d | 1 | 1.16mi |
| 1187 Edna Pl Unit S-1206 Macon, GA | 2.0 | 2.0 | 1000 | $1,060 | $1.06 | 21d | 1 | 1.16mi |
| 1196 Mimosa Dr Macon, GA | 3.0 | 2.0 | 1200 | $1,300 | $1.08 | 21d | 1 | 1.19mi |
| 919 Inverness Ave Macon, GA | 3.0 | 2.0 | 1676 | $1,549 | $0.92 | 21d | 1 | 1.27mi |
| 371 Ironwood Ct Macon, GA | 3.0 | 2.5 | 1648 | $1,745 | $1.06 | 21d | 1 | 1.29mi |
| 371 Ironwood Ct Macon, GA | 3.0 | 2.5 | 1648 | $1,745 | $1.06 | 44d | 1 | 1.29mi |
| 373 Ironwood Ct Macon, GA | 3.0 | 2.5 | 1648 | $1,745 | $1.06 | 44d | 1 | 1.29mi |
| 373 Ironwood Ct Macon, GA | 3.0 | 2.5 | 1648 | $1,745 | $1.06 | 21d | 1 | 1.29mi |
Listing history 6 events
-
2026-06-03days on market $25,000 Active 30 DOM
-
2026-06-02days on market $25,000 Active 29 DOM
-
2026-06-01days on market $25,000 Active 28 DOM
-
2026-05-31statusdays on market $25,000 Active 27 DOM
-
2026-05-30days on market $25,000 Price Change 26 DOM
-
2026-05-03$38,000 New 546-char remark
ⓘ Source: listings_history table (triggers on properties + properties_extension) + one-shot
backfill from property_details.listing_events for pre-trigger history.
Tax reassessment forecast GA · Resets to sale price
- Current annual tax
- $251 · $21/mo
- Projected year-2 tax
- $251 · $21/mo
- Expected delta
- $0/yr ($0/mo · 0.0%)
ⓘ Screening estimate from a state-policy table — verify with the county assessor before closing.
Climate risk First Street
- Flood 1/10 Low FEMA zone X (unshaded) · 0% chance over 30 yrs
- Wildfire 1/10 Low
- Heat 7/10 Severe 7 d/yr ≥108°F today · 17 d/yr by 30 yrs out
- Wind 6/10 Major 66% chance of damaging wind over 30 yrs
- Air quality 4/10 Moderate 3 unhealthy d/yr today · 5 by 30 yrs out
Nearby sold comps map
Loading sold comps map…
Walkable amenities ~0.75 mi
Loading nearby amenities…
Taxation est. · year 1
- Rental income
- $14,360
- − Mortgage interest
- −$1,400
- − Property taxes
- −$251
- − Insurance
- −$125
- − Repairs & maintenance
- −$1,149
- − Management
- −$1,149
- − Depreciation
- −$727
- Taxable income
- $9,559
- Est. tax owed @ 24.0%
- −$2,294
- After-tax cash flow
- $7,101/yr
For passive investors: Depreciation is non-cash, so a rental often shows a tax loss while cash-flowing — sheltering income. Rental losses are passive: they offset passive income freely, and up to $25,000/yr can offset ordinary (W-2) income if you actively participate and your MAGI is under $100k (phasing out to $0 by $150k); unused losses carry forward. On sale, claimed depreciation is recaptured at up to 25%, and gains may owe capital-gains tax (a 1031 exchange can defer both). Figures are a year-1 estimate at your 24.0% rate — not tax advice; consult a CPA.
Schools (NCES district)
- District
- Bibb County
- NCES district ID
- 1300420
- Math proficiency
- 11% ▼ -14.00%
- Reading proficiency
- 18% ▼ -11.00%
- Median HH income
- $37,426
- Composite
- 12.13/100
- National rank
- #9654
- State rank
- #161 of 174 in GA
Livability — Macon-Bibb County
No livability data for this city. (Only ~50 U.S. cities are tracked.)
Census & demographics
- Census place
- Macon-Bibb County, GA
- County
- Bibb County · 164,332 people
- City population
- 143,186
- Metro
- Macon-Bibb County, GA
- Population (ZIP)
- 32,421
- Household income
- $38,784
- Rent vs Own
- Severe rent burden
- 2674.0
Population outlook (Bibb County) Hauer SSP2
- Today (2025)
- 148,772 people
- By 2030
- 145,904 · -1.9%
- By 2040
- 139,404 · -6.3%
- By 2050
- 131,603 · -11.5%
- By 2075
- 111,050 · -25.4%
- By 2100
- 83,346 · -44.0%
Race, ethnicity, and origin ACS 2023
- Neighborhood character
- Predominantly Black (65%)
- Race & ethnicity
- Black 65% White 28% Hispanic / Latino 3% Two or more races 2% Asian 1%
- Common ancestry
- Serbian 2% Slovak 1% Lithuanian 1%
- Foreign-born
- 2% · Canada
- Languages at home
- 96% English-only · Spanish 2% French/Haitian/Cajun 1%
Political lean MEDSL · Bibb
- 2024 margin
- Strong D (+22.4) · D 61.0% · R 38.5%
- 2008→2024 swing
- +4.4pp toward D · 2008: 18.0pp · 2024: 22.4pp
- All cycles
- 2024: D+22.4 2020: D+23.8 2016: D+20.2 2012: D+20.0 2008: D+18.0
Not yet ingested
- Civics
- —
Market trends
- HPI YoY
- ▼ -135.44%
- Current HPI
- 194.5459
- Rent YoY
- ▲ 4.61%
- Metro
- Macon-Bibb County, GA
- State GDP YoY
- ▲ 2.66%
- F500 in state
- 28
Industry mix (Fortune 500 HQ in GA)
| Industry | F500 HQs | Revenue |
|---|---|---|
| Paper / Packaging | 2 | $29B |
|
||
| Retail | 1 | $160B |
|
||
| Transportation / Logistics | 1 | $91B |
|
||
| Airlines | 1 | $62B |
|
||
| Consumer Goods | 1 | $47B |
|
||
| Utilities | 1 | $25B |
|
||
Price history
1 event — show timeline
- 2026-05-28 Price Changed $25,000 GAMLS
Property tax history
+0.4%/yrLatest (2025): $251 · -1.8% YoY. Source: county tax records.
Cash-flow waterfall
monthlySold comps — $/sqft
last 12 mo · ≤1 miLoading sold comps…