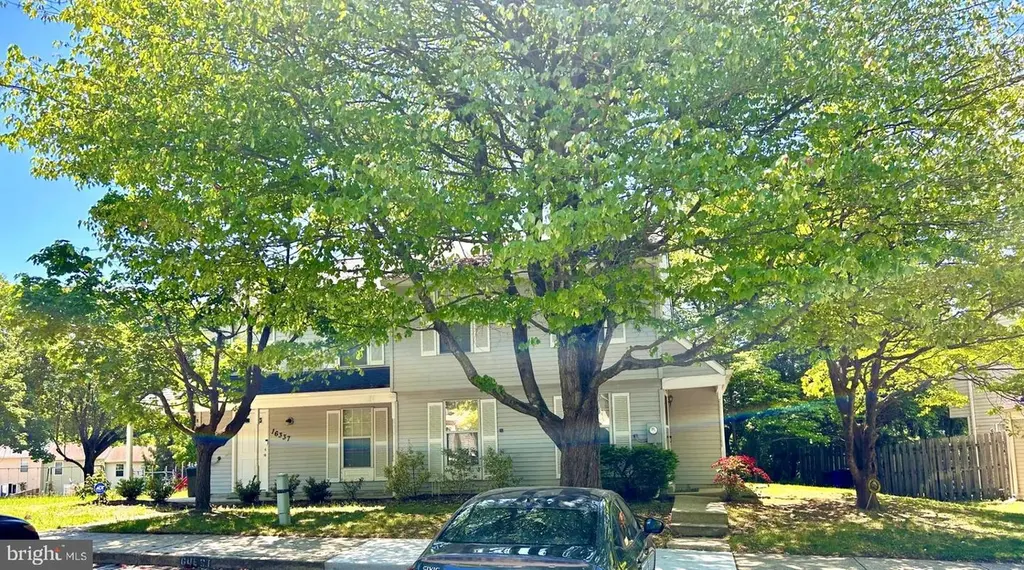
16335 Pewter Ln · Bowie, MD
Flood risk 1/10 · Minimal
- FEMA flood zone
- X (unshaded)
- Chance of flooding over 30 yrs
- 0.0%
- Est. flood insurance / yr
- $507 – $1,088
Fire risk 3/10 · Minor
- Est. fire insurance / yr
- $755 – $1,403
Heat risk 8/10 · Major
- Hot days now (above 103°F)
- 7 days/yr
- Hot days in 30 yrs
- 16 days/yr
Wind risk 6/10 · Moderate
- Chance of severe wind over 30 yrs
- 27.0%
Air-quality risk 4/10 · Minor
- Unhealthy air days now
- 4 days/yr
- Unhealthy air days in 30 yrs
- 6 days/yr
Risk factors via First Street. Map © Google.
Why this score? — see what drove the D grade
The composite is a weighted blend of 9 inputs, each scored 0–100. Each bar is that input's sub-score; the figure is the points it added to the 100-point composite (weight × sub-score).
- Cash flow +14.9/30.0
- ARV discount +7.7/15.0
- DSCR +4.5/10.0
- 1% rule +4.4/10.0
- Rent growth +3.7/5.0
- Livability +3.6/5.0
- Condition / age +2.5/5.0
- Schools +1.7/10.0
- Appreciation +0.0/10.0
$340,000
🖨 Deal sheet (PDF) 📄 Offer letter ✓ Due diligence
Listing remarks
Welcome to this charming end-unit duplex featuring 3 bedrooms and 2.5 bathrooms. The main level offers a spacious living area with a cozy wood-burning fireplace, perfect for relaxing evenings at home. The large kitchen provides ample space with room for a table, making it ideal for everyday dining. Sliding glass doors lead to the deck, creating an easy flow for outdoor enjoyment. A convenient powder room and full-size washer and dryer (5 years old) complete the main level. Upstairs, you’ll find three bedrooms and two full bathrooms, including a private primary bath. The end-unit location provides added natural light and a more open feel. An attic with pull down stairs, two large close
Key facts
- $96 HOA
- 2 parking spots
- Community pool
Property features AI
Finance
- HOA & community: Monthly HOA fee covering common area maintenance, management and snow removal; Community amenities include common grounds, tennis courts and playground
Exterior
- Parking: Two assigned paved parking spaces; Free assigned parking
- Utilities: Public water; Public sewer; Municipal trash service; Electric hot water
- Home design: End-of-row townhouse; Fee simple ownership; Building not winterized
- Construction: Frame construction; Slab foundation
- Exterior features: Deck(s); Sidewalks; Street lights; Corner lot with front, rear and side yards; Community in-ground pool
Interior
- Kitchen: Eat-in kitchen with table space; Dishwasher; Disposal; Icemaker; Microwave; Refrigerator; Stove
- Bedrooms: Three bedrooms on the first upper level
- Flooring: Carpet
- Bathrooms: Two full bathrooms (all upper levels); One half bathroom on the main level
- Heating & cooling: Heat pump heating; Central air conditioning; Ceiling fans; Electric heating and cooling systems
- Interior features: Traditional floor plan; Ceiling fans; Drywall walls and ceilings; Tub with shower; Master bath
- Laundry & utility: Washer and dryer in unit on the main floor; Electric water heater
Neighborhood map
What this means for you Summary
Snapshot
- This is a 3-bed/1.5-bath townhouse listed at $340k.
Deal economics
- At list price, monthly cash flow is $97 ($1k/yr) — positive.
- The deal already cash-flows at list — no discount required.
- To meet the 1% rule (rent ≥ 1% of price), the offer needs to be $319k (6.3% below list).
- Recommended offer: $319k (6.3% below list) — sets the bar for 1% rule.
- Cap rate 6.6% vs local median 4.0% in Bowie — top-decile yield for the area; either an underpriced asset or a hidden risk that comps aren't pricing in. Stress-test before assuming the spread holds.
Location & tenants
- Location reads 71/100 on livability (#159 in MD) — a middle-class / working-renter tenant base. Strengths: employment A+, housing A+; Watch: health & safety C-, amenities F, commute F.
- Prince George'S County Public Schools (suburban): math 8% / reading 24% proficiency, ranked #21 of 24 in MD (top 88%) — low school quality limits family demand, transient renter base, plan for 1-2y turnover.
- Zoned schools: Pointer Ridge Elementary (math 8% / reading 22%, grade F, #463 of 860 statewide, top 55%, 318 students, 58% FRL); Benjamin Tasker Middle School (math 11% / reading 41%, grade F, #91 of 225 statewide, top 42%, 1,044 students, 52% FRL); Bowie High (math 31% / reading 73%, grade D+, #100 of 222 statewide, top 47%, 2,460 students, 48% FRL) — zoned schools at 53% FRL track the district average.
- Zoned-school proficiency averages 31% at this address vs 16% district-wide (+15 pts) — the actual schools serving this property are materially stronger than the Prince George'S County Public Schools average implies; a family-tenant draw the district grade alone would hide.
- Market conditions: Rents rising fast (+4.6%/yr); 172 active listings in the ZIP; 2 comparable units currently listed for rent nearby; high-income renter base; 1,481 units permitted in Prince George's County in 2024 (0 in 5+ unit buildings).
- This rent runs 31% of the median local income ($125k/yr) — at the standard rent-burdened threshold; future hikes will face affordability resistance.
Forward outlook
- Local home prices are declining (-3.0%/yr); year-one equity from $2k of loan paydown is wiped out by about $10k of value loss. Plan a longer hold.
- Prince George's County population projected at +18% by 2050 — long-run rental-demand tailwind backs the buy-and-hold thesis.
Negotiation context
- Only 4 days on market — expect competitive offers; lowballing is unlikely to land.
- Current owner paid $105k; list at $340k implies a 224% gain — meaningful room to come down on a strong offer.
Risks & watch-outs
- Climate carrying-cost: major wind risk, 27% chance of damaging wind over 30y; extreme-heat days projected 7→16/yr by 2055 (HVAC capex compounding) — expect insurance premiums to compound above CPI over the hold.
Questions for the listing agent
- What does the HOA fee cover, when was the last increase, and are there any pending special assessments or reserve-fund shortfalls?
- Is there a deadline driving the sale (1031 exchange, divorce, estate, relocation)? That informs how much negotiation room exists.
- The area grade is low — what's the realistic commute time and amenity access for the typical tenant pool here? Any planned neighborhood developments (good or bad) we should know about?
- What's the average days-on-market for RENTAL listings here right now (not sales)? A rising rental-DOM trend means longer vacancies and softer asking-rent achievability than the comps imply.
- What's the recent tenant-quality profile in this submarket — average credit score on applications, eviction rate, late-payment / NSF rate, and stable-employment percentage? A property-management company in the area should have these aggregated.
- How much new for-sale + rental construction is in the pipeline within 1–3 miles? Heavy new supply typically softens prices + rents 12–24 months out; constrained supply supports both.
Investment metrics
- 1% rule
- 0.94% ✗
- Cap rate
- 6.64%
- Cash-on-cash
- 1.22%
- DSCR
- 1.05
- GRM
- 8.9
CMA / ARV
- ARV (on-the-fly)
- $341,264
- Comps found
- 10
Show comp detail 10 sales within ~0.75 mi
| Address | Dist | Beds/Ba | Sqft | Sold | Price | $/sf | Match |
|---|---|---|---|---|---|---|---|
| 16420 Pennsbury Dr | 0.13mi | 3/2.0 | 1,120 (+1%) | 7mo | $360,000 | $321 | 84 |
| 905 Pleasant Hill Ln | 0.13mi | 2/3.0 (-1) | 1,120 (+1%) | 1mo | $375,000 | $335 | 81 |
| 1120 Pewter Ct | 0.08mi | 3/1.5 | 1,240 (+12%) | 1mo | $370,000 | $298 | 76 |
| 1112 Patriot Ln | 0.05mi | 3/1.5 | 1,160 (+5%) | 20mo | $330,000 | $284 | 73 |
| 908 Pleasant Hill Ln | 0.14mi | 3/1.5 | 1,120 (+1%) | 24mo | $332,000 | $296 | 72 |
| 935 Pleasant Hill Ln | 0.09mi | 2/2.5 (-1) | 1,120 (+1%) | 16mo | $345,000 | $308 | 71 |
| 1104 Pewter Ct | 0.09mi | 2/2.5 (-1) | 1,240 (+12%) | 0mo | $365,000 | $294 | 66 |
| 913 Pleasant Hill Ln | 0.11mi | 3/2.0 | 1,160 (+5%) | 24mo | $359,900 | $310 | 65 |
| 1211 Patriot Ln | 0.14mi | 2/2.5 (-1) | 1,160 (+5%) | 19mo | $361,999 | $312 | 61 |
| 16321 Pewter Ln | 0.04mi | 2/2.5 (-1) | 1,240 (+12%) | 17mo | $320,000 | $258 | 55 |
Match score weights: distance 35% · size 25% · config 20% · recency 20%. Top-matched comps best support the ARV.
Projected returns pro-forma
-3.0% appreciation · 4.61% rent growth · sell at horizon
- IRR
- -12.5%
- Equity multiple
- 0.54×
- Total profit
- $-43,587
- Equity at exit
- $50,695
- IRR
- -1.1%
- Equity multiple
- 0.92×
- Total profit
- $-7,401
- Equity at exit
- $29,397
Cash invested: $95,200 (down + closing). Projections, not guarantees.
Landlord ↔ Tenant lean methodology
- Overall (STATE)
- 27 Tenant-Leaning
- State Maryland
- 27 Tenant-Leaning · D+14
- County
- — inherits STATE
- City
- — inherits STATE
ZIP-level market 20716
- Rents YoY
- 4.6%
- Active inventory
- 172
- Price-to-rent
- 8.9×
Monthly cashflow live
- Estimated rent
- $3,186 medium interval (Pro) →
- Mortgage (P&I)
- −$1,783
- Tax from tax record
- −$399 /mo · $4,788/yr
- Insurance
- −$142
- HOA
- −$96
- Vacancy / Maint / Mgmt
- −$669
- Net cashflow
- $97
Break-even live
Sensitivity live
| Price | -10% $289 | -5% $193 | +0% $97 | +5% $1 | +10% $-96 |
|---|---|---|---|---|---|
| Rent | -10% $-155 | -5% $-29 | +0% $97 | +5% $223 | +10% $349 |
| Rate | -1.0pp $268 | -0.5pp $183 | base $97 | +0.5pp $9 | +1.0pp $-81 |
UW: 25.0% down · 7.5% · 30yr · 1.5% tax · 5.0% vac · 8.0% maint · 8.0% mgmt
Financing live
Cash to close
- Down payment
- $85,000
- Closing costs
- $10,200
- Reserves months
- —
- Total cash needed
- —
Loan-product check · same deal, 3 products live
Conventional
25% down · 7.5% · 30yr
- Down + closing
- —
- Monthly P&I
- —
- Monthly cashflow
- —
- DSCR
- —
- Eligible?
- —
Personal DTI + credit; lowest rate.
DSCR
20% down · 8.5% · 30yr
- Down + closing
- —
- Monthly P&I
- —
- Monthly cashflow
- —
- DSCR
- —
- Eligible?
- —
No personal income docs; deal must DSCR.
Hard money
10% down · 12.0% · 12mo
- Down + closing
- —
- Monthly P&I
- —
- Monthly cashflow
- —
- DSCR
- —
- Eligible?
- —
Short-term bridge; refi at stabilization.
Rent comps 2 comps
| Address | Beds | Baths | Sqft | Rent | $/sqft | DOM | Units | Dist |
|---|---|---|---|---|---|---|---|---|
| 149 Lawndale Dr Bowie, MD | 3.0 | 2.5 | 1454 | $3,399 | $2.34 | 7d | 1 | 0.61mi |
| 620 Fairmont Dr Bowie, MD | 1.0–3.0 | 1.0–2.0 | 1167 | $3,410 | $2.92 | 0d | 38 | 0.92mi |
HOA detail
- Monthly dues
- $96 · $1,152/yr
Listing history 16 events
-
2026-06-21days on market $340,000 Active 4 DOM
-
2026-06-18statusdays on market $340,000 Active 1 DOM
-
2026-06-17days on market $340,000 Coming Soon 32 DOM
-
2026-06-16days on market $340,000 Coming Soon 31 DOM
-
2026-06-15days on market $340,000 Coming Soon 30 DOM
-
2026-06-13days on market $340,000 Coming Soon 28 DOM
-
2026-06-10days on market $340,000 Coming Soon 24 DOM
-
2026-06-08days on market $340,000 Coming Soon 23 DOM
-
2026-06-07days on market $340,000 Coming Soon 22 DOM
-
2026-06-04days on market $340,000 Coming Soon 19 DOM
-
2026-06-03days on market $340,000 Coming Soon 18 DOM
-
2026-06-02days on market $340,000 Coming Soon 17 DOM
-
2026-06-01days on market $340,000 Coming Soon 16 DOM
-
2026-05-31days on market $340,000 Coming Soon 15 DOM
-
2026-05-16historical $340,000
-
1988-09-28soldstatus $105,000
ⓘ Source: listings_history table (triggers on properties + properties_extension) + one-shot
backfill from property_details.listing_events for pre-trigger history.
Tax reassessment forecast MD · Partial reset (capped growth)
- Current annual tax
- $4,788 · $399/mo
- Projected year-2 tax
- $4,788 · $399/mo
- Expected delta
- $0/yr ($0/mo · 0.0%)
ⓘ Screening estimate from a state-policy table — verify with the county assessor before closing.
Climate risk First Street
- Flood 1/10 Low FEMA zone X (unshaded) · 0% chance over 30 yrs
- Wildfire 3/10 Moderate
- Heat 8/10 Severe 7 d/yr ≥103°F today · 16 d/yr by 30 yrs out
- Wind 6/10 Major 27% chance of damaging wind over 30 yrs
- Air quality 4/10 Moderate 4 unhealthy d/yr today · 6 by 30 yrs out
Nearby sold comps map
Loading sold comps map…
Walkable amenities ~0.75 mi
Loading nearby amenities…
Taxation est. · year 1
- Rental income
- $38,227
- − Mortgage interest
- −$19,045
- − Property taxes
- −$4,788
- − Insurance
- −$1,700
- − Repairs & maintenance
- −$3,058
- − Management
- −$3,058
- − HOA
- −$1,152
- − Depreciation
- −$9,891
- Taxable loss
- −$4,466
- Est. tax savings @ 24.0%
- +$1,072
- After-tax cash flow
- $2,235/yr
For passive investors: Depreciation is non-cash, so a rental often shows a tax loss while cash-flowing — sheltering income. Rental losses are passive: they offset passive income freely, and up to $25,000/yr can offset ordinary (W-2) income if you actively participate and your MAGI is under $100k (phasing out to $0 by $150k); unused losses carry forward. On sale, claimed depreciation is recaptured at up to 25%, and gains may owe capital-gains tax (a 1031 exchange can defer both). Figures are a year-1 estimate at your 24.0% rate — not tax advice; consult a CPA.
Schools (NCES district)
- District
- Prince George'S County Public Schools
- NCES district ID
- 2400510
- Math proficiency
- 8% ▼ -11.00%
- Reading proficiency
- 24% ▼ -9.00%
- Median HH income
- $73,967
- Composite
- 16.82/100
- National rank
- #9151
- State rank
- #21 of 24 in MD
Livability — Bowie
- Score
- 71/100
- State rank
- #159
- US rank
- #7194
Category grades
Schools grade is shown separately in the Schools card above.
Census & demographics
- Census place
- Bowie, MD
- County
- Prince Georges County · 919,866 people
- City population
- 105,324
- Metro
- Washington-Arlington-Alexandria, DC-VA-MD-WV
- Population (ZIP)
- 22,362
- Household income
- $125,034
- Rent vs Own
- Severe rent burden
- 913.0
Population outlook (Prince George's County) Hauer SSP2
- Today (2025)
- 1,005,426 people
- By 2030
- 1,048,416 · +4.3%
- By 2040
- 1,123,425 · +11.7%
- By 2050
- 1,183,220 · +17.7%
- By 2075
- 1,306,202 · +29.9%
- By 2100
- 1,408,179 · +40.1%
Race, ethnicity, and origin ACS 2023
- Neighborhood character
- Predominantly Black (67%)
- Race & ethnicity
- Black 67% White 17% Hispanic / Latino 9% Two or more races 6% Asian 3%
- Hispanic origin (detail)
- Mexican 2% Puerto Rican 2% Dominican 2%
- Common ancestry
- Swiss 1% Slovak 1% Romanian 1%
- Foreign-born
- 17% · Canada
- Languages at home
- 81% English-only · Spanish 7% French/Haitian/Cajun 3% Other Indo-European 1%
Political lean MEDSL · Prince George's
- 2024 margin
- Solid D (+75.2) · D 86.3% · R 11.2% · Other 2.5%
- 2008→2024 swing
- -3.3pp toward R · 2008: 78.5pp · 2024: 75.2pp
- All cycles
- 2024: D+75.2 2020: D+80.5 2016: D+81.0 2012: D+80.9 2008: D+78.5
Not yet ingested
- Civics
- —
Market trends
- HPI YoY
- ▼ -302.27%
- Current HPI
- 285.1976
- Rent YoY
- ▲ 4.61%
- Metro
- Washington-Arlington-Alexandria, DC-VA-MD-WV
- State GDP YoY
- ▲ 2.97%
- F500 in state
- 12
Industry mix (Fortune 500 HQ in MD)
| Industry | F500 HQs | Revenue |
|---|---|---|
| Aerospace / Defense | 1 | $71B |
|
||
| Utilities | 1 | $25B |
|
||
| Hotels | 1 | $24B |
|
||
| Consumer Goods | 1 | $7B |
|
||
| Real Estate | 1 | $6B |
|
||
| Chemicals | 1 | $2B |
|
||
Price history
+223.8% since first listed2 events — show timeline
- 2026-05-16 Coming Soon $340,000 BRIGHT MLS
- 1988-09-28 Sold (Public Records) $105,000 Public Records
Property tax history
+6.1%/yrLatest (2025): $4,788 · +8.9% YoY. Source: county tax records.
Cash-flow waterfall
monthlySold comps — $/sqft
last 12 mo · ≤1 miLoading sold comps…