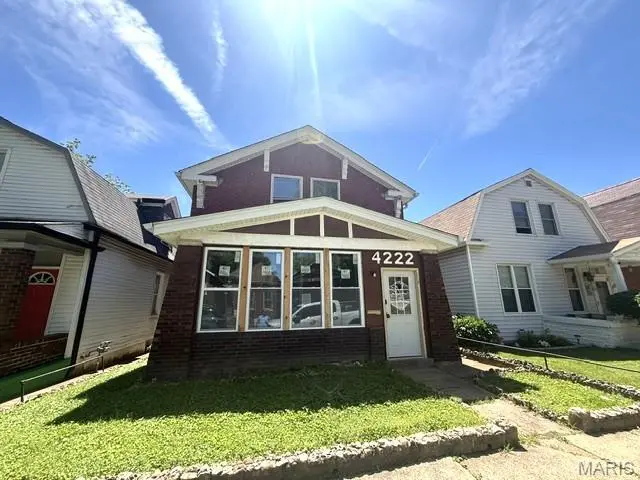
4222 Osceola St · St. Louis, MO
Flood risk 1/10 · Minimal
- FEMA flood zone
- X (unshaded)
- Chance of flooding over 30 yrs
- 0.0%
- Est. flood insurance / yr
- $473 – $860
Fire risk 1/10 · Minimal
- Est. fire insurance / yr
- $1,054 – $1,958
Heat risk 5/10 · Moderate
- Hot days now (above 108°F)
- 7 days/yr
- Hot days in 30 yrs
- 21 days/yr
Wind risk 2/10 · Minimal
- Chance of severe wind over 30 yrs
- 1.0%
Air-quality risk 3/10 · Minor
- Unhealthy air days now
- 3 days/yr
- Unhealthy air days in 30 yrs
- 4 days/yr
Risk factors via First Street. Map © Google.
Why this score? — see what drove the B- grade
The composite is a weighted blend of 9 inputs, each scored 0–100. Each bar is that input's sub-score; the figure is the points it added to the 100-point composite (weight × sub-score).
- Cash flow +30.0/30.0
- 1% rule +10.0/10.0
- DSCR +10.0/10.0
- ARV discount +7.5/15.0
- Rent growth +3.2/5.0
- Livability +2.5/5.0
- Condition / age +2.5/5.0
- Schools +1.2/10.0
- Appreciation +0.0/10.0
$76,000
🖨 Deal sheet 📄 Offer letter ✓ Due diligence
Listing remarks
Check out this 3 bedroom, spacious home loaded with potential. Home features large rooms, detached garage, and level yard. Don't wait! This one won't last long! This property is offered in its current AS IS condition; all utilities are turned off.
Key facts
- Level yard
- Detached garage
- 3,598 sq ft lot
Tags
Property features AI
Finance
- Financial info: Lease not considered
Exterior
- Parking: One-car garage
- Utilities: Public water; Public sewer; Electric service by Ameren; Electricity available
- Home design: Single-family residence; Two levels
- Construction: Brick construction
- Exterior features: Back yard
Interior
- Bedrooms: Three bedrooms on the upper level
- Bathrooms: One full bathroom on the upper/main levels
- Heating & cooling: Other heating; Other cooling
- Interior features: Unfinished basement
Neighborhood map
What this means for you Summary
Snapshot
- This is a 3-bed/1.0-bath single-family listed at $76k.
Deal economics
- At list price, monthly cash flow is $426 ($5k/yr) — positive.
- The deal already cash-flows at list — no discount required.
- Meets the 1% rule at list price ($1k rent vs $76k).
- Recommended offer: $75k (1.5% below list) — sets the bar for market timing.
- Cap rate 13.0% vs local median 5.0% in St. Louis — top-decile yield for the area; either an underpriced asset or a hidden risk that comps aren't pricing in. Stress-test before assuming the spread holds.
Location & tenants
- Location reads: area grade B — affects rentability + tenant quality, not the cash-flow math above.
- St. Louis City (urban): math 10% / reading 18% proficiency, ranked #312 of 324 in MO (top 96%) — low school quality limits family demand, transient renter base, plan for 1-2y turnover; 80% free/reduced lunch — lower-income household profile, screen leases tightly.
- Zoned schools: Oak Hill Elem. (math 12% / reading 12%, grade F, #1,016 of 1,115 statewide, top 92%, 238 students, 99% FRL); Roosevelt High (math 2% / reading 8%, grade F, #517 of 521 statewide, top 100%, 460 students, 99% FRL) — zoned schools average 99% FRL vs 80% district-wide (18 pts higher); higher-poverty schools than district average — tighter screening recommended.
- Market conditions: Rents rising (+2.6%/yr); 255 active listings in the ZIP; 40 comparable units currently listed for rent nearby; rentals at typical pace (median 24d on market — plan ~3-4 weeks tenant-placement turnaround); 294 units permitted in St. Louis city in 2024 (227 in 5+ unit buildings).
Forward outlook
- Local home prices are declining (-3.0%/yr); year-one equity from $525 of loan paydown is wiped out by about $2k of value loss. Plan a longer hold.
- St. Louis County population projected to shrink 6% by 2050 — rents likely to lag national; underwrite the cash flow, not the appreciation.
- At projected returns (-3.0% appreciation + 2.6% rent growth), your $21k cash investment doubles in ~6 years — after that, you're playing with house money.
Negotiation context
- It's been on market 27 days — a 2% lower offer ($75k) is reasonable based on typical stale-listing flexibility.
Risks & watch-outs
- Watch-outs: built in 1908 — expect roof / HVAC / electrical / plumbing capex.
- Climate carrying-cost: extreme-heat days projected 7→21/yr by 2055 (HVAC capex compounding) — expect insurance premiums to compound above CPI over the hold.
Questions for the listing agent
- Built in 1908 — when were the roof, HVAC, electrical panel, plumbing, and water heater last replaced?
- Is there a deadline driving the sale (1031 exchange, divorce, estate, relocation)? That informs how much negotiation room exists.
- What's the average days-on-market for RENTAL listings here right now (not sales)? A rising rental-DOM trend means longer vacancies and softer asking-rent achievability than the comps imply.
- What's the recent tenant-quality profile in this submarket — average credit score on applications, eviction rate, late-payment / NSF rate, and stable-employment percentage? A property-management company in the area should have these aggregated.
- How much new for-sale + rental construction is in the pipeline within 1–3 miles? Heavy new supply typically softens prices + rents 12–24 months out; constrained supply supports both.
Investment metrics
- 1% rule
- 1.57% ✓
- Cap rate
- 13.02%
- Cash-on-cash
- 24.01%
- DSCR
- 2.07
- GRM
- 5.3
CMA / ARV
- ARV (on-the-fly)
- $190,960
- Comps found
- 12
Show comp detail 12 sales within ~0.75 mi
| Address | Dist | Beds/Ba | Sqft | Sold | Price | $/sf | Match |
|---|---|---|---|---|---|---|---|
| 4323 Bingham Ave | 0.15mi | 2/1.0 (-1) | 1,200 (-3%) | 0mo | $79,900 | $67 | 83 |
| 4333 Ellenwood Ave | 0.21mi | 2/1.0 (-1) | 1,172 (-5%) | 1mo | $165,000 | $141 | 76 |
| 4359 Tholozan Ave | 0.40mi | 3/1.0 | 1,313 (+7%) | 2mo | $225,000 | $171 | 69 |
| 4448 Itaska St | 0.48mi | 3/2.0 | 1,200 (-3%) | 1mo | $195,000 | $163 | 69 |
| 4410 Wallace St | 0.48mi | 2/1.0 (-1) | 1,192 (-3%) | 1mo | $215,000 | $180 | 66 |
| 4314 Ellenwood Ave | 0.21mi | 3/1.5 | 1,415 (+15%) | 1mo | $219,900 | $155 | 62 |
| 4417 Wallace St | 0.47mi | 3/1.5 | 1,129 (-8%) | 1mo | $183,000 | $162 | 61 |
| 4125 Miami St | 0.51mi | 2/1.0 (-1) | 1,312 (+6%) | 0mo | $250,000 | $191 | 60 |
| 4467 Wilcox Ave | 0.63mi | 2/1.0 (-1) | 1,172 (-5%) | 2mo | $109,900 | $94 | 56 |
| 4435 Miami St | 0.50mi | 2/1.0 (-1) | 1,354 (+10%) | 2mo | $199,900 | $148 | 54 |
| 4267 Miami St | 0.44mi | 2/2.0 (-1) | 1,368 (+11%) | 2mo | $149,900 | $110 | 51 |
| 4404 S 39th St | 0.75mi | 2/2.0 (-1) | 1,120 (-9%) | 2mo | $164,900 | $147 | 40 |
Match score weights: distance 35% · size 25% · config 20% · recency 20%. Top-matched comps best support the ARV.
Projected returns pro-forma
-3.0% appreciation · 2.62% rent growth · sell at horizon
- IRR
- 16.8%
- Equity multiple
- 1.67×
- Total profit
- $14,359
- Equity at exit
- $11,332
- IRR
- 25.1%
- Equity multiple
- 3.14×
- Total profit
- $45,619
- Equity at exit
- $6,571
Cash invested: $21,280 (down + closing). Projections, not guarantees.
Landlord ↔ Tenant lean methodology
- Overall (STATE)
- 81 Strongly Landlord-Friendly
- State Missouri
- 81 Strongly Landlord-Friendly · R+10
- County
- — inherits STATE
- City
- — inherits STATE
ZIP-level market 63116
- Rents YoY
- 2.6%
- Active inventory
- 255
- Price-to-rent
- 5.3×
Monthly cashflow live
- Estimated rent
- $1,191 high interval (Pro) →
- Mortgage (P&I)
- −$399
- Tax from tax record
- −$85 /mo · $1,017/yr
- Insurance
- −$32
- HOA
- −$0
- Vacancy / Maint / Mgmt
- −$250
- Net cashflow
- $426
Break-even live
UW: 25.0% down · 7.5% · 30yr · 1.5% tax · 5.0% vac · 8.0% maint · 8.0% mgmt
Financing live
Cash to close
- Down payment
- $19,000
- Closing costs
- $2,280
- Reserves months
- —
- Total cash needed
- —
Loan-product check · same deal, 3 products live
Conventional
25% down · 7.5% · 30yr
- Down + closing
- —
- Monthly P&I
- —
- Monthly cashflow
- —
- DSCR
- —
- Eligible?
- —
Personal DTI + credit; lowest rate.
DSCR
20% down · 8.5% · 30yr
- Down + closing
- —
- Monthly P&I
- —
- Monthly cashflow
- —
- DSCR
- —
- Eligible?
- —
No personal income docs; deal must DSCR.
Hard money
10% down · 12.0% · 12mo
- Down + closing
- —
- Monthly P&I
- —
- Monthly cashflow
- —
- DSCR
- —
- Eligible?
- —
Short-term bridge; refi at stabilization.
Rent comps 40 comps
| Address | Beds | Baths | Sqft | Rent | $/sqft | DOM | Units | Dist |
|---|---|---|---|---|---|---|---|---|
| 4274 Ellenwood Ave Unit 1E St. Louis, MO | 2.0 | 1.0 | 800 | $995 | $1.24 | 43d | 1 | 0.19mi |
| 3741 Morgan Ford Rd St. Louis, MO | 2.0 | 1.0 | 800 | $895 | $1.12 | 23d | 1 | 0.21mi |
| 3737 Morgan Ford Rd Apt F St. Louis, MO | 2.0 | 1.0 | 800 | $895 | $1.12 | 19d | 1 | 0.21mi |
| 3729 Morgan Ford Rd Apt G St. Louis, MO | 2.0 | 1.0 | 800 | $895 | $1.12 | 23d | 1 | 0.21mi |
| 3729 Morgan Ford Rd St. Louis, MO | 2.0 | 1.0 | 800 | $895 | $1.12 | 19d | 1 | 0.21mi |
| 4215 Neosho St Unit 101 St. Louis, MO | 2.0 | 1.0 | 750 | $825 | $1.10 | 43d | 1 | 0.26mi |
| 4215 Gannett St Unit 1F St. Louis, MO | 2.0 | 1.0 | 1148 | $1,025 | $0.89 | 10d | 1 | 0.31mi |
| 4428 Ellenwood Ave Saint Louis, MO | 2.0 | 1.0 | 900 | $1,225 | $1.36 | 43d | 1 | 0.32mi |
| 4413 Delor St Unit 2F St. Louis, MO | 2.0 | 1.0 | 1010 | $1,125 | $1.11 | 23d | 1 | 0.51mi |
| 3955 Winnebago St Saint Louis, MO | 2.0 | 1.0 | 1125 | $1,395 | $1.24 | 23d | 1 | 0.56mi |
| 4945 Winona Ave Unit 4945A St. Louis, MO | 2.0 | 1.0 | 1150 | $1,200 | $1.04 | 23d | 1 | 0.67mi |
| 4645 Wilcox Ave Unit 1st Floor St. Louis, MO | 2.0 | 1.0 | 1150 | $1,375 | $1.20 | 21d | 1 | 0.68mi |
| 5111 Cologne Ave Saint Louis, MO | 2.0 | 1.0 | 800 | $1,050 | $1.31 | 43d | 1 | 0.70mi |
| 3923 Miami St Unit 2F St. Louis, MO | 2.0 | 1.0 | 849 | $1,050 | $1.24 | 21d | 1 | 0.71mi |
| 4950 Sutherland Ave Unit 1F St. Louis, MO | 2.0 | 1.0 | 1056 | $1,295 | $1.23 | 10d | 1 | 0.72mi |
| 4980 Tholozan Ave Unit 4980A St. Louis, MO | 2.0 | 1.0 | 1100 | $1,395 | $1.27 | 21d | 1 | 0.72mi |
| 5006 Christy Blvd Unit 1st Fl St. Louis, MO | 3.0 | 1.0 | 1100 | $1,450 | $1.32 | 43d | 1 | 0.74mi |
| 4177 Schiller Pl Saint Louis, MO | 2.0 | 1.0 | 1200 | $1,150 | $0.96 | 23d | 1 | 0.74mi |
| 3630 Hydraulic Ave Unit 1 St. Louis, MO | 2.0 | 1.0 | 800 | $1,050 | $1.31 | 14d | 1 | 0.77mi |
| 3860 Bamberger Ave Unit 1N St. Louis, MO | 2.0 | 1.0 | 850 | $799 | $0.94 | 10d | 1 | 0.78mi |
| 3860 Bamberger Ave Unit 3N St. Louis, MO | 2.0 | 1.0 | 700 | $799 | $1.14 | 17d | 1 | 0.78mi |
| 5046 Winona Ave Unit B St. Louis, MO | 3.0 | 1.0 | 1057 | $1,650 | $1.56 | 19d | 1 | 0.81mi |
| 5415 Dresden Ave Saint Louis, MO | 2.0 | 1.5 | 935 | $1,200 | $1.28 | 23d | 1 | 0.84mi |
| 4710 Eichelberger St Unit First St. Louis, MO | 2.0 | 1.0 | 888 | $900 | $1.01 | 43d | 1 | 0.87mi |
| 4028 Schiller Pl Saint Louis, MO | 2.0 | 1.0 | 802 | $1,440 | $1.80 | 43d | 1 | 0.88mi |
| 4053 Giles Ave Unit A St. Louis, MO | 2.0 | 1.0 | 1082 | $995 | $0.92 | 10d | 1 | 0.89mi |
| 4455 S 38th St Saint Louis, MO | 3.0 | 1.0 | 1000 | $1,000 | $1.00 | 23d | 1 | 0.89mi |
| 5033 Ulena Ave Saint Louis, MO | 2.0 | 1.0 | 960 | $1,575 | $1.64 | 43d | 1 | 0.91mi |
| 4000 Schiller Pl Saint Louis, MO | 2.0 | 2.5 | 1448 | $1,618 | $1.12 | 7d | 1 | 0.91mi |
| 4766 Dahlia Ave Saint Louis, MO | 2.0 | 1.0 | 1184 | $1,695 | $1.43 | 3d | 1 | 0.94mi |
| 5970 Wanda Ave Saint Louis, MO | 4.0 | 2.0 | 1282 | $1,995 | $1.56 | 17d | 1 | 0.96mi |
| 5300 Bancroft Ave Unit A St. Louis, MO | 2.0 | 1.0 | 1404 | $1,295 | $0.92 | 23d | 1 | 0.97mi |
| 3525 Giles Ave Unit D St. Louis, MO | 2.0 | 1.0 | 900 | $1,495 | $1.66 | 23d | 1 | 1.01mi |
| 3539 Giles Ave St. Louis, MO | 2.0 | 1.0 | 925 | $1,050 | $1.14 | 43d | 1 | 1.02mi |
| 5836 Goener Ave Unit 2F St. Louis, MO | 3.0 | 1.0 | 1250 | $1,500 | $1.20 | 43d | 1 | 1.03mi |
| 3161 Alfred Ave St. Louis, MO | 2.0 | 1.0 | 1400 | $1,435 | $1.02 | 14d | 1 | 1.04mi |
| 3765 Delor St Unit 37651-F St. Louis, MO | 2.0 | 1.5 | 900 | $1,225 | $1.36 | 23d | 1 | 1.04mi |
| 5336 Chippewa St Saint Louis, MO | 2.0 | 1.0 | 960 | $1,575 | $1.64 | 23d | 1 | 1.05mi |
| 4005 S Grand Blvd Saint Louis, MO | 4.0 | 1.0 | 1323 | $1,150 | $0.87 | 16d | 1 | 1.05mi |
| 3702 Meramec St Unit 1e St. Louis, MO | 2.0 | 1.0 | 725 | $950 | $1.31 | 7d | 1 | 1.05mi |
Listing history 14 events
-
2026-06-18days on market $76,000 Active 27 DOM
-
2026-06-17days on market $76,000 Active 26 DOM
-
2026-06-16days on market $76,000 Active 25 DOM
-
2026-06-15days on market $76,000 Active 24 DOM
-
2026-06-13days on market $76,000 Active 22 DOM
-
2026-06-09days on market $76,000 Active 18 DOM
-
2026-06-08days on market $76,000 Active 17 DOM
-
2026-06-07days on market $76,000 Active 16 DOM
-
2026-06-05status $76,000 Active 13 DOM
-
2026-06-02statusdays on market $76,000 Pending 13 DOM
-
2026-06-01days on market $76,000 Active 12 DOM
-
2026-05-31days on market $76,000 Active 11 DOM
-
2026-05-20$76,000 Active
-
1992-07-27soldstatus
ⓘ Source: listings_history table (triggers on properties + properties_extension) + one-shot
backfill from property_details.listing_events for pre-trigger history.
Tax reassessment forecast MO · Resets to sale price
- Current annual tax
- $1,017 · $85/mo
- Projected year-2 tax
- $1,017 · $85/mo
- Expected delta
- $0/yr ($0/mo · 0.0%)
ⓘ Screening estimate from a state-policy table — verify with the county assessor before closing.
Climate risk First Street
- Flood 1/10 Low FEMA zone X (unshaded) · 0% chance over 30 yrs
- Wildfire 1/10 Low
- Heat 5/10 Major 7 d/yr ≥108°F today · 21 d/yr by 30 yrs out
- Wind 2/10 Low 100% chance of damaging wind over 30 yrs
- Air quality 3/10 Moderate 3 unhealthy d/yr today · 4 by 30 yrs out
Nearby sold comps map
Loading sold comps map…
Walkable amenities ~0.75 mi
Loading nearby amenities…
Taxation est. · year 1
- Rental income
- $14,289
- − Mortgage interest
- −$4,257
- − Property taxes
- −$1,017
- − Insurance
- −$380
- − Repairs & maintenance
- −$1,143
- − Management
- −$1,143
- − Depreciation
- −$2,211
- Taxable income
- $4,138
- Est. tax owed @ 24.0%
- −$993
- After-tax cash flow
- $4,116/yr
For passive investors: Depreciation is non-cash, so a rental often shows a tax loss while cash-flowing — sheltering income. Rental losses are passive: they offset passive income freely, and up to $25,000/yr can offset ordinary (W-2) income if you actively participate and your MAGI is under $100k (phasing out to $0 by $150k); unused losses carry forward. On sale, claimed depreciation is recaptured at up to 25%, and gains may owe capital-gains tax (a 1031 exchange can defer both). Figures are a year-1 estimate at your 24.0% rate — not tax advice; consult a CPA.
Schools (NCES district)
- District
- St. Louis City
- NCES district ID
- 2929280
- Math proficiency
- 10% ▼ -6.00%
- Reading proficiency
- 18% ▼ -3.00%
- Median HH income
- $35,685
- Composite
- 11.54/100
- National rank
- #9699
- State rank
- #312 of 324 in MO
Livability — St. Louis
No livability data for this city. (Only ~50 U.S. cities are tracked.)
Census & demographics
- Census place
- St. Louis, MO
- County
- Saint Louis City · 254,015 people
- City population
- 283,259
- Metro
- St. Louis, MO-IL
- Population (ZIP)
- 42,170
- Household income
- $61,433
- Rent vs Own
- Severe rent burden
- 1923.0
Population outlook (St. Louis County) Hauer SSP2
- Today (2025)
- 315,737 people
- By 2030
- 313,865 · -0.6%
- By 2040
- 305,439 · -3.3%
- By 2050
- 296,529 · -6.1%
- By 2075
- 271,028 · -14.2%
- By 2100
- 255,359 · -19.1%
Race, ethnicity, and origin ACS 2023
- Neighborhood character
- Diverse neighborhood (Simpson 0.63)
- Race & ethnicity
- White 54% Black 27% Hispanic / Latino 10% Two or more races 8% Asian 5%
- Hispanic origin (detail)
- Mexican 7%
- Common ancestry
- Lithuanian 4% Romanian 2% Italian 2%
- Foreign-born
- 11% · Canada, Vietnam, Philippines
- Languages at home
- 85% English-only · Spanish 6% Vietnamese 2% Arabic 2%
Political lean MEDSL · St. Louis
- 2024 margin
- Solid D (+64.7) · D 81.4% · R 16.7% · Other 2.0%
- 2008→2024 swing
- -3.5pp toward R · 2008: 68.2pp · 2024: 64.7pp
- All cycles
- 2024: D+64.7 2020: D+66.2 2016: D+63.7 2012: D+66.6 2008: D+68.2
Not yet ingested
- Civics
- —
Market trends
- HPI YoY
- ▼ -271.19%
- Current HPI
- 215.7108
- Rent YoY
- ▲ 2.62%
- Metro
- St. Louis, MO-IL
- State GDP YoY
- ▲ 1.84%
- F500 in state
- 20
Industry mix (Fortune 500 HQ in MO)
| Industry | F500 HQs | Revenue |
|---|---|---|
| Healthcare | 1 | $163B |
|
||
| Insurance | 1 | $21B |
|
||
| Industrial Technology | 1 | $17B |
|
||
| Retail | 1 | $16B |
|
||
| Industrial Distribution | 1 | $10B |
|
||
| Utilities | 1 | $9B |
|
||
Price history
2 events — show timeline
- 2026-05-20 Listed $76,000 MARIS as Distributed by MLS Grid
- 1992-07-27 Sold (Public Records) — Public Records
Property tax history
+5.3%/yrLatest (2024): $1,017 · +5.0% YoY. Source: county tax records.
Cash-flow waterfall
monthlySold comps — $/sqft
last 12 mo · ≤1 miLoading sold comps…