 Fourplex
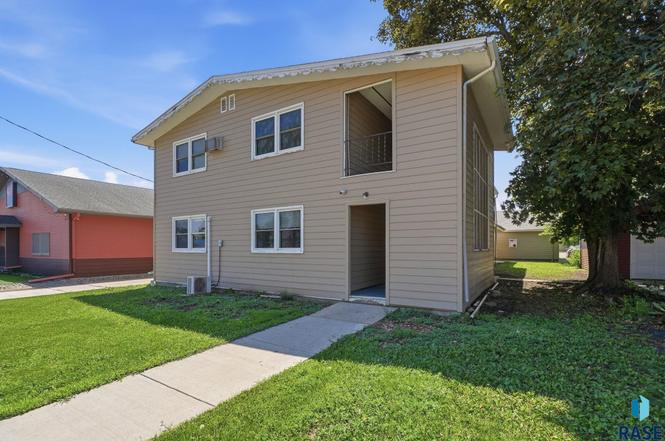
511 -517 Main St S St S · Lennox, SD
Flood risk No data
- FEMA flood zone
- —
- Chance of flooding over 30 yrs
- —
- Est. flood insurance / yr
- —
Fire risk No data
- Est. fire insurance / yr
- —
Heat risk 3/10 · Minor
- Hot days now (above threshold)
- 7 days/yr
- Hot days in 30 yrs
- 14 days/yr
Wind risk No data
- Chance of severe wind over 30 yrs
- —
Air-quality risk 2/10 · Minimal
- Unhealthy air days now
- 1 days/yr
- Unhealthy air days in 30 yrs
- 1 days/yr
Risk factors via First Street. Map © Google.
Why this score? — see what drove the B+ grade
The composite is a weighted blend of 9 inputs, each scored 0–100. Each bar is that input's sub-score; the figure is the points it added to the 100-point composite (weight × sub-score).
- Cash flow +30.0/30.0
- ARV discount +15.0/15.0
- DSCR +10.0/10.0
- 1% rule +8.8/10.0
- Schools +5.2/10.0
- Livability +3.6/5.0
- Condition / age +2.8/5.0
- Rent growth +2.5/5.0
- Appreciation +0.0/10.0
$325,000
🖨 Deal sheet (PDF) 📄 Offer letter ✓ Due diligence
Multi-family units
County records classify this as Multi-Family (5+ Unit). Listing-text estimate: 4 units. estimate disagrees with records
5+ unit building — per-unit beds/baths from public records are typically unavailable; the breakdown below (if shown) is an estimate from the listing text.
Key facts
- 5 plex opportunity
- Newer boiler
- 4 stall garage
Tags
Property features AI
Finance
- Other: Bedroom counts vary by unit
- Financial info: Five rental units total; Rents: four 2-bed units at $625 each; one 1-bed unit at $750; Owner pays gas, water, trash collection, grounds care, snow removal, and sewer
Exterior
- Parking: Detached parking (garage condition could change)
- Utilities: Public water; Public sewer; Natural gas
- Home design: Two-story multifamily building; HardiPlank-type siding
- Construction: Block foundation; Composition roof
- Exterior features: Private entry; Lot approximately 142 x 50
Interior
- Kitchen: Refrigerator; Range
- Bedrooms: Four units with 2 bedrooms each; one unit with 1 bedroom
- Flooring: Carpet; Laminate
- Bathrooms: Each unit has 1 bathroom
- Heating & cooling: Baseboard and radiant heating; Natural gas heating; Window air conditioning units
- Interior features: Full basement; Carpet and laminate flooring
- Laundry & utility: Owner pays gas, water, and sewer
Neighborhood map
What this means for you Summary
Snapshot
- This is a 4 × 2-bed/1.2-bath units multifamily listed at $325k. Condition is rated average.
Deal economics
- At list price, monthly cash flow is $1k ($16k/yr) — positive. Per door: $327/mo.
- The deal already cash-flows at list — no discount required.
- Meets the 1% rule at list price ($4k rent vs $325k).
- Cap rate 11.1% vs local median 1.8% in Lennox — top-decile yield for the area; either an underpriced asset or a hidden risk that comps aren't pricing in. Stress-test before assuming the spread holds.
Location & tenants
- Location reads 71/100 on livability (#50 in SD) — a middle-class / working-renter tenant base. Strengths: crime A+, cost of living A+, housing A+; Watch: amenities F, commute F, health & safety D-.
- Lennox School District 41-4 (rural): math 56% / reading 64% proficiency, ranked #5 of 59 in SD (top 8%) — acceptable for families but not a draw, mixed tenant base, ~2y average lease; only 12% free/reduced lunch — higher-income household profile.
- Zoned schools: Lennox Elementary - 02 (math 72% / reading 67%, grade A-, #19 of 253 statewide, top 12%, 369 students, 16% FRL); Lennox Jr. High - 08 (math 57% / reading 67%, grade B+, #13 of 143 statewide, top 11%, 189 students, 15% FRL); Lennox High School - 01 (math 32% / reading 77%, grade C-, #53 of 151 statewide, top 41%, 359 students, 14% FRL) — zoned schools at 15% FRL track the district average.
- Market conditions: 56 active listings in the ZIP; 232 units permitted in Lincoln County in 2024 (14 in 5+ unit buildings).
Forward outlook
- Local home prices are declining (-3.0%/yr); year-one equity from $2k of loan paydown is wiped out by about $10k of value loss. Plan a longer hold.
- Lincoln County population projected at +66% by 2050 — long-run rental-demand tailwind backs the buy-and-hold thesis.
- At projected returns (-3.0% appreciation + 3.0% rent growth), your $91k cash investment doubles in ~7 years — after that, you're playing with house money.
Negotiation context
- Only 10 days on market — expect competitive offers; lowballing is unlikely to land.
Questions for the listing agent
- Can we see the unit-by-unit rent roll, current vacancy, and any below-market leases? What's the average tenancy length?
- What capital expenditures (roof, boiler, parking lot, exteriors) have been made in the last 5 years, and what's planned in the next 2?
- Built in 1969 — when were the roof, HVAC, electrical panel, plumbing, and water heater last replaced?
- Is there a deadline driving the sale (1031 exchange, divorce, estate, relocation)? That informs how much negotiation room exists.
- Schools are B-rated — typically a magnet for longer-tenancy family renters. What's the average tenant stay here, and is there a school-zone premium baked into asking?
- What's the average days-on-market for RENTAL listings here right now (not sales)? A rising rental-DOM trend means longer vacancies and softer asking-rent achievability than the comps imply.
- What's the recent tenant-quality profile in this submarket — average credit score on applications, eviction rate, late-payment / NSF rate, and stable-employment percentage? A property-management company in the area should have these aggregated.
- How much new apartment / multifamily construction is in the pipeline within 1–3 miles? Heavy new supply (>2% of stock underway) typically softens rents 12–24 months out; light construction supports rent growth.
Investment metrics
- 1% rule
- 1.38% ✓
- Cap rate
- 11.13%
- Cash-on-cash
- 17.26%
- DSCR
- 1.77
- GRM
- 6.0
CMA / ARV
- ARV (on-the-fly)
- $454,688
- Comps found
- 1
Show comp detail 1 sale within ~0.75 mi
| Address | Dist | Beds/Ba | Sqft | Sold | Price | $/sf | Match |
|---|---|---|---|---|---|---|---|
| 413 N Main St | 0.64mi | 8/4.0 | 4,000 (-8%) | 23mo | $415,000 | $104 | 33 |
Match score weights: distance 35% · size 25% · config 20% · recency 20%. Top-matched comps best support the ARV.
Projected returns pro-forma
-3.0% appreciation · 3.0% rent growth · sell at horizon
- IRR
- 8.6%
- Equity multiple
- 1.34×
- Total profit
- $30,775
- Equity at exit
- $48,459
- IRR
- 17.8%
- Equity multiple
- 2.48×
- Total profit
- $134,427
- Equity at exit
- $28,100
Cash invested: $91,000 (down + closing). Projections, not guarantees.
Landlord ↔ Tenant lean methodology
- Overall (STATE)
- 83 Strongly Landlord-Friendly
- State South Dakota
- 83 Strongly Landlord-Friendly · R+16
- County
- — inherits STATE
- City
- — inherits STATE
ZIP-level market 57039
- Active inventory
- 56
- Price-to-rent
- 24.1×
Monthly cashflow live
- Estimated rent
- $4,500 medium interval (Pro) →
- Mortgage (P&I)
- −$1,704
- Tax est. 1.5%
- −$406 /mo · $4,875/yr
- Insurance
- −$135
- HOA
- −$0
- Vacancy / Maint / Mgmt
- −$945
- Net cashflow
- $1,309
Break-even live
Sensitivity live
| Price | -10% $1,534 | -5% $1,421 | +0% $1,309 | +5% $1,197 | +10% $1,084 |
|---|---|---|---|---|---|
| Rent | -10% $953 | -5% $1,131 | +0% $1,309 | +5% $1,487 | +10% $1,664 |
| Rate | -1.0pp $1,473 | -0.5pp $1,392 | base $1,309 | +0.5pp $1,225 | +1.0pp $1,139 |
4-unit breakdown (identical units grouped — click to expand)
| Units | Beds | Baths | Est. rent |
|---|---|---|---|
| 4× units | 2 | 1.2 | $4,500 |
| #1 | 2 | 1.2 | $1,125 |
| #2 | 2 | 1.2 | $1,125 |
| #3 | 2 | 1.2 | $1,125 |
| #4 | 2 | 1.2 | $1,125 |
| Total (4 units) | $4,500 | ||
UW: 25.0% down · 7.5% · 30yr · 1.5% tax · 5.0% vac · 8.0% maint · 8.0% mgmt
Financing live
Cash to close
- Down payment
- $81,250
- Closing costs
- $9,750
- Reserves months
- —
- Total cash needed
- —
Loan-product check · same deal, 3 products live
Conventional
25% down · 7.5% · 30yr
- Down + closing
- —
- Monthly P&I
- —
- Monthly cashflow
- —
- DSCR
- —
- Eligible?
- —
Personal DTI + credit; lowest rate.
DSCR
20% down · 8.5% · 30yr
- Down + closing
- —
- Monthly P&I
- —
- Monthly cashflow
- —
- DSCR
- —
- Eligible?
- —
No personal income docs; deal must DSCR.
Hard money
10% down · 12.0% · 12mo
- Down + closing
- —
- Monthly P&I
- —
- Monthly cashflow
- —
- DSCR
- —
- Eligible?
- —
Short-term bridge; refi at stabilization.
Listing history 7 events
-
2026-06-21days on market $325,000 Active 10 DOM
-
2026-06-18days on market $325,000 Active 7 DOM
-
2026-06-17days on market $325,000 Active 6 DOM
-
2026-06-16days on market $325,000 Active 5 DOM
-
2026-06-15days on market $325,000 Active 4 DOM
-
2026-06-14days on market $325,000 Active 2 DOM
-
2026-06-13$325,000 Active 1 DOM
ⓘ Source: listings_history table (triggers on properties + properties_extension) + one-shot
backfill from property_details.listing_events for pre-trigger history.
Climate risk First Street
- Heat 3/10 Moderate
- Air quality 2/10 Low 1 unhealthy d/yr today · 1 by 30 yrs out
Nearby sold comps map
Loading sold comps map…
Walkable amenities ~0.75 mi
Loading nearby amenities…
Taxation est. · year 1
- Rental income
- $54,000
- − Mortgage interest
- −$18,205
- − Property taxes
- −$4,875
- − Insurance
- −$1,625
- − Repairs & maintenance
- −$4,320
- − Management
- −$4,320
- − Depreciation
- −$9,455
- Taxable income
- $11,200
- Est. tax owed @ 24.0%
- −$2,688
- After-tax cash flow
- $13,020/yr
For passive investors: Depreciation is non-cash, so a rental often shows a tax loss while cash-flowing — sheltering income. Rental losses are passive: they offset passive income freely, and up to $25,000/yr can offset ordinary (W-2) income if you actively participate and your MAGI is under $100k (phasing out to $0 by $150k); unused losses carry forward. On sale, claimed depreciation is recaptured at up to 25%, and gains may owe capital-gains tax (a 1031 exchange can defer both). Figures are a year-1 estimate at your 24.0% rate — not tax advice; consult a CPA.
Condition & rehab AI · 12 photos
The property is in average condition with moderate repairs needed in the kitchen and bathrooms. Upgrading these areas would significantly increase its resale and rental value.
Repairs flagged
- Moderate kitchen cabinets — dated and in need of replacement
- Moderate bathroom fixtures — dated and in need of replacement
- Minor HVAC system — may need cleaning or minor repairs
Value-add opportunities
- Both update kitchen cabinets and appliances — modernizing the kitchen would appeal to buyers and renters
- Both replace bathroom fixtures and cabinets — modernizing the bathrooms would appeal to buyers and renters
- Both paint exterior — painting the exterior would improve curb appeal and increase property value
Renovation cost estimate screening
| Repair item | Severity | Est. cost |
|---|---|---|
| kitchen cabinets · dated and in need of replacement | Moderate | $3,000–15,000 |
| bathroom fixtures · dated and in need of replacement | Moderate | $3,000–15,000 |
| HVAC system · may need cleaning or minor repairs | Minor | $500–3,000 |
| Total estimated repair cost · 3 items | $6,500–33,000 |
Value-add ROI direction
- Both update kitchen cabinets and appliances — modernizing the kitchen would appeal to buyers and renters ↑
- Both replace bathroom fixtures and cabinets — modernizing the bathrooms would appeal to buyers and renters ↑
- Both paint exterior — painting the exterior would improve curb appeal and increase property value ↑
ⓘ Cost ranges are severity-bucket heuristics (US national rule-of-thumb). Get contractor quotes + a written scope before underwriting a rehab budget.
Schools (NCES district)
- District
- Lennox School District 41-4
- NCES district ID
- 4641550
- Math proficiency
- 56% ▲ 3.00%
- Reading proficiency
- 64% ▲ 2.00%
- Median HH income
- $63,780
- Composite
- 52.37/100
- National rank
- #1584
- State rank
- #5 of 59 in SD
Livability — Lennox
- Score
- 71/100
- State rank
- #50
- US rank
- #6618
Category grades
Schools grade is shown separately in the Schools card above.
Census & demographics
- Census place
- Lennox, SD
- Population (ZIP)
- 3,875
Population outlook (Lincoln County) Hauer SSP2
- Today (2025)
- 70,138 people
- By 2030
- 78,929 · +12.5%
- By 2040
- 97,132 · +38.5%
- By 2050
- 116,136 · +65.6%
- By 2075
- 166,314 · +137.1%
- By 2100
- 219,430 · +212.9%
Race, ethnicity, and origin ACS 2023
- Neighborhood character
- Predominantly White (90%)
- Race & ethnicity
- White 90% Two or more races 5% Hispanic / Latino 3% Black 1%
- Common ancestry
- Portuguese 21% Iranian 9% Romanian 3%
- Foreign-born
- 0% · Canada
- Languages at home
- 99% English-only · Spanish 1%
Political lean MEDSL · Lincoln
- 2024 margin
- Strong R (+26.5) · D 35.7% · R 62.2% · Other 2.2%
- 2008→2024 swing
- -11.3pp toward R · 2008: -15.2pp · 2024: -26.5pp
- All cycles
- 2024: R+26.5 2020: R+23.6 2016: R+29.4 2012: R+25.6 2008: R+15.2
Not yet ingested
- Civics
- —
Market trends
- HPI YoY
- ▼ -88.67%
- Current HPI
- 149.1732
- Rent YoY
- —
- Metro
- —
- State GDP YoY
- ▲ 0.70%
- F500 in state
- 2
Industry mix (Fortune 500 HQ in SD)
| Industry | F500 HQs | Revenue |
|---|---|---|
| Utilities | 1 | $1B |
|
||
Price history
1 event — show timeline
- 2026-06-01 Listed $325,000 REALTOR® Association of the Sioux Empire
Cash-flow waterfall
monthlySold comps — $/sqft
last 12 mo · ≤1 miLoading sold comps…