4-8 Blueberry Ln · Danbury, CT
Flood risk 1/10 · Minimal
- FEMA flood zone
- X (unshaded)
- Chance of flooding over 30 yrs
- 0.0%
- Est. flood insurance / yr
- $473 – $860
Fire risk 1/10 · Minimal
- Est. fire insurance / yr
- $829 – $1,539
Heat risk 5/10 · Moderate
- Hot days now (above 98°F)
- 7 days/yr
- Hot days in 30 yrs
- 15 days/yr
Wind risk 5/10 · Moderate
- Chance of severe wind over 30 yrs
- 26.0%
Air-quality risk 3/10 · Minor
- Unhealthy air days now
- 3 days/yr
- Unhealthy air days in 30 yrs
- 4 days/yr
Risk factors via First Street. Map © Google.
Why this score? — see what drove the D grade
The composite is a weighted blend of 9 inputs, each scored 0–100. Each bar is that input's sub-score; the figure is the points it added to the 100-point composite (weight × sub-score).
- Cash flow +15.0/30.0
- ARV discount +7.5/15.0
- 1% rule +5.0/10.0
- DSCR +5.0/10.0
- Livability +3.8/5.0
- Rent growth +3.3/5.0
- Condition / age +2.5/5.0
- Schools +2.4/10.0
- Appreciation +0.0/10.0
$50,000
🖨 Deal sheet 📄 Offer letter ✓ Due diligence
Listing remarks MLS
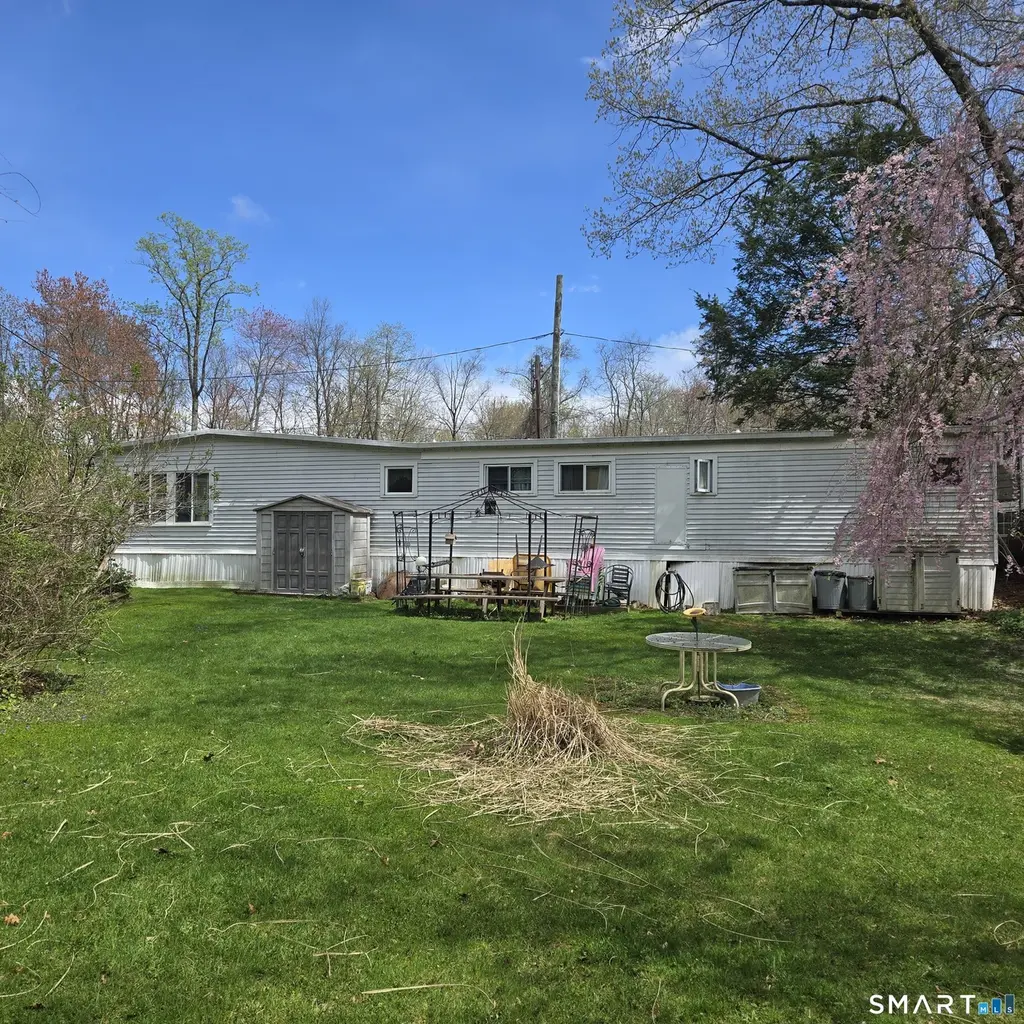
Enjoy an affordable homeownership opportunity in this 2-bedroom, 1-bath mobile home situated on leased land. The property offers a large backyard, perfect for entertaining, relaxing, or outdoor enjoyment. Ideally located on the west side of Danbury, this home provides convenient access to the highway without the disturbance of heavy road noise. Shopping, grocery stores, the Danbury Fair Mall, and the New York border are all just minutes away. ( There are two Blueberry lanes in Danbury, this property is located on the Blueberry lane off of Old Ridgebury Rd, Unit is 8).
Key facts
- Large backyard
- Convenient access
- Built 1973
Tags
Neighborhood map
What this means for you Summary
Snapshot
- This is a 2-bed/1.0-bath manufactured listed at $50k.
Deal economics
- At list price, monthly cash flow is $2k ($20k/yr) — positive.
- The deal already cash-flows at list — no discount required.
- Meets the 1% rule at list price ($2k rent vs $50k).
- Recommended offer: $49k (1.5% below list) — sets the bar for market timing.
- Cap rate 45.7% vs local median 3.6% in Danbury — top-decile yield for the area; either an underpriced asset or a hidden risk that comps aren't pricing in. Stress-test before assuming the spread holds.
Location & tenants
- Location reads 76/100 on livability (#51 in CT, #3,379 nationally) — a middle-class / working-renter tenant base. Strengths: commute A+, housing A+, health & safety A+; Watch: schools D+, amenities F, cost of living F.
- Danbury School District (urban): math 19% / reading 32% proficiency, ranked #131 of 153 in CT (top 86%) — low school quality limits family demand, transient renter base, plan for 1-2y turnover.
- Market conditions: Rents rising (+3.1%/yr); 197 active listings in the ZIP; 5 comparable units currently listed for rent nearby; rentals leasing fast (median 3d on market — plan ~1-2 weeks tenant-placement turnaround); solid renter incomes; 1,151 units permitted in Western Connecticut Planning Region in 2024 (714 in 5+ unit buildings).
- This rent runs 39% of the median local income ($77k/yr) — at the standard rent-burdened threshold; future hikes will face affordability resistance.
Forward outlook
- Local home prices are declining (-3.0%/yr); year-one equity from $346 of loan paydown is wiped out by about $2k of value loss. Plan a longer hold.
- At projected returns (-3.0% appreciation + 3.1% rent growth), your $14k cash investment doubles in ~1 year — after that, you're playing with house money.
Negotiation context
- It's been on market 26 days — a 2% lower offer ($49k) is reasonable based on typical stale-listing flexibility.
Risks & watch-outs
- Climate carrying-cost: moderate wind risk, 26% chance of damaging wind over 30y; extreme-heat days projected 7→15/yr by 2055 (HVAC capex compounding) — expect insurance premiums to compound above CPI over the hold.
Questions for the listing agent
- Built in 1973 — when were the roof, HVAC, electrical panel, plumbing, and water heater last replaced?
- Is there a deadline driving the sale (1031 exchange, divorce, estate, relocation)? That informs how much negotiation room exists.
- Schools are D-rated, which usually means shorter tenancies and higher turnover. Who's the typical renter profile here, and what's been the actual vacancy rate?
- The area grade is low — what's the realistic commute time and amenity access for the typical tenant pool here? Any planned neighborhood developments (good or bad) we should know about?
- What's the average days-on-market for RENTAL listings here right now (not sales)? A rising rental-DOM trend means longer vacancies and softer asking-rent achievability than the comps imply.
- What's the recent tenant-quality profile in this submarket — average credit score on applications, eviction rate, late-payment / NSF rate, and stable-employment percentage? A property-management company in the area should have these aggregated.
- How much new for-sale + rental construction is in the pipeline within 1–3 miles? Heavy new supply typically softens prices + rents 12–24 months out; constrained supply supports both.
Investment metrics
- 1% rule
- 4.99% ✓
- Cap rate
- 45.72%
- Cash-on-cash
- 140.80%
- DSCR
- 7.26
- GRM
- 1.7
CMA / ARV
- ARV (median comp)
- $166,240
- List price
- $50,000
- Delta
- -69.92%
- Verdict
- UNDERPRICED
- Comps
- 12 within 1.0 mi
Projected returns pro-forma
-3.0% appreciation · 3.08% rent growth · sell at horizon
- IRR
- —
- Equity multiple
- 7.91×
- Total profit
- $96,746
- Equity at exit
- $7,455
- IRR
- —
- Equity multiple
- 16.71×
- Total profit
- $219,896
- Equity at exit
- $4,323
Cash invested: $14,000 (down + closing). Projections, not guarantees.
Landlord ↔ Tenant lean methodology
- Overall (STATE)
- 27 Tenant-Leaning
- State Connecticut
- 27 Tenant-Leaning · D+7
- County
- — inherits STATE
- City
- — inherits STATE
ZIP-level market 06810
- Rents YoY
- 3.1%
- Active inventory
- 197
- Price-to-rent
- 1.7×
Monthly cashflow live
- Estimated rent
- $2,495 high interval (Pro) →
- Mortgage (P&I)
- −$262
- Tax from tax record
- −$46 /mo · $547/yr
- Insurance
- −$21
- HOA
- −$0
- Vacancy / Maint / Mgmt
- −$524
- Net cashflow
- $1,643
Break-even live
UW: 25.0% down · 7.5% · 30yr · 1.5% tax · 5.0% vac · 8.0% maint · 8.0% mgmt
Financing live
Cash to close
- Down payment
- $12,500
- Closing costs
- $1,500
- Reserves months
- —
- Total cash needed
- —
Loan-product check · same deal, 3 products live
Conventional
25% down · 7.5% · 30yr
- Down + closing
- —
- Monthly P&I
- —
- Monthly cashflow
- —
- DSCR
- —
- Eligible?
- —
Personal DTI + credit; lowest rate.
DSCR
20% down · 8.5% · 30yr
- Down + closing
- —
- Monthly P&I
- —
- Monthly cashflow
- —
- DSCR
- —
- Eligible?
- —
No personal income docs; deal must DSCR.
Hard money
10% down · 12.0% · 12mo
- Down + closing
- —
- Monthly P&I
- —
- Monthly cashflow
- —
- DSCR
- —
- Eligible?
- —
Short-term bridge; refi at stabilization.
Rent comps 5 comps
| Address | Beds | Baths | Sqft | Rent | $/sqft | DOM | Units | Dist |
|---|---|---|---|---|---|---|---|---|
| 101 Avalon Lake Rd Danbury, CT | 1.0–2.0 | 1.0–2.0 | 1298 | $3,481 | $2.68 | 3d | 5 | 0.49mi |
| 46 Kenosia Trl Unit 1 Danbury, CT | 1.0 | 1.0 | 600 | $1,450 | $2.42 | 3d | 1 | 0.67mi |
| 55 Mill Plain Rd Unit 29-7 Danbury, CT | 1.0 | 1.0 | 805 | $2,200 | $2.73 | 10d | 1 | 0.77mi |
| 16 Scuppo Rd Unit D4 Danbury, CT | 2.0 | 1.0 | 918 | $2,400 | $2.61 | 44d | 1 | 1.29mi |
| 15 Abbey Ln Danbury, CT | 1.0–3.0 | 1.0–2.0 | 1082 | $3,066 | $2.83 | 3d | 16 | 1.36mi |
Listing history 2 events
-
2026-05-11status Under Contract 574-char remark
Show marketing remark (574 chars)
Enjoy an affordable homeownership opportunity in this 2-bedroom, 1-bath mobile home situated on leased land. The property offers a large backyard, perfect for entertaining, relaxing, or outdoor enjoyment. Ideally located on the west side of Danbury, this home provides convenient access to the highway without the disturbance of heavy road noise. Shopping, grocery stores, the Danbury Fair Mall, and the New York border are all just minutes away. ( There are two Blueberry lanes in Danbury, this property is located on the Blueberry lane off of Old Ridgebury Rd, Unit is 8).
-
2026-04-14$50,000 Active 574-char remark
Show marketing remark (574 chars)
Enjoy an affordable homeownership opportunity in this 2-bedroom, 1-bath mobile home situated on leased land. The property offers a large backyard, perfect for entertaining, relaxing, or outdoor enjoyment. Ideally located on the west side of Danbury, this home provides convenient access to the highway without the disturbance of heavy road noise. Shopping, grocery stores, the Danbury Fair Mall, and the New York border are all just minutes away. ( There are two Blueberry lanes in Danbury, this property is located on the Blueberry lane off of Old Ridgebury Rd, Unit is 8).
ⓘ Source: listings_history table (triggers on properties + properties_extension) + one-shot
backfill from property_details.listing_events for pre-trigger history.
Tax reassessment forecast CT · Partial reset (capped growth)
- Current annual tax
- $547 · $46/mo
- Projected year-2 tax
- $808 · $67/mo
- Expected delta
- +$262/yr (+$22/mo · 47.8%)
ⓘ Screening estimate from a state-policy table — verify with the county assessor before closing.
Climate risk First Street
- Flood 1/10 Low FEMA zone X (unshaded) · 0% chance over 30 yrs
- Wildfire 1/10 Low
- Heat 5/10 Major 7 d/yr ≥98°F today · 15 d/yr by 30 yrs out
- Wind 5/10 Major 26% chance of damaging wind over 30 yrs
- Air quality 3/10 Moderate 3 unhealthy d/yr today · 4 by 30 yrs out
Nearby sold comps map
Loading sold comps map…
Walkable amenities ~0.75 mi
Loading nearby amenities…
Taxation est. · year 1
- Rental income
- $29,943
- − Mortgage interest
- −$2,801
- − Property taxes
- −$547
- − Insurance
- −$250
- − Repairs & maintenance
- −$2,395
- − Management
- −$2,395
- − Depreciation
- −$1,455
- Taxable income
- $20,100
- Est. tax owed @ 24.0%
- −$4,824
- After-tax cash flow
- $14,888/yr
For passive investors: Depreciation is non-cash, so a rental often shows a tax loss while cash-flowing — sheltering income. Rental losses are passive: they offset passive income freely, and up to $25,000/yr can offset ordinary (W-2) income if you actively participate and your MAGI is under $100k (phasing out to $0 by $150k); unused losses carry forward. On sale, claimed depreciation is recaptured at up to 25%, and gains may owe capital-gains tax (a 1031 exchange can defer both). Figures are a year-1 estimate at your 24.0% rate — not tax advice; consult a CPA.
Schools (NCES district)
- District
- Danbury School District
- NCES district ID
- 0901020
- Math proficiency
- 19% ▼ -17.00%
- Reading proficiency
- 32% ▼ -16.00%
- Median HH income
- $65,793
- Composite
- 23.93/100
- National rank
- #7784
- State rank
- #131 of 153 in CT
Livability — Danbury
- Score
- 76/100
- State rank
- #51
- US rank
- #3379
Category grades
Schools grade is shown separately in the Schools card above.
Census & demographics
- Census place
- Danbury, CT
- County
- Fairfield County · 765,532 people
- City population
- 87,061
- Metro
- Bridgeport-Stamford-Norwalk, CT
- Population (ZIP)
- 55,833
- Household income
- $76,933
- Rent vs Own
- Severe rent burden
- 3255.0
Population outlook (Western Connecticut County) Hauer SSP2
- By 2040
- 685,031
Race, ethnicity, and origin ACS 2023
- Neighborhood character
- Highly diverse neighborhood (Simpson 0.72)
- Race & ethnicity
- Hispanic / Latino 37% White 35% Two or more races 19% Black 12% Asian 5%
- Hispanic origin (detail)
- Mexican 4% Puerto Rican 3% Dominican 6%
- Common ancestry
- Estonian 8% Russian 4% Romanian 3%
- Foreign-born
- 41% · Canada, Jamaica, Dominican Republic
- Languages at home
- 48% English-only · Spanish 32% Other Indo-European 16% Other Asian/Pacific 1%
Political lean MEDSL · Western Connecticut
- 2024 margin
- D (+19.1) · D 58.8% · R 39.7% · Other 1.6%
- All cycles
- 2024: D+19.1
Not yet ingested
- Civics
- —
Market trends
- HPI YoY
- ▼ -309.71%
- Current HPI
- 286.5484
- Rent YoY
- ▲ 3.08%
- Metro
- Bridgeport-Stamford-Norwalk, CT
- State GDP YoY
- ▲ 1.06%
- F500 in state
- 38
Industry mix (Fortune 500 HQ in CT)
| Industry | F500 HQs | Revenue |
|---|---|---|
| Industrial Machinery | 4 | $38B |
|
||
| Insurance | 3 | $71B |
|
||
| Financial Services | 2 | $25B |
|
||
| Transportation / Logistics | 2 | $18B |
|
||
| Healthcare | 1 | $247B |
|
||
| Telecommunications | 1 | $55B |
|
||
Price history
2 events — show timeline
- 2026-05-11 Pending — Smart MLS
- 2026-04-14 Listed $50,000 Smart MLS
Property tax history
+6.1%/yrLatest (2023): $547 · +138.9% YoY. Source: county tax records.
Cash-flow waterfall
monthlySold comps — $/sqft
last 12 mo · ≤1 miLoading sold comps…