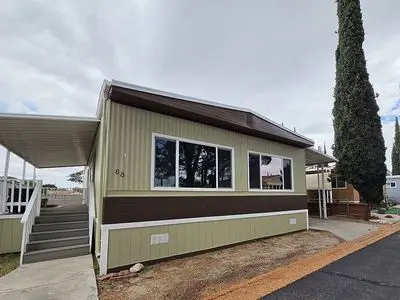
4444 E Avenue R · Palmdale, CA
Flood risk 1/10 · Minimal
- FEMA flood zone
- X (shaded)
- Chance of flooding over 30 yrs
- 0.0%
- Est. flood insurance / yr
- $507 – $1,088
Fire risk 7/10 · Major
- Est. fire insurance / yr
- $659 – $1,223
Heat risk 6/10 · Moderate
- Hot days now (above 100°F)
- 1 days/yr
- Hot days in 30 yrs
- 2 days/yr
Wind risk 1/10 · Minimal
- Chance of severe wind over 30 yrs
- —
Air-quality risk 10/10 · Severe
- Unhealthy air days now
- 25 days/yr
- Unhealthy air days in 30 yrs
- 29 days/yr
Risk factors via First Street. Map © Google.
Why this score? — see what drove the B- grade
The composite is a weighted blend of 9 inputs, each scored 0–100. Each bar is that input's sub-score; the figure is the points it added to the 100-point composite (weight × sub-score).
- Cash flow +30.0/30.0
- DSCR +10.0/10.0
- 1% rule +9.1/10.0
- ARV discount +7.5/15.0
- Livability +2.8/5.0
- Rent growth +2.5/5.0
- Schools +2.5/10.0
- Condition / age +2.5/5.0
- Appreciation +0.0/10.0
$185,000
🖨 Deal sheet (PDF) 📄 Offer letter ✓ Due diligence
Listing remarks MLS
This one bedroom one bathroom manufactured home sitting on a large lot is great if your just starting out or if you are looking to downsize. The property manager keeps the park looking clean year around. The pool and rec room is a place place to relax. What better way to relax without have to drive for hours.
Key facts
- Roof
- Completely remodeled
- Appliances
Tags
Neighborhood map
What this means for you Summary
Snapshot
- This is a 2-bed/2.0-bath land listed at $185k.
Deal economics
- At list price, monthly cash flow is $789 ($9k/yr) — positive.
- The deal already cash-flows at list — no discount required.
- Meets the 1% rule at list price ($3k rent vs $185k).
- Recommended offer: $179k (3.0% below list) — sets the bar for market timing.
- Cap rate 11.4% vs local median 4.5% in Palmdale — top-decile yield for the area; either an underpriced asset or a hidden risk that comps aren't pricing in. Stress-test before assuming the spread holds.
Location & tenants
- Location reads 55/100 on livability (#861 in CA) — a working-class tenant base; expect higher turnover. Strengths: housing A+; Watch: schools F, crime F, amenities F.
- Palmdale Elementary (suburban): math 20% / reading 31% proficiency, ranked #1,147 of 1,400 in CA (top 82%) — low school quality limits family demand, transient renter base, plan for 1-2y turnover; 69% free/reduced lunch — lower-income household profile, screen leases tightly.
- Market conditions: 128 active listings in the ZIP; solid renter incomes; 19,697 units permitted in Los Angeles County in 2024 (9,426 in 5+ unit buildings).
- This rent runs 37% of the median local income ($86k/yr) — at the standard rent-burdened threshold; future hikes will face affordability resistance.
Forward outlook
- Local home prices are declining (-3.0%/yr); year-one equity from $1k of loan paydown is wiped out by about $6k of value loss. Plan a longer hold.
- Los Angeles County population projected at +9% by 2050 — modest demand growth; plan on rents tracking national, not racing it.
- At projected returns (-3.0% appreciation + 3.0% rent growth), your $52k cash investment doubles in ~7 years — after that, you're playing with house money.
Negotiation context
- It's been on market 37 days — a 3% lower offer ($179k) is reasonable based on typical stale-listing flexibility.
- 33 sale attempts since 26y ago with the ask held roughly flat each time — persistent listings suggest the price (not the market) is what's stuck; bring a comps-based counter.
- Current owner paid $30k; list at $185k implies a 517% gain — meaningful room to come down on a strong offer.
Risks & watch-outs
- Climate carrying-cost: major wildfire risk; extreme-heat days projected 1→2/yr by 2055 (HVAC capex compounding) — expect insurance premiums to compound above CPI over the hold.
Questions for the listing agent
- It's been on market 37 days. Have you received any prior offers? Is the seller open to a 3% concession, seller financing, or rate buy-down credit?
- Built in 1971 — when were the roof, HVAC, electrical panel, plumbing, and water heater last replaced?
- Is there a deadline driving the sale (1031 exchange, divorce, estate, relocation)? That informs how much negotiation room exists.
- Schools are F-rated, which usually means shorter tenancies and higher turnover. Who's the typical renter profile here, and what's been the actual vacancy rate?
- Crime grade is F in this area — have there been break-ins, vandalism, or insurance claims at this property in the last 3 years? What carrier currently insures it and at what premium?
- What's the average days-on-market for RENTAL listings here right now (not sales)? A rising rental-DOM trend means longer vacancies and softer asking-rent achievability than the comps imply.
- What's the recent tenant-quality profile in this submarket — average credit score on applications, eviction rate, late-payment / NSF rate, and stable-employment percentage? A property-management company in the area should have these aggregated.
- How much new for-sale + rental construction is in the pipeline within 1–3 miles? Heavy new supply typically softens prices + rents 12–24 months out; constrained supply supports both.
Investment metrics
- 1% rule
- 1.41% ✓
- Cap rate
- 11.41%
- Cash-on-cash
- 18.27%
- DSCR
- 1.81
- GRM
- 5.9
CMA / ARV
No comps found within radius.
Projected returns pro-forma
-3.0% appreciation · 3.0% rent growth · sell at horizon
- IRR
- 9.9%
- Equity multiple
- 1.39×
- Total profit
- $20,283
- Equity at exit
- $27,584
- IRR
- 19.1%
- Equity multiple
- 2.59×
- Total profit
- $82,491
- Equity at exit
- $15,995
Cash invested: $51,800 (down + closing). Projections, not guarantees.
Landlord ↔ Tenant lean methodology
- Overall (STATE)
- 18 Strongly Tenant-Friendly
- State California
- 18 Strongly Tenant-Friendly · D+13
- County
- — inherits STATE
- City
- — inherits STATE
ZIP-level market 93552
- Home prices YoY
- -6.4%
- Active inventory
- 128
- Price-to-rent
- 5.9×
Monthly cashflow live
- Estimated rent
- $2,616 medium interval (Pro) →
- Mortgage (P&I)
- −$970
- Tax est. 1.5%
- −$231 /mo · $2,775/yr
- Insurance
- −$77
- HOA
- −$0
- Vacancy / Maint / Mgmt
- −$549
- Net cashflow
- $789
Break-even live
Sensitivity live
| Price | -10% $916 | -5% $852 | +0% $789 | +5% $725 | +10% $661 |
|---|---|---|---|---|---|
| Rent | -10% $582 | -5% $685 | +0% $789 | +5% $892 | +10% $995 |
| Rate | -1.0pp $882 | -0.5pp $836 | base $789 | +0.5pp $741 | +1.0pp $692 |
UW: 25.0% down · 7.5% · 30yr · 1.5% tax · 5.0% vac · 8.0% maint · 8.0% mgmt
Financing live
Cash to close
- Down payment
- $46,250
- Closing costs
- $5,550
- Reserves months
- —
- Total cash needed
- —
Loan-product check · same deal, 3 products live
Conventional
25% down · 7.5% · 30yr
- Down + closing
- —
- Monthly P&I
- —
- Monthly cashflow
- —
- DSCR
- —
- Eligible?
- —
Personal DTI + credit; lowest rate.
DSCR
20% down · 8.5% · 30yr
- Down + closing
- —
- Monthly P&I
- —
- Monthly cashflow
- —
- DSCR
- —
- Eligible?
- —
No personal income docs; deal must DSCR.
Hard money
10% down · 12.0% · 12mo
- Down + closing
- —
- Monthly P&I
- —
- Monthly cashflow
- —
- DSCR
- —
- Eligible?
- —
Short-term bridge; refi at stabilization.
Listing history 50 events
-
2026-06-18days on market $185,000 Active 37 DOM
-
2026-06-17days on market $185,000 Active 36 DOM
-
2026-06-16days on market $185,000 Active 35 DOM
-
2026-06-15days on market $185,000 Active 34 DOM
-
2026-06-13days on market $185,000 Active 32 DOM
-
2026-06-13days on market $185,000 Active 31 DOM
-
2026-06-09days on market $185,000 Active 28 DOM
-
2026-06-08days on market $185,000 Active 27 DOM
-
2026-06-07days on market $185,000 Active 26 DOM
-
2026-06-04days on market $185,000 Active 23 DOM
-
2026-06-03days on market $185,000 Active 22 DOM
-
2026-06-02days on market $185,000 Active 21 DOM
-
2026-06-01days on market $185,000 Active 20 DOM
-
2026-05-31days on market $185,000 Active 19 DOM
-
2026-05-12$185,000 Active
-
2020-10-09soldstatus $30,000 Closed Sale 310-char remark
Show marketing remark (310 chars)
This one bedroom one bathroom manufactured home sitting on a large lot is great if your just starting out or if you are looking to downsize. The property manager keeps the park looking clean year around. The pool and rec room is a place place to relax. What better way to relax without have to drive for hours.
-
2020-10-01status Pending Sale 310-char remark
Show marketing remark (310 chars)
This one bedroom one bathroom manufactured home sitting on a large lot is great if your just starting out or if you are looking to downsize. The property manager keeps the park looking clean year around. The pool and rec room is a place place to relax. What better way to relax without have to drive for hours.
-
2020-09-25soldstatus $30,000 Closed Sale 310-char remark
Show marketing remark (310 chars)
This one bedroom one bathroom manufactured home sitting on a large lot is great if your just starting out or if you are looking to downsize. The property manager keeps the park looking clean year around. The pool and rec room is a place place to relax. What better way to relax without have to drive for hours.
-
2020-09-03status Pending Sale 310-char remark
Show marketing remark (310 chars)
This one bedroom one bathroom manufactured home sitting on a large lot is great if your just starting out or if you are looking to downsize. The property manager keeps the park looking clean year around. The pool and rec room is a place place to relax. What better way to relax without have to drive for hours.
-
2020-07-29$25,000 Active 310-char remark
Show marketing remark (310 chars)
This one bedroom one bathroom manufactured home sitting on a large lot is great if your just starting out or if you are looking to downsize. The property manager keeps the park looking clean year around. The pool and rec room is a place place to relax. What better way to relax without have to drive for hours.
-
2015-03-30historical
-
2015-03-28historical
-
2015-03-28historical
-
2015-03-28historical
-
2015-03-28historical
-
2015-03-28historical
-
2015-03-28historical
-
2015-03-28historical
-
2015-03-27historical
-
2015-03-27historical
-
2015-03-27historical
-
2015-03-27historical
-
2015-03-27historical
-
2015-03-27historical
-
2015-03-27historical
-
2015-03-27historical
-
2015-03-27historical
-
2015-03-27historical
-
2015-03-27historical
-
2015-03-27historical
-
2015-03-27historical
-
2015-03-17historical
-
2015-03-17historical
-
2014-06-30soldstatus $25,000
-
2014-03-28$25,000
-
2013-06-13$16,500
-
2013-05-30historical
-
2013-04-12$35,000
-
2013-03-06historical
-
2013-02-21$16,500
ⓘ Source: listings_history table (triggers on properties + properties_extension) + one-shot
backfill from property_details.listing_events for pre-trigger history.
Climate risk First Street
- Flood 1/10 Low FEMA zone X (shaded) · 0% chance over 30 yrs
- Wildfire 7/10 Severe
- Heat 6/10 Major 1 d/yr ≥100°F today · 2 d/yr by 30 yrs out
- Wind 1/10 Low
- Air quality 10/10 Extreme 25 unhealthy d/yr today · 29 by 30 yrs out
Nearby sold comps map
Loading sold comps map…
Walkable amenities ~0.75 mi
Loading nearby amenities…
Taxation est. · year 1
- Rental income
- $31,398
- − Mortgage interest
- −$10,363
- − Property taxes
- −$2,775
- − Insurance
- −$925
- − Repairs & maintenance
- −$2,512
- − Management
- −$2,512
- − Depreciation
- −$5,382
- Taxable income
- $6,929
- Est. tax owed @ 24.0%
- −$1,663
- After-tax cash flow
- $7,799/yr
For passive investors: Depreciation is non-cash, so a rental often shows a tax loss while cash-flowing — sheltering income. Rental losses are passive: they offset passive income freely, and up to $25,000/yr can offset ordinary (W-2) income if you actively participate and your MAGI is under $100k (phasing out to $0 by $150k); unused losses carry forward. On sale, claimed depreciation is recaptured at up to 25%, and gains may owe capital-gains tax (a 1031 exchange can defer both). Figures are a year-1 estimate at your 24.0% rate — not tax advice; consult a CPA.
Schools (NCES district)
- District
- Palmdale Elementary
- NCES district ID
- 0629580
- Math proficiency
- 20% ▲ 1.00%
- Reading proficiency
- 31% ▲ 1.00%
- Median HH income
- $48,652
- Composite
- 25.34/100
- National rank
- #12888
- State rank
- #1147 of 1400 in CA
Livability — Palmdale
- Score
- 55/100
- State rank
- #861
- US rank
- #23501
Category grades
Schools grade is shown separately in the Schools card above.
Census & demographics
- Census place
- Palmdale, CA
- County
- Los Angeles County · 9,444,647 people
- City population
- 177,644
- Metro
- Los Angeles-Long Beach-Anaheim, CA
- Population (ZIP)
- 42,639
- Household income
- $85,954
- Rent vs Own
- Severe rent burden
- 747.0
Population outlook (Los Angeles County) Hauer SSP2
- Today (2025)
- 10,940,515 people
- By 2030
- 11,256,481 · +2.9%
- By 2040
- 11,729,929 · +7.2%
- By 2050
- 11,948,407 · +9.2%
- By 2075
- 11,818,114 · +8.0%
- By 2100
- 10,842,928 · -0.9%
Race, ethnicity, and origin ACS 2023
- Neighborhood character
- Predominantly Hispanic (72%)
- Race & ethnicity
- Hispanic / Latino 72% Two or more races 21% Black 13% White 11% Asian 2% Native American 1%
- Hispanic origin (detail)
- Mexican 55%
- Common ancestry
- Italian 1%
- Foreign-born
- 27% · Canada, Dominican Republic
- Languages at home
- 42% English-only · Spanish 55% Tagalog/Filipino 1%
Political lean MEDSL · Los Angeles
- 2024 margin
- Solid D (+32.9) · D 64.8% · R 31.9% · Other 3.3%
- 2008→2024 swing
- -7.4pp toward R · 2008: 40.4pp · 2024: 32.9pp
- All cycles
- 2024: D+32.9 2020: D+44.2 2016: D+48.0 2012: D+40.0 2008: D+40.4
Not yet ingested
- Civics
- —
Market trends
- HPI YoY
- ▼ -27.00%
- Current HPI
- 394.1607
- Rent YoY
- —
- Metro
- Los Angeles-Long Beach-Anaheim, CA
- State GDP YoY
- ▲ 3.21%
- F500 in state
- 116
Industry mix (Fortune 500 HQ in CA)
| Industry | F500 HQs | Revenue |
|---|---|---|
| Technology | 27 | $1,492B |
|
||
| Financial Services | 3 | $174B |
|
||
| Retail | 3 | $44B |
|
||
| Insurance | 3 | $26B |
|
||
| Media / Entertainment | 2 | $115B |
|
||
| Pharmaceuticals / Biotech | 2 | $62B |
|
||
Price history
+825.0% since first listed68 events — show timeline
- 2026-05-12 Listed $185,000 FSBO.com
- 2020-10-09 Sold (MLS) $30,000 CRMLS
- 2020-10-01 Pending — CRMLS
- 2020-09-25 Sold (MLS) $30,000 CRMLS
- 2020-09-03 Pending — CRMLS
- 2020-07-29 Listed $25,000 CRMLS
- 2015-03-30 Listing Removed — AVMLS
- 2015-03-28 Listing Removed — AVMLS
- 2015-03-28 Listing Removed — AVMLS
- 2015-03-28 Listing Removed — AVMLS
- 2015-03-28 Listing Removed — AVMLS
- 2015-03-28 Listing Removed — AVMLS
- 2015-03-28 Listing Removed — AVMLS
- 2015-03-28 Listing Removed — AVMLS
- 2015-03-27 Listing Removed — AVMLS
- 2015-03-27 Listing Removed — AVMLS
- 2015-03-27 Listing Removed — AVMLS
- 2015-03-27 Listing Removed — AVMLS
- 2015-03-27 Listing Removed — AVMLS
- 2015-03-27 Listing Removed — AVMLS
- 2015-03-27 Listing Removed — AVMLS
- 2015-03-27 Listing Removed — AVMLS
- 2015-03-27 Listing Removed — AVMLS
- 2015-03-27 Listing Removed — AVMLS
- 2015-03-27 Listing Removed — AVMLS
- 2015-03-27 Listing Removed — AVMLS
- 2015-03-27 Listing Removed — AVMLS
- 2015-03-17 Listing Removed — AVMLS
- 2015-03-17 Listing Removed — AVMLS
- 2014-06-30 Sold (MLS) $25,000 AVMLS
- 2014-03-28 Listed $25,000 AVMLS
- 2013-06-13 Listed $16,500 AVMLS
- 2013-05-30 Listing Removed — AVMLS
- 2013-04-12 Listed $35,000 AVMLS
- 2013-03-06 Listing Removed — AVMLS
- 2013-02-21 Listed $16,500 AVMLS
- 2012-11-02 Listed $37,000 AVMLS
- 2012-01-03 Sold (MLS) $40,000 AVMLS
- 2011-09-22 Listed $60,000 AVMLS
- 2010-11-08 Listed $23,000 AVMLS
- 2010-05-12 Listed $29,500 AVMLS
- 2009-11-13 Listed $29,500 AVMLS
- 2009-07-18 Listing Removed — AVMLS
- 2009-07-17 Listed $69,000 AVMLS
- 2009-06-06 Listed $35,000 AVMLS
- 2009-05-29 Listed $18,000 AVMLS
- 2009-03-26 Listed $50,500 AVMLS
- 2009-02-12 Listed $70,000 AVMLS
- 2009-01-21 Listed $25,000 AVMLS
- 2008-11-16 Listed $35,000 AVMLS
- 2008-10-24 Listed $50,000 AVMLS
- 2008-10-22 Listed $20,900 AVMLS
- 2008-09-17 Listed $79,900 AVMLS
- 2008-08-19 Listed $29,900 AVMLS
- 2008-03-25 Listed $29,000 AVMLS
- 2008-03-14 Listed $50,000 AVMLS
- 2007-11-03 Listed $65,000 AVMLS
- 2007-05-08 Listing Removed — AVMLS
- 2007-04-25 Listed $55,000 AVMLS
- 2007-04-03 Listed $47,000 AVMLS
- 2006-04-07 Listed $49,900 AVMLS
- 2005-07-18 Listed $30,000 AVMLS
- 2004-12-07 Listing Removed — AVMLS
- 2004-05-13 Listed $35,000 AVMLS
- 2004-05-12 Listing Removed — AVMLS
- 2003-12-15 Listed $39,500 AVMLS
- 2003-09-23 Listed $35,000 AVMLS
- 2000-07-05 Listed $20,000 AVMLS
Property tax history
+1.7%/yrLatest (2025): $97,743 · +5.5% YoY. Source: county tax records.
Cash-flow waterfall
monthlySold comps — $/sqft
last 12 mo · ≤1 miLoading sold comps…