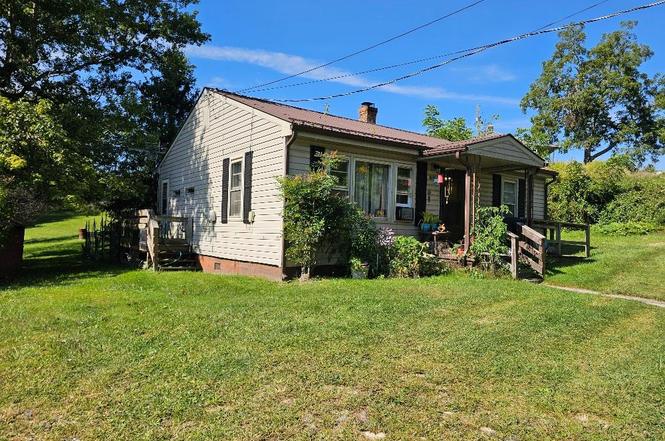
1553 Hilltown Rd · Hilltown, VA
Flood risk 1/10 · Minimal
- FEMA flood zone
- X (unshaded)
- Chance of flooding over 30 yrs
- 0.0%
- Est. flood insurance / yr
- $507 – $1,088
Fire risk 5/10 · Moderate
- Est. fire insurance / yr
- $666 – $1,236
Heat risk 2/10 · Minimal
- Hot days now (above 93°F)
- 7 days/yr
- Hot days in 30 yrs
- 19 days/yr
Wind risk 2/10 · Minimal
- Chance of severe wind over 30 yrs
- 1.0%
Air-quality risk 1/10 · Minimal
- Unhealthy air days now
- 0 days/yr
- Unhealthy air days in 30 yrs
- 0 days/yr
Risk factors via First Street. Map © Google.
Why this score? — see what drove the C+ grade
The composite is a weighted blend of 9 inputs, each scored 0–100. Each bar is that input's sub-score; the figure is the points it added to the 100-point composite (weight × sub-score).
- Cash flow +17.3/30.0
- ARV discount +15.0/15.0
- Appreciation +9.1/10.0
- DSCR +5.4/10.0
- Schools +5.4/10.0
- 1% rule +3.5/10.0
- Rent growth +2.5/5.0
- Livability +2.5/5.0
- Condition / age +2.5/5.0
$99,900
🖨 Deal sheet 📄 Offer letter ✓ Due diligence
Listing remarks
Charming 2-bedroom, 1-bath home in Fries with convenience. Featuring durable vinyl siding, hardwood flooring, and a low-maintenance metal roof. Located just minutes from the scenic New River, the New River Trail, and the expansive Jefferson National Forest, outdoor enthusiasts will love the endless opportunities for hiking, biking, kayaking, and more. Whether you're looking for a full-time residence, weekend retreat, or investment property, this cozy home puts you right in the heart of Virginia's natural beauty. Call today!
Key facts
- Hardwood flooring
- Metal roof
- New river
Tags
Property features AI
Exterior
- Utilities: Private well water; Septic tank
- Home design: Single-family residence; One story
- Construction: Vinyl siding
- Exterior features: Deck; Metal roof
Interior
- Kitchen: Refrigerator
- Flooring: Vinyl flooring; Wood flooring
- Bathrooms: 1 full bathroom
- Heating & cooling: Baseboard heating
- Interior features: Partial basement
- Laundry & utility: Washer; Dryer
Neighborhood map
What this means for you Summary
Snapshot
- This is a 2-bed/1.0-bath single-family listed at $100k.
Deal economics
- At list price, monthly cash flow is $73 ($880/yr) — positive.
- The deal already cash-flows at list — no discount required.
- To meet the 1% rule (rent ≥ 1% of price), the offer needs to be $85k (14.9% below list).
- Recommended offer: $85k (14.9% below list) — sets the bar for 1% rule.
Location & tenants
- Location reads: area grade C — affects rentability + tenant quality, not the cash-flow math above.
- Carroll County Public School District (rural): math 60% / reading 70% proficiency, ranked #46 of 131 in VA (top 35%) — acceptable for families but not a draw, mixed tenant base, ~2y average lease.
- Zoned schools: Carroll County Middle (math 54% / reading 72%, grade B+, #134 of 342 statewide, top 40%, 756 students, 84% FRL); Carroll County High (math 64% / reading 67%, grade B, #204 of 319 statewide, top 65%, 1,069 students, 81% FRL) — zoned schools average 83% FRL vs 48% district-wide (34 pts higher); higher-poverty schools than district average — tighter screening recommended.
- Market conditions: 32 active listings in the ZIP; 80 units permitted in Carroll County in 2024 (0 in 5+ unit buildings).
Forward outlook
- In year one you build about $9k of equity ($691 loan paydown + $8k appreciation (8.2% local appreciation)).
- Carroll County population projected at -18% by 2050 — secular population decline; favor cash flow + early exit over multi-decade hold.
- At projected returns (8.2% appreciation + 3.0% rent growth), your $28k cash investment doubles in ~3 years — after that, you're playing with house money.
- By year 4, paydown + projected appreciation supports a ~$31k cash-out refi (75% LTV) — recoverable capital for the next deal without selling this one.
Negotiation context
- It's been on market 281 days — a 12% lower offer ($88k) is reasonable based on typical stale-listing flexibility.
Risks & watch-outs
- Watch-outs: built in 1957 — expect roof / HVAC / electrical / plumbing capex.
- Climate carrying-cost: moderate wildfire risk — expect insurance premiums to compound above CPI over the hold.
Questions for the listing agent
- It's been on market 281 days. Have you received any prior offers? Is the seller open to a 15% concession, seller financing, or rate buy-down credit?
- Built in 1957 — when were the roof, HVAC, electrical panel, plumbing, and water heater last replaced?
- Why hasn't it sold? Are there any deal-killer items the seller is aware of (foundation, flood, title, zoning, code violations)?
- Is there a deadline driving the sale (1031 exchange, divorce, estate, relocation)? That informs how much negotiation room exists.
- What's the average days-on-market for RENTAL listings here right now (not sales)? A rising rental-DOM trend means longer vacancies and softer asking-rent achievability than the comps imply.
- What's the recent tenant-quality profile in this submarket — average credit score on applications, eviction rate, late-payment / NSF rate, and stable-employment percentage? A property-management company in the area should have these aggregated.
- How much new for-sale + rental construction is in the pipeline within 1–3 miles? Heavy new supply typically softens prices + rents 12–24 months out; constrained supply supports both.
Investment metrics
- 1% rule
- 0.85% ✗
- Cap rate
- 7.17%
- Cash-on-cash
- 3.15%
- DSCR
- 1.14
- GRM
- 9.8
CMA / ARV
- ARV (on-the-fly)
- $142,464
- Comps found
- 4
Show comp detail 4 sales within ~0.75 mi
| Address | Dist | Beds/Ba | Sqft | Sold | Price | $/sf | Match |
|---|---|---|---|---|---|---|---|
| 647 Eagle Bottom Rd | 0.45mi | 2/1.0 | 768 (-14%) | 5mo | $122,500 | $160 | 51 |
| 788 Eagle Bottom Rd | 0.56mi | 3/1.0 (+1) | 912 (+2%) | 18mo | $119,900 | $131 | 51 |
| 1839 Ivanhoe Rd | 0.60mi | 3/1.0 (+1) | 960 (+7%) | 16mo | $114,000 | $119 | 42 |
| 884 Eagle Bottom Rd | 0.63mi | 2/1.0 | 784 (-12%) | 11mo | $124,900 | $159 | 41 |
Match score weights: distance 35% · size 25% · config 20% · recency 20%. Top-matched comps best support the ARV.
Projected returns pro-forma
8.16% appreciation · 3.0% rent growth · sell at horizon
- IRR
- 22.7%
- Equity multiple
- 2.67×
- Total profit
- $46,776
- Equity at exit
- $76,956
- IRR
- 20.7%
- Equity multiple
- 5.73×
- Total profit
- $132,201
- Equity at exit
- $153,777
Cash invested: $27,972 (down + closing). Projections, not guarantees.
Landlord ↔ Tenant lean methodology
- Overall (STATE)
- 55 Moderately Landlord-Leaning
- State Virginia
- 55 Moderately Landlord-Leaning · D+2
- County
- — inherits STATE
- City
- — inherits STATE
ZIP-level market 24330
- Home prices YoY
- 4.0%
- Active inventory
- 32
- Price-to-rent
- 9.8×
Monthly cashflow live
- Estimated rent
- $850 medium interval (Pro) →
- Mortgage (P&I)
- −$524
- Tax from tax record
- −$32 /mo · $389/yr
- Insurance
- −$42
- HOA
- −$0
- Vacancy / Maint / Mgmt
- −$178
- Net cashflow
- $73
Break-even live
UW: 25.0% down · 7.5% · 30yr · 1.5% tax · 5.0% vac · 8.0% maint · 8.0% mgmt
Financing live
Cash to close
- Down payment
- $24,975
- Closing costs
- $2,997
- Reserves months
- —
- Total cash needed
- —
Loan-product check · same deal, 3 products live
Conventional
25% down · 7.5% · 30yr
- Down + closing
- —
- Monthly P&I
- —
- Monthly cashflow
- —
- DSCR
- —
- Eligible?
- —
Personal DTI + credit; lowest rate.
DSCR
20% down · 8.5% · 30yr
- Down + closing
- —
- Monthly P&I
- —
- Monthly cashflow
- —
- DSCR
- —
- Eligible?
- —
No personal income docs; deal must DSCR.
Hard money
10% down · 12.0% · 12mo
- Down + closing
- —
- Monthly P&I
- —
- Monthly cashflow
- —
- DSCR
- —
- Eligible?
- —
Short-term bridge; refi at stabilization.
Listing history 17 events
-
2026-06-19days on market $99,900 Active 281 DOM
-
2026-06-18days on market $99,900 Active 280 DOM
-
2026-06-17days on market $99,900 Active 279 DOM
-
2026-06-16days on market $99,900 Active 278 DOM
-
2026-06-15days on market $99,900 Active 277 DOM
-
2026-06-14days on market $99,900 Active 275 DOM
-
2026-06-12days on market $99,900 Active 274 DOM
-
2026-06-09days on market $99,900 Active 271 DOM
-
2026-06-08days on market $99,900 Active 270 DOM
-
2026-06-07days on market $99,900 Active 269 DOM
-
2026-06-05days on market $99,900 Active 266 DOM
-
2026-06-02days on market $99,900 Active 264 DOM
-
2026-06-01days on market $99,900 Active 263 DOM
-
2026-05-31days on market $99,900 Active 262 DOM
-
2026-05-30days on market $99,900 Active 261 DOM
-
2026-01-11price $99,900
-
2025-09-10$124,900 Active
ⓘ Source: listings_history table (triggers on properties + properties_extension) + one-shot
backfill from property_details.listing_events for pre-trigger history.
Tax reassessment forecast VA · Resets to sale price
- Current annual tax
- $389 · $32/mo
- Projected year-2 tax
- $819 · $68/mo
- Expected delta
- +$431/yr (+$36/mo · 110.8%)
ⓘ Screening estimate from a state-policy table — verify with the county assessor before closing.
Climate risk First Street
- Flood 1/10 Low FEMA zone X (unshaded) · 0% chance over 30 yrs
- Wildfire 5/10 Major
- Heat 2/10 Low 7 d/yr ≥93°F today · 19 d/yr by 30 yrs out
- Wind 2/10 Low 100% chance of damaging wind over 30 yrs
- Air quality 1/10 Low 0 unhealthy d/yr today · 0 by 30 yrs out
Nearby sold comps map
Loading sold comps map…
Walkable amenities ~0.75 mi
Loading nearby amenities…
Taxation est. · year 1
- Rental income
- $10,196
- − Mortgage interest
- −$5,596
- − Property taxes
- −$389
- − Insurance
- −$500
- − Repairs & maintenance
- −$816
- − Management
- −$816
- − Depreciation
- −$2,906
- Taxable loss
- −$826
- Est. tax savings @ 24.0%
- +$198
- After-tax cash flow
- $1,078/yr
For passive investors: Depreciation is non-cash, so a rental often shows a tax loss while cash-flowing — sheltering income. Rental losses are passive: they offset passive income freely, and up to $25,000/yr can offset ordinary (W-2) income if you actively participate and your MAGI is under $100k (phasing out to $0 by $150k); unused losses carry forward. On sale, claimed depreciation is recaptured at up to 25%, and gains may owe capital-gains tax (a 1031 exchange can defer both). Figures are a year-1 estimate at your 24.0% rate — not tax advice; consult a CPA.
Schools (NCES district)
- District
- Carroll County Public School District
- NCES district ID
- 5100690
- Math proficiency
- 60% ▼ -25.00%
- Reading proficiency
- 70% ▼ -10.00%
- Median HH income
- $36,359
- Composite
- 53.88/100
- National rank
- #1406
- State rank
- #46 of 131 in VA
Livability — Hilltown
No livability data for this city. (Only ~50 U.S. cities are tracked.)
Census & demographics
- Census place
- Hilltown, VA
- Population (ZIP)
- 2,870
Population outlook (Carroll County) Hauer SSP2
- Today (2025)
- 28,768 people
- By 2030
- 27,909 · -3.0%
- By 2040
- 25,788 · -10.4%
- By 2050
- 23,522 · -18.2%
- By 2075
- 19,045 · -33.8%
- By 2100
- 14,801 · -48.6%
Race, ethnicity, and origin ACS 2023
- Neighborhood character
- Predominantly White (94%)
- Race & ethnicity
- White 94% Hispanic / Latino 4% Two or more races 2%
- Common ancestry
- Lithuanian 1% Slovak 1%
Political lean MEDSL · Carroll
- 2024 margin
- Solid R (+63.3) · D 18.1% · R 81.4%
- 2008→2024 swing
- -30.9pp toward R · 2008: -32.4pp · 2024: -63.3pp
- All cycles
- 2024: R+63.3 2020: R+62.7 2016: R+59.6 2012: R+39.4 2008: R+32.4
Not yet ingested
- Civics
- —
Market trends
- HPI YoY
- ▲ 8.16%
- Current HPI
- 213.619
- Rent YoY
- —
- Metro
- —
- State GDP YoY
- ▲ 2.40%
- F500 in state
- 50
Industry mix (Fortune 500 HQ in VA)
| Industry | F500 HQs | Revenue |
|---|---|---|
| Aerospace / Defense | 4 | $236B |
|
||
| Technology / Defense | 3 | $32B |
|
||
| Financial Services | 2 | $176B |
|
||
| Utilities | 2 | $27B |
|
||
| Insurance | 2 | $25B |
|
||
| Technology | 2 | $15B |
|
||
Price history
-20.0% since first listed2 events — show timeline
- 2026-01-11 Price Changed $99,900 SWVAR
- 2025-09-10 Listed $124,900 SWVAR
Property tax history
+2.1%/yrLatest (2025): $389 · +41.9% YoY. Source: county tax records.
Cash-flow waterfall
monthlySold comps — $/sqft
last 12 mo · ≤1 miLoading sold comps…