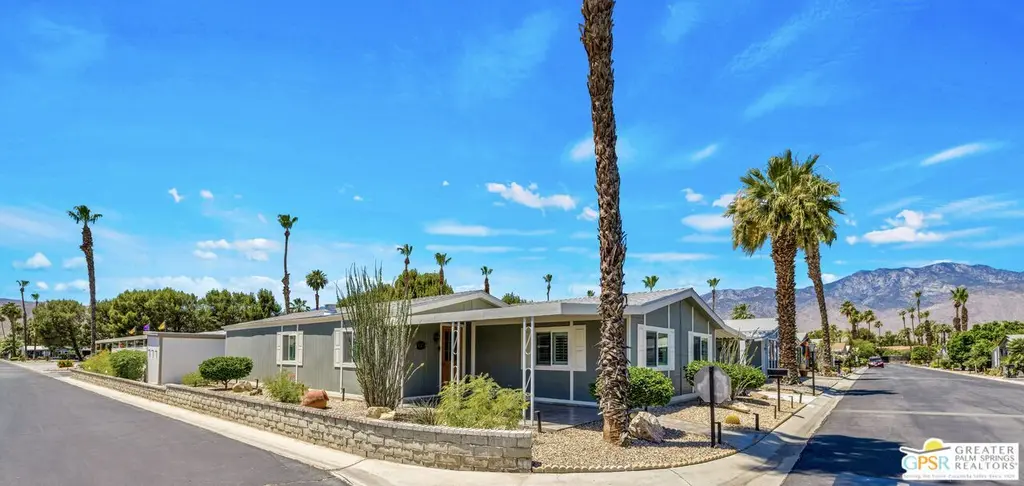
222 Settles Dr · Cathedral City, CA
Flood risk 1/10 · Minimal
- FEMA flood zone
- X
- Chance of flooding over 30 yrs
- 0.0%
- Est. flood insurance / yr
- $507 – $1,088
Fire risk 4/10 · Minor
- Est. fire insurance / yr
- $659 – $1,223
Heat risk 9/10 · Severe
- Hot days now (above 113°F)
- 7 days/yr
- Hot days in 30 yrs
- 20 days/yr
Wind risk 1/10 · Minimal
- Chance of severe wind over 30 yrs
- —
Air-quality risk 5/10 · Moderate
- Unhealthy air days now
- 6 days/yr
- Unhealthy air days in 30 yrs
- 8 days/yr
Risk factors via First Street. Map © Google.
Why this score? — see what drove the B- grade
The composite is a weighted blend of 9 inputs, each scored 0–100. Each bar is that input's sub-score; the figure is the points it added to the 100-point composite (weight × sub-score).
- Cash flow +30.0/30.0
- DSCR +10.0/10.0
- 1% rule +8.9/10.0
- ARV discount +7.5/15.0
- Rent growth +3.3/5.0
- Livability +3.3/5.0
- Schools +2.7/10.0
- Condition / age +2.5/5.0
- Appreciation +0.0/10.0
$233,500
🖨 Deal sheet 📄 Offer letter ✓ Due diligence
Listing remarks MLS
Welcome to your new home in The Canyon! This updated and spacious home is located on a corner lot and offers 1840 sq ft of living space, 3 bedrooms, 2 bathrooms, open plan living & dining, separate wet bar & entertaining area, fireplace, over sized closet, large utility room, tandem carport, and ample storage throughout. The gated, 55+ community features a large pool, spa, shuffleboard, gym, community room and clubhouse. Don't miss this opportunity!
Key facts
- Dual vanities
- Plantation shutters
- Updated ensuite bath
Tags
Property features AI
Finance
- Other: Part of The Canyon mobile home community (approx. 315 units); Mobile home to remain on site; Park is a senior community
- Financial info: Manager approval required; Monthly park lease (space rent) applies
- HOA & community: Month-to-month land lease; Onsite property management; Gated community with an automatic gate; Community amenities: clubhouse, pool, spa, exercise room, billiard and card rooms, banquet facilities, pickleball, tennis courts, multipurpose recreation room, common RV parking, greenbelt/park, lake or pond; Association pet rules
Exterior
- Parking: Carport attached; Two covered parking spaces (total 2)
- Security: Automatic gate and gated community; Carbon monoxide detectors; Smoke detectors; Resident manager
- Utilities: Sewer connected and paid; Water via water district
- Home design: Residential mobile home; Updated/remodeled; Single-story; Faces north; Triple-wide mobile home (60 x 34)
- Construction: Shingle roof; Foundation with pier jacks; Manufactured home built in 1983 (Commodore Brookwood)
- Exterior features: Covered patio; Shed; Manufactured home; Community heated pool with waterfall and fence; Community heated spa (fenced)
Interior
- Kitchen: Microwave; Gas/Electric range; Hood fan; Ice maker; Garbage disposal; Refrigerator; Range/oven
- Bedrooms: Walk-in closet
- Flooring: Carpeted floors; Tile floors
- Bathrooms: Two full bathrooms; Double vanities; Shower stall; Shower over tub
- Heating & cooling: Central heat; A/C and central cooling; Ceiling fans; Gas water heater
- Interior features: Bar and wet bar; Cathedral/vaulted ceilings; Track lighting; Open floor plan; Double-pane windows; Gas fireplace in the living room
- Laundry & utility: Laundry in unit; Washer; Dryer; Electric dryer hookup; Gas or electric dryer hookup; Water line to refrigerator
Neighborhood map
What this means for you Summary
Snapshot
- This is a 3-bed/2.0-bath manufactured listed at $234k.
Deal economics
- At list price, monthly cash flow is $1k ($14k/yr) — positive.
- The deal already cash-flows at list — no discount required.
- Meets the 1% rule at list price ($3k rent vs $234k).
- Recommended offer: $230k (1.5% below list) — sets the bar for market timing.
- Cap rate 12.3% vs local median 5.1% in Cathedral City — top-decile yield for the area; either an underpriced asset or a hidden risk that comps aren't pricing in. Stress-test before assuming the spread holds.
Location & tenants
- Location reads 66/100 on livability (#344 in CA) — a middle-class / working-renter tenant base. Strengths: commute A+, housing B+; Watch: employment D+, schools F, amenities D-.
- Palm Springs Unified (suburban): math 21% / reading 42% proficiency, ranked #328 of 517 in CA (top 63%) — families likely to look elsewhere, expect single-tenant / working-renter base with shorter leases; 73% free/reduced lunch — lower-income household profile, screen leases tightly.
- Market conditions: Rents rising (+3.2%/yr); 525 active listings in the ZIP; 34 comparable units currently listed for rent nearby; rentals lingering (median 44d on market — plan ~5-8 weeks vacancy on turnover, expect pricing pressure); 62% of comp listings sitting > 30 days — soft ceiling on asking rent; 9,195 units permitted in Riverside County in 2024 (1,512 in 5+ unit buildings).
- At $3,235/mo this rent would consume 53% of the median local household income ($74k/yr) (locally 1682% of renters already pay >50% of income on rent) — very limited rent-growth headroom before tenants either downsize or default.
Forward outlook
- Local home prices are declining (-3.0%/yr); year-one equity from $2k of loan paydown is wiped out by about $7k of value loss. Plan a longer hold.
- Riverside County population projected at +22% by 2050 — long-run rental-demand tailwind backs the buy-and-hold thesis.
- At projected returns (-3.0% appreciation + 3.2% rent growth), your $65k cash investment doubles in ~6 years — after that, you're playing with house money.
Negotiation context
- It's been on market 20 days — a 2% lower offer ($230k) is reasonable based on typical stale-listing flexibility.
- 5 sale attempts since 14y ago with the ask held roughly flat each time — persistent listings suggest the price (not the market) is what's stuck; bring a comps-based counter.
- Current owner paid $196k; 19% above their basis — modest negotiation headroom, anchor on the comps not their cost.
Risks & watch-outs
- Climate carrying-cost: extreme-heat days projected 7→20/yr by 2055 (HVAC capex compounding) — expect insurance premiums to compound above CPI over the hold.
Questions for the listing agent
- Is there a deadline driving the sale (1031 exchange, divorce, estate, relocation)? That informs how much negotiation room exists.
- Schools are F-rated, which usually means shorter tenancies and higher turnover. Who's the typical renter profile here, and what's been the actual vacancy rate?
- What's the average days-on-market for RENTAL listings here right now (not sales)? A rising rental-DOM trend means longer vacancies and softer asking-rent achievability than the comps imply.
- What's the recent tenant-quality profile in this submarket — average credit score on applications, eviction rate, late-payment / NSF rate, and stable-employment percentage? A property-management company in the area should have these aggregated.
- How much new for-sale + rental construction is in the pipeline within 1–3 miles? Heavy new supply typically softens prices + rents 12–24 months out; constrained supply supports both.
Investment metrics
- 1% rule
- 1.39% ✓
- Cap rate
- 12.29%
- Cash-on-cash
- 21.42%
- DSCR
- 1.95
- GRM
- 6.0
CMA / ARV
- ARV (on-the-fly)
- $147,200
- Comps found
- 12
Show comp detail 12 sales within ~0.75 mi
| Address | Dist | Beds/Ba | Sqft | Sold | Price | $/sf | Match |
|---|---|---|---|---|---|---|---|
| 181 Zacharia Dr | 0.19mi | 2/2.0 (-1) | 1,800 (-2%) | 1mo | $117,000 | $65 | 81 |
| 57 Coble Dr | 0.15mi | 2/2.0 (-1) | 1,920 (+4%) | 3mo | $154,000 | $80 | 78 |
| 224 Settles Dr | 0.09mi | 3/2.0 | 1,744 (-5%) | 13mo | $225,000 | $129 | 76 |
| 228 Settles Dr | 0.05mi | 2/2.0 (-1) | 1,728 (-6%) | 12mo | $165,000 | $95 | 72 |
| 130 Hester Dr | 0.14mi | 2/2.0 (-1) | 2,003 (+9%) | 4mo | $159,000 | $79 | 70 |
| 307 Coble Dr | 0.15mi | 3/2.0 | 1,701 (-8%) | 14mo | $158,000 | $93 | 68 |
| 314 Armenia Dr | 0.19mi | 2/2.0 (-1) | 1,647 (-10%) | 3mo | $169,900 | $103 | 66 |
| 180 Zacharia Dr | 0.14mi | 2/2.0 (-1) | 1,596 (-13%) | 14mo | $108,000 | $68 | 55 |
| 147 Hilligoss | 0.08mi | 2/2.0 (-1) | 1,584 (-14%) | 16mo | $89,500 | $57 | 55 |
| 10 Coble | 0.21mi | 2/2.0 (-1) | 2,100 (+14%) | 13mo | $200,000 | $95 | 51 |
| 333 Coyote | 0.51mi | 3/2.0 | 1,620 (-12%) | 10mo | $92,000 | $57 | 48 |
| 329 Coyote | 0.55mi | 2/2.0 (-1) | 1,616 (-12%) | 13mo | $57,500 | $36 | 38 |
Match score weights: distance 35% · size 25% · config 20% · recency 20%. Top-matched comps best support the ARV.
Projected returns pro-forma
-3.0% appreciation · 3.22% rent growth · sell at horizon
- IRR
- 14.2%
- Equity multiple
- 1.57×
- Total profit
- $37,109
- Equity at exit
- $34,816
- IRR
- 23.1%
- Equity multiple
- 3.00×
- Total profit
- $130,607
- Equity at exit
- $20,189
Cash invested: $65,380 (down + closing). Projections, not guarantees.
Landlord ↔ Tenant lean methodology
- Overall (STATE)
- 18 Strongly Tenant-Friendly
- State California
- 18 Strongly Tenant-Friendly · D+13
- County
- — inherits STATE
- City
- — inherits STATE
ZIP-level market 92234
- Home prices YoY
- -27.7%
- Rents YoY
- 3.2%
- Active inventory
- 525
- Price-to-rent
- 6.0×
Monthly cashflow live
- Estimated rent
- $3,235 high interval (Pro) →
- Mortgage (P&I)
- −$1,224
- Tax from tax record
- −$67 /mo · $809/yr
- Insurance
- −$97
- HOA
- −$0
- Vacancy / Maint / Mgmt
- −$679
- Net cashflow
- $1,167
Break-even live
UW: 25.0% down · 7.5% · 30yr · 1.5% tax · 5.0% vac · 8.0% maint · 8.0% mgmt
Financing live
Cash to close
- Down payment
- $58,375
- Closing costs
- $7,005
- Reserves months
- —
- Total cash needed
- —
Loan-product check · same deal, 3 products live
Conventional
25% down · 7.5% · 30yr
- Down + closing
- —
- Monthly P&I
- —
- Monthly cashflow
- —
- DSCR
- —
- Eligible?
- —
Personal DTI + credit; lowest rate.
DSCR
20% down · 8.5% · 30yr
- Down + closing
- —
- Monthly P&I
- —
- Monthly cashflow
- —
- DSCR
- —
- Eligible?
- —
No personal income docs; deal must DSCR.
Hard money
10% down · 12.0% · 12mo
- Down + closing
- —
- Monthly P&I
- —
- Monthly cashflow
- —
- DSCR
- —
- Eligible?
- —
Short-term bridge; refi at stabilization.
Rent comps 34 comps
| Address | Beds | Baths | Sqft | Rent | $/sqft | DOM | Units | Dist |
|---|---|---|---|---|---|---|---|---|
| 68615 Paseo Soria Cathedral City, CA | 2.0 | 2.0 | 1462 | $3,500 | $2.39 | 7d | 1 | 0.18mi |
| 68153 Lakeland Dr Cathedral City, CA | 2.0 | 2.0 | 1255 | $2,500 | $1.99 | 24d | 1 | 0.24mi |
| 33865 Cathedral Canyon Dr Cathedral City, CA | 4.0 | 3.0 | 1714 | $3,300 | $1.93 | 24d | 1 | 0.24mi |
| 68368 Calle Leon Cathedral City, CA | 2.0 | 2.0 | 1406 | $3,790 | $2.70 | 14d | 1 | 0.30mi |
| 68368 Calle Leon Cathedral City, CA | 2.0 | 2.0 | 1406 | $3,790 | $2.70 | 43d | 1 | 0.30mi |
| 33909 Navajo Trl Cathedral City, CA | 4.0 | 2.0 | 1684 | $3,400 | $2.02 | 43d | 1 | 0.33mi |
| 33892 Sky Blue Water Trl Cathedral City, CA | 3.0 | 2.0 | 1352 | $2,800 | $2.07 | 4d | 1 | 0.36mi |
| 69180 Victoria Dr #8 Cathedral City, CA | 3.0 | 2.0 | 1230 | $1,995 | $1.62 | 2d | 1 | 0.53mi |
| 35200 Cathedral Canyon Dr Unit B10 Cathedral City, CA | 2.0 | 2.0 | 1384 | $2,600 | $1.88 | 43d | 1 | 0.56mi |
| 35200 Cathedral Canyon Dr Unit H64 Cathedral City, CA | 2.0 | 2.0 | 1375 | $2,500 | $1.82 | 43d | 1 | 0.58mi |
| 68859 Paseo Real Cathedral City, CA | 2.0 | 2.0 | 1406 | $3,960 | $2.82 | 43d | 1 | 0.61mi |
| 68859 Paseo Real Cathedral City, CA | 2.0 | 2.0 | 1406 | $3,960 | $2.82 | 14d | 1 | 0.61mi |
| 34750 Marcia Rd Unit 02 Cathedral City, CA | 3.0 | 2.0 | 1325 | $2,000 | $1.51 | 18d | 1 | 0.62mi |
| 33411 Shifting Sands Trl Cathedral City, CA | 4.0 | 2.0 | 1945 | $3,350 | $1.72 | 43d | 1 | 0.63mi |
| 33387 Shifting Sands Trl Unit 2 Cathedral City, CA | 2.0 | 2.0 | 1300 | $1,999 | $1.54 | 24d | 1 | 0.64mi |
| 32790 Aurora Vista Rd Cathedral City, CA | 3.0 | 3.0 | 2037 | $3,300 | $1.62 | 43d | 1 | 0.70mi |
| 69200 Nilda Dr Cathedral City, CA | 3.0 | 2.0 | 1330 | $2,495 | $1.88 | 21d | 1 | 0.73mi |
| 68882 Calle Mula Cathedral City, CA | 2.0 | 2.0 | 1714 | $2,500 | $1.46 | 20d | 1 | 0.81mi |
| 32771 Whispering Palms Trl Cathedral City, CA | 4.0 | 2.0 | 1600 | $2,900 | $1.81 | 43d | 1 | 0.83mi |
| 6134 Arroyo Rd #6 Palm Springs, CA | 4.0 | 2.5 | 1551 | $3,500 | $2.26 | 43d | 1 | 0.87mi |
| 99 Shoreline Dr Rancho Mirage, CA | 3.0 | 3.0 | 2102 | $4,000 | $1.90 | 43d | 1 | 0.90mi |
| 9 Loch Ness Lake Ct Rancho Mirage, CA | 4.0 | 4.5 | 2373 | $5,000 | $2.11 | 43d | 1 | 0.95mi |
| 34361 Denise Way Rancho Mirage, CA | 3.0 | 2.0 | 1400 | $2,800 | $2.00 | 43d | 1 | 1.00mi |
| 5951 Montecito Dr #5 Palm Springs, CA | 3.0 | 2.5 | 1551 | $2,300 | $1.48 | 43d | 1 | 1.01mi |
| 59 Shoreline Dr Rancho Mirage, CA | 3.0 | 3.5 | 2235 | $3,995 | $1.79 | 43d | 1 | 1.02mi |
| 26 Pueblo Vista Dr Palm Springs, CA | 3.0 | 2.0 | 1487 | $3,200 | $2.15 | 43d | 1 | 1.06mi |
| 37 Shoreline Dr Rancho Mirage, CA | 3.0 | 3.0 | 1928 | $3,650 | $1.89 | 43d | 1 | 1.08mi |
| 2420 Los Coyotes Dr Palm Springs, CA | 2.0 | 3.0 | 1608 | $2,600 | $1.62 | 43d | 1 | 1.10mi |
| 152 Estrada Way #152 Cathedral City, CA | 2.0 | 2.0 | 1500 | $2,200 | $1.47 | 43d | 1 | 1.13mi |
| 159 Estrada Way Cathedral City, CA | 3.0 | 2.0 | 1800 | $2,850 | $1.58 | 43d | 1 | 1.16mi |
| 35349 Rush Ln Cathedral City, CA | 3.0 | 3.0 | 2196 | $3,895 | $1.77 | 23d | 1 | 1.25mi |
| 5314 Los Coyotes Dr Palm Springs, CA | 3.0 | 3.0 | 1550 | $2,600 | $1.68 | 20d | 1 | 1.26mi |
| 31675 Victor Rd Cathedral City, CA | 4.0 | 2.0 | 1887 | $3,500 | $1.85 | 43d | 1 | 1.41mi |
| 31325 Avenida La Gaviota Cathedral City, CA | 4.0 | 2.0 | 1906 | $3,900 | $2.05 | 43d | 1 | 1.47mi |
Listing history 14 events
-
2026-06-18days on market $233,500 Active 20 DOM
-
2026-06-17days on market $233,500 Active 19 DOM
-
2026-06-16days on market $233,500 Active 18 DOM
-
2026-06-15days on market $233,500 Active 17 DOM
-
2026-06-13days on market $233,500 Active 15 DOM
-
2026-06-13days on market $233,500 Active 14 DOM
-
2026-06-09days on market $233,500 Active 11 DOM
-
2026-06-08days on market $233,500 Active 10 DOM
-
2026-06-07days on market $233,500 Active 9 DOM
-
2026-06-04days on market $233,500 Active 6 DOM
-
2026-06-03days on market $233,500 Active 5 DOM
-
2026-06-02days on market $233,500 Active 4 DOM
-
2026-06-01days on market $233,500 Active 3 DOM
-
2026-05-31days on market $233,500 Active 2 DOM
ⓘ Source: listings_history table (triggers on properties + properties_extension) + one-shot
backfill from property_details.listing_events for pre-trigger history.
Tax reassessment forecast CA · Resets to sale price
- Current annual tax
- $809 · $67/mo
- Projected year-2 tax
- $1,775 · $148/mo
- Expected delta
- +$966/yr (+$81/mo · 119.5%)
ⓘ Screening estimate from a state-policy table — verify with the county assessor before closing.
Climate risk First Street
- Flood 1/10 Low FEMA zone X · 0% chance over 30 yrs
- Wildfire 4/10 Moderate
- Heat 9/10 Extreme 7 d/yr ≥113°F today · 20 d/yr by 30 yrs out
- Wind 1/10 Low
- Air quality 5/10 Major 6 unhealthy d/yr today · 8 by 30 yrs out
Nearby sold comps map
Loading sold comps map…
Walkable amenities ~0.75 mi
Loading nearby amenities…
Taxation est. · year 1
- Rental income
- $38,826
- − Mortgage interest
- −$13,080
- − Property taxes
- −$809
- − Insurance
- −$1,168
- − Repairs & maintenance
- −$3,106
- − Management
- −$3,106
- − Depreciation
- −$6,793
- Taxable income
- $10,765
- Est. tax owed @ 24.0%
- −$2,584
- After-tax cash flow
- $11,419/yr
For passive investors: Depreciation is non-cash, so a rental often shows a tax loss while cash-flowing — sheltering income. Rental losses are passive: they offset passive income freely, and up to $25,000/yr can offset ordinary (W-2) income if you actively participate and your MAGI is under $100k (phasing out to $0 by $150k); unused losses carry forward. On sale, claimed depreciation is recaptured at up to 25%, and gains may owe capital-gains tax (a 1031 exchange can defer both). Figures are a year-1 estimate at your 24.0% rate — not tax advice; consult a CPA.
Schools (NCES district)
- District
- Palm Springs Unified
- NCES district ID
- 0629550
- Math proficiency
- 21% ▼ -7.00%
- Reading proficiency
- 42% ▬ 0.00%
- Median HH income
- $43,638
- Composite
- 26.76/100
- National rank
- #7131
- State rank
- #328 of 517 in CA
Livability — Cathedral City
- Score
- 66/100
- State rank
- #344
- US rank
- #11749
Category grades
Schools grade is shown separately in the Schools card above.
Census & demographics
- Census place
- Cathedral City, CA
- County
- Riverside County · 2,287,001 people
- City population
- 52,267
- Metro
- Riverside-San Bernardino-Ontario, CA
- Population (ZIP)
- 52,267
- Household income
- $73,572
- Rent vs Own
- Severe rent burden
- 1682.0
Population outlook (Riverside County) Hauer SSP2
- Today (2025)
- 2,664,475 people
- By 2030
- 2,802,692 · +5.2%
- By 2040
- 3,050,904 · +14.5%
- By 2050
- 3,256,783 · +22.2%
- By 2075
- 3,655,058 · +37.2%
- By 2100
- 3,766,594 · +41.4%
Race, ethnicity, and origin ACS 2023
- Neighborhood character
- Diverse neighborhood (Simpson 0.56)
- Race & ethnicity
- Hispanic / Latino 59% White 30% Two or more races 27% Asian 6% Native American 2% Black 2%
- Hispanic origin (detail)
- Mexican 51%
- Common ancestry
- Lithuanian 2% Romanian 1% Italian 1%
- Foreign-born
- 28% · Canada, Vietnam
- Languages at home
- 48% English-only · Spanish 46% Tagalog/Filipino 3% Other Asian/Pacific 1%
Political lean MEDSL · Riverside
- 2024 margin
- Toss-up / Even · D 48.0% · R 49.3% · Other 2.6%
- 2008→2024 swing
- -3.6pp toward R · 2008: 2.3pp · 2024: -1.3pp
- All cycles
- 2024: R+1.3 2020: D+8.0 2016: D+4.3 2012: R+0.4 2008: D+2.3
Not yet ingested
- Civics
- —
Market trends
- HPI YoY
- ▼ -136.57%
- Current HPI
- 356.9845
- Rent YoY
- ▲ 3.22%
- Metro
- Riverside-San Bernardino-Ontario, CA
- State GDP YoY
- ▲ 3.21%
- F500 in state
- 116
Industry mix (Fortune 500 HQ in CA)
| Industry | F500 HQs | Revenue |
|---|---|---|
| Technology | 27 | $1,492B |
|
||
| Financial Services | 3 | $174B |
|
||
| Retail | 3 | $44B |
|
||
| Insurance | 3 | $26B |
|
||
| Media / Entertainment | 2 | $115B |
|
||
| Pharmaceuticals / Biotech | 2 | $62B |
|
||
Price history
+289.8% since first listed20 events — show timeline
- 2026-05-29 Listed $233,500 TheMLS
- 2024-08-06 Sold (MLS) $196,000 GPSMLS
- 2024-07-26 Pending — GPSMLS
- 2024-07-16 Contingent — GPSMLS
- 2024-07-12 Listed $205,000 GPSMLS
- 2017-09-06 Sold (MLS) $59,500 GPSMLS
- 2017-09-06 Sold (MLS) $59,500 GPSMLS
- 2017-08-21 Pending — GPSMLS
- 2017-08-08 Contingent — GPSMLS
- 2017-07-29 Listed $59,500 GPSMLS
- 2014-09-30 Sold (MLS) $39,000 GPSMLS
- 2014-09-30 Sold (MLS) $39,000 GPSMLS
- 2014-09-29 Pending — GPSMLS
- 2014-09-22 Listing Removed — GPSMLS
- 2014-09-07 Pending — GPSMLS
- 2014-06-05 Price Changed $47,500 GPSMLS
- 2014-02-25 Price Changed $53,000 GPSMLS
- 2013-11-21 Listed $57,000 GPSMLS
- 2013-01-02 Listing Removed — GPSMLS
- 2012-06-02 Listed $59,900 GPSMLS
Property tax history
+0.6%/yrLatest (2025): $809 · +35.4% YoY. Source: county tax records.
Cash-flow waterfall
monthlySold comps — $/sqft
last 12 mo · ≤1 miLoading sold comps…