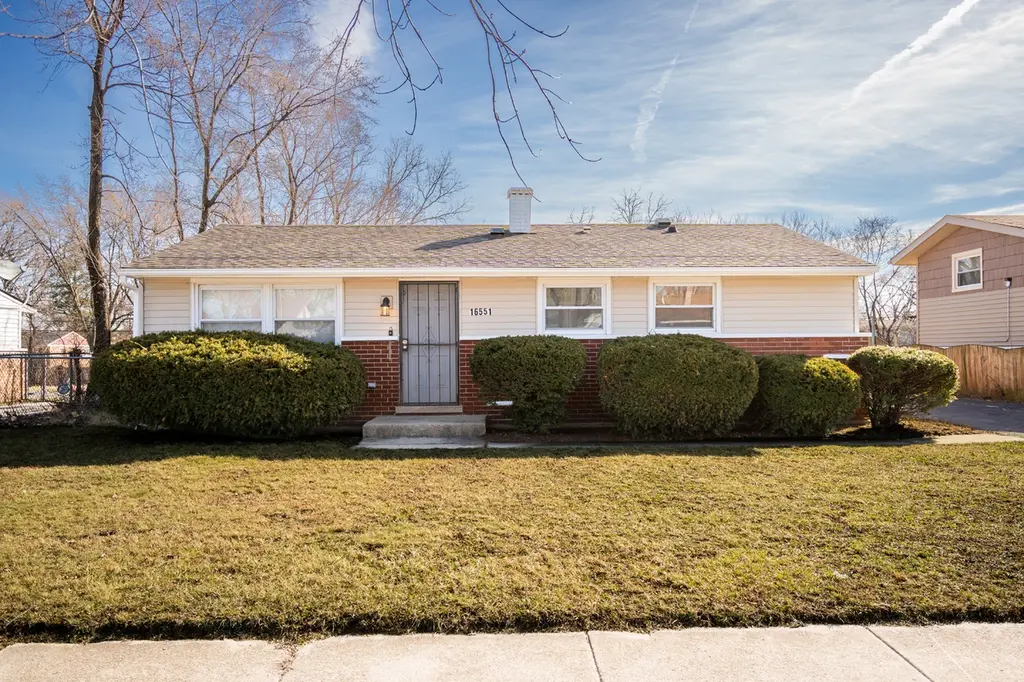
16551 Plymouth Dr · Markham, IL
Flood risk 1/10 · Minimal
- FEMA flood zone
- X (unshaded)
- Chance of flooding over 30 yrs
- 0.0%
- Est. flood insurance / yr
- $473 – $860
Fire risk 1/10 · Minimal
- Est. fire insurance / yr
- $804 – $1,492
Heat risk 3/10 · Minor
- Hot days now (above 102°F)
- 7 days/yr
- Hot days in 30 yrs
- 15 days/yr
Wind risk 2/10 · Minimal
- Chance of severe wind over 30 yrs
- —
Air-quality risk 3/10 · Minor
- Unhealthy air days now
- 4 days/yr
- Unhealthy air days in 30 yrs
- 4 days/yr
Risk factors via First Street. Map © Google.
Why this score? — see what drove the B grade
The composite is a weighted blend of 9 inputs, each scored 0–100. Each bar is that input's sub-score; the figure is the points it added to the 100-point composite (weight × sub-score).
- Cash flow +30.0/30.0
- 1% rule +10.0/10.0
- DSCR +10.0/10.0
- Appreciation +10.0/10.0
- ARV discount +4.7/15.0
- Livability +3.8/5.0
- Rent growth +2.5/5.0
- Condition / age +2.5/5.0
- Schools +1.5/10.0
$149,900
🖨 Deal sheet 📄 Offer letter ✓ Due diligence
Listing remarks
PRICE REDUCED!Current taxes reflect no exemptions, giving owner-occupants the opportunity of reduced taxes! Swing by this cozy move-in ready ranch with no stairs, perfect for anyone seeking true one-level living. This updated 3-bedroom, 1-bath home features a bright modern kitchen and a refreshed bathroom bringing comfort and style from day one. The huge yard has endless potential, perfect for this upcoming summer and large enough to build a garage or design your ideal outdoor space. The side driveway fits two cars easily. . A clean, well-maintained home with great possibilities-don't miss out!
Key facts
- Freshly painted
- Large yard
- Eat-in kitchen
Tags
Property features AI
Finance
- Other: Possession at closing; Earnest money is held
- HOA & community: No master association required
Exterior
- Parking: Two parking spaces; Asphalt off-street parking with side apron (owned)
- Utilities: Public water; Public sewer; Electric with circuit breakers
- Home design: Detached single-family home; One-story residence; Fee simple ownership; Built prior to 1978
- Construction: Vinyl siding and brick exterior; Asphalt roof; Concrete perimeter foundation; Estimated age 61–70 years
- Exterior features: Fenced yard with chain link fencing; Lot dimensions approximately 59 x 150; Less than 0.25 acre lot; Curb, sidewalk, street lights, and paved streets in the neighborhood; School bus and commuter bus access; close to interstate access
Interior
- Kitchen: Galley kitchen with eating area/table space; Granite counters; Range, Microwave, Dishwasher, Refrigerator
- Bedrooms: Master bedroom on main level (14 x 12) with laminate flooring; Bedroom 2 on main level (13 x 12) with wood laminate flooring; Bedroom 3 on main level (12 x 12) with wood laminate flooring
- Flooring: Laminate/wood laminate flooring throughout main rooms
- Bathrooms: One full bathroom on the main level
- Heating & cooling: Natural gas forced air heating; Central air conditioning
- Interior features: First-floor bedroom; First-floor full bath; Granite counters; Windows with screens and drapes; Total of 5 rooms; Crawl space basement
- Laundry & utility: Main-level laundry in a laundry closet (7 x 7); In-unit laundry
Neighborhood map
What this means for you Summary
Snapshot
- This is a 2-bed/1.0-bath single-family listed at $150k.
Deal economics
- At list price, monthly cash flow is $810 ($10k/yr) — positive.
- The deal already cash-flows at list — no discount required.
- Meets the 1% rule at list price ($2k rent vs $150k).
- Cap rate 12.8% vs local median 10.2% in Markham — meaningfully above typical; check what's discounted (condition, days-on-market, listing class) to confirm the premium yield is real.
Location & tenants
- Location reads 76/100 on livability (#186 in IL, #3,539 nationally) — a middle-class / working-renter tenant base. Strengths: commute A+, cost of living A+, housing A+; Watch: crime D, amenities D, employment D.
- Bremen Chsd 228 (suburban): math 15% / reading 17% proficiency, ranked #468 of 620 in IL (top 76%) — low school quality limits family demand, transient renter base, plan for 1-2y turnover.
- Market conditions: 65 active listings in the ZIP; 9 comparable units currently listed for rent nearby; rentals leasing fast (median 1d on market — plan ~1-2 weeks tenant-placement turnaround); 6,272 units permitted in Cook County in 2024 (4,658 in 5+ unit buildings).
Forward outlook
- In year one you build about $16k of equity ($1k loan paydown + $15k appreciation (10.0% local appreciation)).
- At projected returns (10.0% appreciation + 3.0% rent growth), your $42k cash investment doubles in ~2 years — after that, you're playing with house money.
- By year 3, paydown + projected appreciation supports a ~$41k cash-out refi (75% LTV) — recoverable capital for the next deal without selling this one.
Negotiation context
- Only 9 days on market — expect competitive offers; lowballing is unlikely to land.
- 5 sale attempts with the ask held roughly flat each time — persistent listings suggest the price (not the market) is what's stuck; bring a comps-based counter.
Questions for the listing agent
- Built in 1960 — when were the roof, HVAC, electrical panel, plumbing, and water heater last replaced?
- Is there a deadline driving the sale (1031 exchange, divorce, estate, relocation)? That informs how much negotiation room exists.
- Schools are F-rated, which usually means shorter tenancies and higher turnover. Who's the typical renter profile here, and what's been the actual vacancy rate?
- Crime grade is D in this area — have there been break-ins, vandalism, or insurance claims at this property in the last 3 years? What carrier currently insures it and at what premium?
- What's the average days-on-market for RENTAL listings here right now (not sales)? A rising rental-DOM trend means longer vacancies and softer asking-rent achievability than the comps imply.
- What's the recent tenant-quality profile in this submarket — average credit score on applications, eviction rate, late-payment / NSF rate, and stable-employment percentage? A property-management company in the area should have these aggregated.
- How much new for-sale + rental construction is in the pipeline within 1–3 miles? Heavy new supply typically softens prices + rents 12–24 months out; constrained supply supports both.
Investment metrics
- 1% rule
- 1.56% ✓
- Cap rate
- 12.78%
- Cash-on-cash
- 23.17%
- DSCR
- 2.03
- GRM
- 5.3
CMA / ARV
- ARV (on-the-fly)
- $141,000
- Comps found
- 12
Show comp detail 12 sales within ~0.75 mi
| Address | Dist | Beds/Ba | Sqft | Sold | Price | $/sf | Match |
|---|---|---|---|---|---|---|---|
| 16501 Oxford Dr S | 0.11mi | 3/1.0 (+1) | 975 (-2%) | 3mo | $105,000 | $108 | 83 |
| 16358 Plymouth Dr | 0.23mi | 3/1.0 (+1) | 993 (-1%) | 2mo | $138,999 | $140 | 82 |
| 16309 Plymouth Dr | 0.33mi | 3/1.0 (+1) | 1,051 (+5%) | 2mo | $170,000 | $162 | 70 |
| 16614 Plymouth Dr | 0.06mi | 3/1.5 (+1) | 1,117 (+12%) | 4mo | $75,000 | $67 | 67 |
| 3027 Wilshire Ave | 0.59mi | 3/1.0 (+1) | 1,025 (+2%) | 3mo | $155,000 | $151 | 61 |
| 16165 Oxford Dr | 0.48mi | 3/1.0 (+1) | 1,061 (+6%) | 3mo | $154,900 | $146 | 60 |
| 16364 California Ave | 0.23mi | 3/1.5 (+1) | 1,133 (+13%) | 5mo | $160,000 | $141 | 56 |
| 2926 Sussex Ave | 0.64mi | 3/1.0 (+1) | 1,048 (+5%) | 1mo | $129,900 | $124 | 56 |
| 16738 Crane Ave | 0.64mi | 3/1.0 (+1) | 1,059 (+6%) | 2mo | $147,000 | $139 | 54 |
| 16784 Crane Ave | 0.65mi | 3/1.0 (+1) | 1,059 (+6%) | 2mo | $155,000 | $146 | 53 |
| 16155 Kedzie Pkwy | 0.74mi | 3/1.0 (+1) | 1,048 (+5%) | 1mo | $215,000 | $205 | 52 |
| 16727 Head Ave | 0.72mi | 3/1.5 (+1) | 1,150 (+15%) | 1mo | $157,000 | $137 | 34 |
Match score weights: distance 35% · size 25% · config 20% · recency 20%. Top-matched comps best support the ARV.
Projected returns pro-forma
10.0% appreciation · 3.0% rent growth · sell at horizon
- IRR
- 41.7%
- Equity multiple
- 4.18×
- Total profit
- $133,285
- Equity at exit
- $135,042
- IRR
- 36.0%
- Equity multiple
- 9.39×
- Total profit
- $351,987
- Equity at exit
- $291,223
Cash invested: $41,972 (down + closing). Projections, not guarantees.
Landlord ↔ Tenant lean methodology
- Overall (STATE)
- 43 Moderately Tenant-Leaning
- State Illinois
- 43 Moderately Tenant-Leaning · D+7
- County
- — inherits STATE
- City
- — inherits STATE
ZIP-level market 60428
- Home prices YoY
- 8.5%
- Active inventory
- 65
- Price-to-rent
- 5.3×
Monthly cashflow live
- Estimated rent
- $2,337 high interval (Pro) →
- Mortgage (P&I)
- −$786
- Tax est. 1.5%
- −$187 /mo · $2,248/yr
- Insurance
- −$62
- HOA
- −$0
- Vacancy / Maint / Mgmt
- −$491
- Net cashflow
- $810
Break-even live
UW: 25.0% down · 7.5% · 30yr · 1.5% tax · 5.0% vac · 8.0% maint · 8.0% mgmt
Financing live
Cash to close
- Down payment
- $37,475
- Closing costs
- $4,497
- Reserves months
- —
- Total cash needed
- —
Loan-product check · same deal, 3 products live
Conventional
25% down · 7.5% · 30yr
- Down + closing
- —
- Monthly P&I
- —
- Monthly cashflow
- —
- DSCR
- —
- Eligible?
- —
Personal DTI + credit; lowest rate.
DSCR
20% down · 8.5% · 30yr
- Down + closing
- —
- Monthly P&I
- —
- Monthly cashflow
- —
- DSCR
- —
- Eligible?
- —
No personal income docs; deal must DSCR.
Hard money
10% down · 12.0% · 12mo
- Down + closing
- —
- Monthly P&I
- —
- Monthly cashflow
- —
- DSCR
- —
- Eligible?
- —
Short-term bridge; refi at stabilization.
Rent comps 9 comps
| Address | Beds | Baths | Sqft | Rent | $/sqft | DOM | Units | Dist |
|---|---|---|---|---|---|---|---|---|
| 16752 Artesian Ave Hazel Crest, IL | 3.0 | 1.0 | 867 | $2,500 | $2.88 | 1d | 1 | 0.43mi |
| 16751 Crane Ave Hazel Crest, IL | 3.0 | 1.0 | 1200 | $1,800 | $1.50 | 1d | 1 | 0.66mi |
| 2308 170th St Hazel Crest, IL | 3.0 | 2.0 | 1020 | $2,400 | $2.35 | 1d | 1 | 0.75mi |
| 2173 171st St Hazel Crest, IL | 3.0 | 1.5 | 1159 | $2,350 | $2.03 | 1d | 1 | 0.98mi |
| 2107 171st St Unit 2107 Hazel Crest, IL | 3.0 | 1.5 | 1158 | $2,300 | $1.99 | 1d | 1 | 1.05mi |
| 2722 Larkspur Ln Hazel Crest, IL | 3.0 | 1.5 | 1441 | $2,650 | $1.84 | 12d | 1 | 1.30mi |
| 17561 Hillside Ave Homewood, IL | 3.0 | 1.0 | 1174 | $2,300 | $1.96 | 1d | 1 | 1.44mi |
| 17561 Hillside Ave Homewood, IL | 3.0 | 1.0 | 1174 | $2,500 | $2.13 | 16d | 1 | 1.44mi |
| 16125 Marshfield Ave Markham, IL | 3.0 | 1.0 | 1043 | $2,400 | $2.30 | 1d | 1 | 1.45mi |
Listing history 22 events
-
2026-06-18days on market $149,900 Active 9 DOM
-
2026-06-17days on market $149,900 Active 8 DOM
-
2026-06-16days on market $149,900 Active 7 DOM
-
2026-06-15days on market $149,900 Active 6 DOM
-
2026-06-13days on market $149,900 Active 4 DOM
-
2026-06-10pricedays on market $149,900 Active 1 DOM
-
2026-06-04days on market $155,000 Active 52 DOM
-
2026-06-03days on market $155,000 Active 51 DOM
-
2026-06-02days on market $155,000 Active 50 DOM
-
2026-06-01days on market $155,000 Active 49 DOM
-
2026-05-31days on market $155,000 Active 48 DOM
-
2026-04-13$155,000 Active
-
2026-04-13historical
-
2026-03-11Active
-
2026-03-03historical
-
2026-02-04Active
-
2026-02-04historical
-
2025-12-12Active
-
2025-03-28historical $2,200
-
2025-01-07$2,200
-
2022-11-21soldstatus $149,000
-
2003-08-21soldstatus $66,500
ⓘ Source: listings_history table (triggers on properties + properties_extension) + one-shot
backfill from property_details.listing_events for pre-trigger history.
Climate risk First Street
- Flood 1/10 Low FEMA zone X (unshaded) · 0% chance over 30 yrs
- Wildfire 1/10 Low
- Heat 3/10 Moderate 7 d/yr ≥102°F today · 15 d/yr by 30 yrs out
- Wind 2/10 Low
- Air quality 3/10 Moderate 4 unhealthy d/yr today · 4 by 30 yrs out
Nearby sold comps map
Loading sold comps map…
Walkable amenities ~0.75 mi
Loading nearby amenities…
Taxation est. · year 1
- Rental income
- $28,044
- − Mortgage interest
- −$8,397
- − Property taxes
- −$2,248
- − Insurance
- −$750
- − Repairs & maintenance
- −$2,244
- − Management
- −$2,244
- − Depreciation
- −$4,361
- Taxable income
- $7,802
- Est. tax owed @ 24.0%
- −$1,872
- After-tax cash flow
- $7,852/yr
For passive investors: Depreciation is non-cash, so a rental often shows a tax loss while cash-flowing — sheltering income. Rental losses are passive: they offset passive income freely, and up to $25,000/yr can offset ordinary (W-2) income if you actively participate and your MAGI is under $100k (phasing out to $0 by $150k); unused losses carry forward. On sale, claimed depreciation is recaptured at up to 25%, and gains may owe capital-gains tax (a 1031 exchange can defer both). Figures are a year-1 estimate at your 24.0% rate — not tax advice; consult a CPA.
Schools (NCES district)
- District
- Bremen Chsd 228
- NCES district ID
- 1707050
- Math proficiency
- 15% ▼ -4.00%
- Reading proficiency
- 17% ▼ -5.00%
- Median HH income
- $57,625
- Composite
- 15.32/100
- National rank
- #9327
- State rank
- #468 of 620 in IL
Livability — Markham
- Score
- 76/100
- State rank
- #186
- US rank
- #3539
Category grades
Schools grade is shown separately in the Schools card above.
Census & demographics
- Census place
- Markham, IL
- City population
- 10,980
- Population (ZIP)
- 10,980
Population outlook (Cook County) Hauer SSP2
- Today (2025)
- 5,347,519 people
- By 2030
- 5,357,703 · +0.2%
- By 2040
- 5,324,924 · -0.4%
- By 2050
- 5,230,762 · -2.2%
- By 2075
- 4,785,735 · -10.5%
- By 2100
- 4,188,836 · -21.7%
Race, ethnicity, and origin ACS 2023
- Neighborhood character
- Predominantly Black (69%)
- Race & ethnicity
- Black 69% Hispanic / Latino 17% White 11% Two or more races 4%
- Hispanic origin (detail)
- Mexican 16%
- Common ancestry
- Romanian 1% Lithuanian 1% Iranian 1%
- Foreign-born
- 8% · Canada
- Languages at home
- 86% English-only · Spanish 14%
Political lean MEDSL · Cook
- 2024 margin
- Solid D (+42.0) · D 70.4% · R 28.4% · Other 1.2%
- 2008→2024 swing
- -11.4pp toward R · 2008: 53.4pp · 2024: 42.0pp
- All cycles
- 2024: D+42.0 2020: D+50.3 2016: D+53.0 2012: D+49.4 2008: D+53.4
Not yet ingested
- Civics
- —
Market trends
- HPI YoY
- ▲ 23.63%
- Current HPI
- 302.333
- Rent YoY
- —
- Metro
- —
- State GDP YoY
- ▲ 1.59%
- F500 in state
- 60
Industry mix (Fortune 500 HQ in IL)
| Industry | F500 HQs | Revenue |
|---|---|---|
| Insurance | 4 | $201B |
|
||
| Consumer Goods | 4 | $87B |
|
||
| Industrial Machinery | 3 | $64B |
|
||
| Healthcare | 2 | $55B |
|
||
| Retail / Pharmacy | 1 | $148B |
|
||
| Agriculture / Food | 1 | $86B |
|
||
Price history
+133.1% since first listed11 events — show timeline
- 2026-04-13 Listing Removed — MRED as Distributed by MLS Grid
- 2026-04-13 Listed $155,000 MRED as Distributed by MLS Grid
- 2026-03-11 Listed — MRED as Distributed by MLS Grid
- 2026-03-03 Listing Removed — MRED as Distributed by MLS Grid
- 2026-02-04 Listing Removed — MRED as Distributed by MLS Grid
- 2026-02-04 Listed — MRED as Distributed by MLS Grid
- 2025-12-12 Listed — MRED as Distributed by MLS Grid
- 2025-03-28 Rental Removed $2,200 TURBOTENANT
- 2025-01-07 Listed for Rent $2,200 TURBOTENANT
- 2022-11-21 Sold (Public Records) $149,000 Public Records
- 2003-08-21 Sold (Public Records) $66,500 Public Records
Property tax history
+6.7%/yrLatest (2023): $8,104 · +91.0% YoY. Source: county tax records.
Cash-flow waterfall
monthlySold comps — $/sqft
last 12 mo · ≤1 miLoading sold comps…