5810 Fm-1769 · Loving, TX
Flood risk No data
- FEMA flood zone
- —
- Chance of flooding over 30 yrs
- —
- Est. flood insurance / yr
- —
Fire risk No data
- Est. fire insurance / yr
- —
Heat risk No data
- Hot days now (above threshold)
- —
- Hot days in 30 yrs
- —
Wind risk No data
- Chance of severe wind over 30 yrs
- —
Air-quality risk No data
- Unhealthy air days now
- —
- Unhealthy air days in 30 yrs
- —
Risk factors via First Street. Map © Google.
Why this score? — see what drove the B- grade
The composite is a weighted blend of 9 inputs, each scored 0–100. Each bar is that input's sub-score; the figure is the points it added to the 100-point composite (weight × sub-score).
- Cash flow +30.0/30.0
- 1% rule +10.0/10.0
- DSCR +10.0/10.0
- ARV discount +6.8/15.0
- Schools +3.9/10.0
- Rent growth +2.5/5.0
- Livability +2.5/5.0
- Condition / age +2.5/5.0
- Appreciation +0.0/10.0
$56,500
🖨 Deal sheet 📄 Offer letter ✓ Due diligence
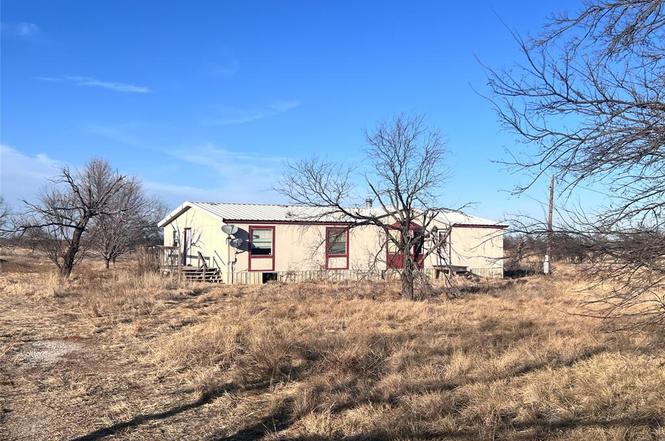
Listing remarks
Country Living Fixer-Upper. Sitting on 2.46 acres, this mobile needs some (ok. .. maybe a lot) of TLC to bring it back to life! The house has two living areas - a living room and den that share a see through brick mantled fireplace. All three of the bedrooms are good sized. The master bedroom has a ensuite bathroom; the other two bedrooms share a hallway bath. The kitchen opens to the dining area. There is a deck to a side entry and a deck on the back of the house. Includes a large storage container and a small metal building.
Key facts
- Small metal building
- Two living areas
- 2.46 acre lot
Tags
Neighborhood map
What this means for you Summary
Snapshot
- This is a 3-bed/2.0-bath manufactured listed at $56k.
Deal economics
- At list price, monthly cash flow is $768 ($9k/yr) — positive.
- The deal already cash-flows at list — no discount required.
- Meets the 1% rule at list price ($1k rent vs $56k).
- Recommended offer: $56k (1.5% below list) — sets the bar for market timing.
Location & tenants
- Location reads: area grade B — affects rentability + tenant quality, not the cash-flow math above.
- Graham ISD (town): math 50% / reading 42% proficiency, ranked #252 of 826 in TX (top 30%) — families likely to look elsewhere, expect single-tenant / working-renter base with shorter leases.
- Zoned schools: Graham El (math 47% / reading 44%, grade D-, #1,112 of 4,322 statewide, top 26%, 1,050 students, 64% FRL) — zoned schools average 64% FRL vs 47% district-wide (16 pts higher); higher-poverty schools than district average — tighter screening recommended.
- Market conditions: 187 active listings in the ZIP; 5 units permitted in Young County in 2024 (0 in 5+ unit buildings).
Forward outlook
- Local home prices are declining (-3.0%/yr); year-one equity from $391 of loan paydown is wiped out by about $2k of value loss. Plan a longer hold.
- Young County population projected to shrink 7% by 2050 — rents likely to lag national; underwrite the cash flow, not the appreciation.
- At projected returns (-3.0% appreciation + 3.0% rent growth), your $16k cash investment doubles in ~2 years — after that, you're playing with house money.
Negotiation context
- It's been on market 30 days — a 2% lower offer ($56k) is reasonable based on typical stale-listing flexibility.
Questions for the listing agent
- Is there a deadline driving the sale (1031 exchange, divorce, estate, relocation)? That informs how much negotiation room exists.
- What's the average days-on-market for RENTAL listings here right now (not sales)? A rising rental-DOM trend means longer vacancies and softer asking-rent achievability than the comps imply.
- What's the recent tenant-quality profile in this submarket — average credit score on applications, eviction rate, late-payment / NSF rate, and stable-employment percentage? A property-management company in the area should have these aggregated.
- How much new for-sale + rental construction is in the pipeline within 1–3 miles? Heavy new supply typically softens prices + rents 12–24 months out; constrained supply supports both.
Investment metrics
- 1% rule
- 2.54% ✓
- Cap rate
- 22.61%
- Cash-on-cash
- 58.27%
- DSCR
- 3.59
- GRM
- 3.3
CMA / ARV
- ARV (on-the-fly)
- $55,680
- Comps found
- 1
Show comp detail 1 sale within ~0.75 mi
| Address | Dist | Beds/Ba | Sqft | Sold | Price | $/sf | Match |
|---|---|---|---|---|---|---|---|
| 5810 Fm-1769 | 0.00mi | 3/2.0 | 1,920 (0%) | 1mo | $56,500 | $29 | 99 |
Match score weights: distance 35% · size 25% · config 20% · recency 20%. Top-matched comps best support the ARV.
Projected returns pro-forma
-3.0% appreciation · 3.0% rent growth · sell at horizon
- IRR
- 56.8%
- Equity multiple
- 3.51×
- Total profit
- $39,775
- Equity at exit
- $8,424
- IRR
- 61.8%
- Equity multiple
- 7.17×
- Total profit
- $97,658
- Equity at exit
- $4,885
Cash invested: $15,820 (down + closing). Projections, not guarantees.
Landlord ↔ Tenant lean methodology
- Overall (STATE)
- 87 Strongly Landlord-Friendly
- State Texas
- 87 Strongly Landlord-Friendly · R+5
- County
- — inherits STATE
- City
- — inherits STATE
ZIP-level market 76450
- Home prices YoY
- -24.0%
- Active inventory
- 187
- Price-to-rent
- 3.3×
Monthly cashflow live
- Estimated rent
- $1,435 medium interval (Pro) →
- Mortgage (P&I)
- −$296
- Tax from tax record
- −$46 /mo · $552/yr
- Insurance
- −$24
- HOA
- −$0
- Vacancy / Maint / Mgmt
- −$301
- Net cashflow
- $768
Break-even live
UW: 25.0% down · 7.5% · 30yr · 1.5% tax · 5.0% vac · 8.0% maint · 8.0% mgmt
Financing live
Cash to close
- Down payment
- $14,125
- Closing costs
- $1,695
- Reserves months
- —
- Total cash needed
- —
Loan-product check · same deal, 3 products live
Conventional
25% down · 7.5% · 30yr
- Down + closing
- —
- Monthly P&I
- —
- Monthly cashflow
- —
- DSCR
- —
- Eligible?
- —
Personal DTI + credit; lowest rate.
DSCR
20% down · 8.5% · 30yr
- Down + closing
- —
- Monthly P&I
- —
- Monthly cashflow
- —
- DSCR
- —
- Eligible?
- —
No personal income docs; deal must DSCR.
Hard money
10% down · 12.0% · 12mo
- Down + closing
- —
- Monthly P&I
- —
- Monthly cashflow
- —
- DSCR
- —
- Eligible?
- —
Short-term bridge; refi at stabilization.
Listing history 2 events
-
2026-03-07status Pending
-
2026-02-04$56,500 Active
ⓘ Source: listings_history table (triggers on properties + properties_extension) + one-shot
backfill from property_details.listing_events for pre-trigger history.
Tax reassessment forecast TX · Resets to sale price
- Current annual tax
- $552 · $46/mo
- Projected year-2 tax
- $1,034 · $86/mo
- Expected delta
- +$482/yr (+$40/mo · 87.4%)
ⓘ Screening estimate from a state-policy table — verify with the county assessor before closing.
Nearby sold comps map
Loading sold comps map…
Walkable amenities ~0.75 mi
Loading nearby amenities…
Taxation est. · year 1
- Rental income
- $17,225
- − Mortgage interest
- −$3,165
- − Property taxes
- −$552
- − Insurance
- −$282
- − Repairs & maintenance
- −$1,378
- − Management
- −$1,378
- − Depreciation
- −$1,644
- Taxable income
- $8,826
- Est. tax owed @ 24.0%
- −$2,118
- After-tax cash flow
- $7,100/yr
For passive investors: Depreciation is non-cash, so a rental often shows a tax loss while cash-flowing — sheltering income. Rental losses are passive: they offset passive income freely, and up to $25,000/yr can offset ordinary (W-2) income if you actively participate and your MAGI is under $100k (phasing out to $0 by $150k); unused losses carry forward. On sale, claimed depreciation is recaptured at up to 25%, and gains may owe capital-gains tax (a 1031 exchange can defer both). Figures are a year-1 estimate at your 24.0% rate — not tax advice; consult a CPA.
Schools (NCES district)
- District
- Graham ISD
- NCES district ID
- 4821360
- Math proficiency
- 50% ▲ 7.00%
- Reading proficiency
- 42% ▲ 2.00%
- Median HH income
- $46,314
- Composite
- 39.16/100
- National rank
- #4030
- State rank
- #252 of 826 in TX
Livability — Loving
No livability data for this city. (Only ~50 U.S. cities are tracked.)
Census & demographics
- Population (ZIP)
- 12,890
Population outlook (Young County) Hauer SSP2
- Today (2025)
- 17,860 people
- By 2030
- 17,620 · -1.3%
- By 2040
- 17,054 · -4.5%
- By 2050
- 16,551 · -7.3%
- By 2075
- 15,667 · -12.3%
- By 2100
- 14,066 · -21.2%
Race, ethnicity, and origin ACS 2023
- Neighborhood character
- Predominantly White (74%)
- Race & ethnicity
- White 74% Hispanic / Latino 21% Two or more races 10% Black 2%
- Hispanic origin (detail)
- Mexican 16% Puerto Rican 3%
- Common ancestry
- Slovak 3% Italian 2% Serbian 1%
- Foreign-born
- 7% · Canada
- Languages at home
- 84% English-only · Spanish 15%
Political lean MEDSL · Young
- 2024 margin
- Solid R (+76.2) · D 11.6% · R 87.8%
- 2008→2024 swing
- -12.8pp toward R · 2008: -63.5pp · 2024: -76.2pp
- All cycles
- 2024: R+76.2 2020: R+73.8 2016: R+74.6 2012: R+71.5 2008: R+63.5
Not yet ingested
- Civics
- —
Market trends
- HPI YoY
- ▼ -62.82%
- Current HPI
- 198.6373
- Rent YoY
- —
- Metro
- —
- State GDP YoY
- ▲ 3.95%
- F500 in state
- 110
Industry mix (Fortune 500 HQ in TX)
| Industry | F500 HQs | Revenue |
|---|---|---|
| Energy | 16 | $1,198B |
|
||
| Technology | 5 | $198B |
|
||
| Engineering / Construction | 4 | $72B |
|
||
| Energy Services | 3 | $60B |
|
||
| Utilities | 3 | $41B |
|
||
| Healthcare | 2 | $330B |
|
||
Price history
2 events — show timeline
- 2026-03-07 Pending — NTREIS
- 2026-02-04 Listed $56,500 NTREIS
Cash-flow waterfall
monthlySold comps — $/sqft
last 12 mo · ≤1 miLoading sold comps…