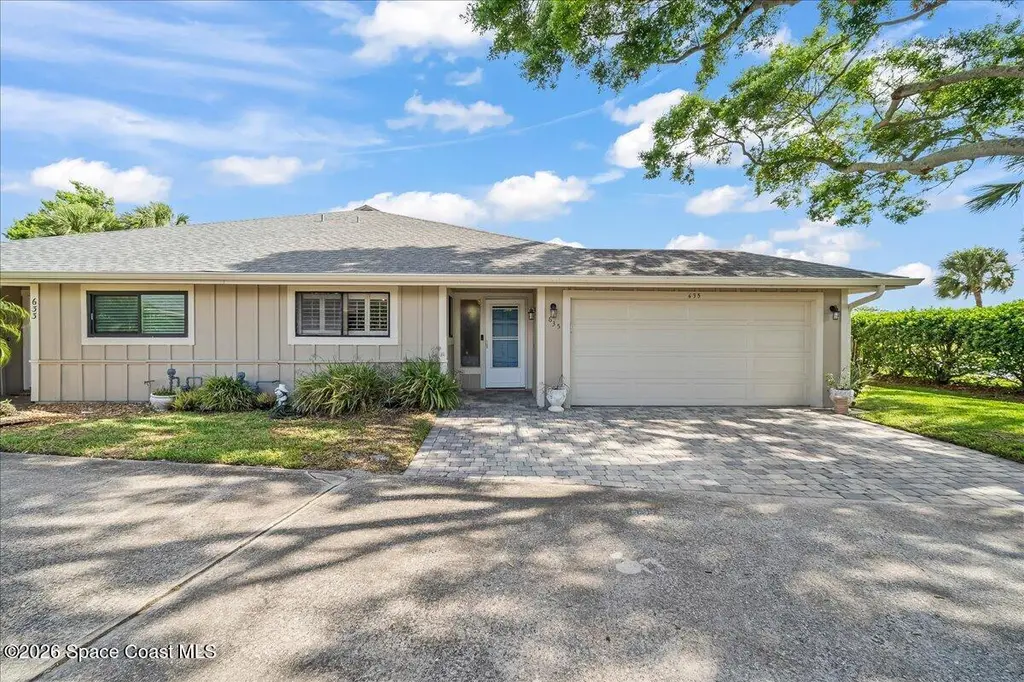
635 Jubilee St · Palm Shores, FL
Flood risk 1/10 · Minimal
- FEMA flood zone
- X (unshaded)
- Chance of flooding over 30 yrs
- 0.0%
- Est. flood insurance / yr
- $507 – $1,088
Fire risk 3/10 · Minor
- Est. fire insurance / yr
- $947 – $1,759
Heat risk 10/10 · Severe
- Hot days now (above 104°F)
- 7 days/yr
- Hot days in 30 yrs
- 23 days/yr
Wind risk 10/10 · Severe
- Chance of severe wind over 30 yrs
- 99.0%
Air-quality risk 1/10 · Minimal
- Unhealthy air days now
- 0 days/yr
- Unhealthy air days in 30 yrs
- 0 days/yr
Risk factors via First Street. Map © Google.
Why this score? — see what drove the D grade
The composite is a weighted blend of 9 inputs, each scored 0–100. Each bar is that input's sub-score; the figure is the points it added to the 100-point composite (weight × sub-score).
- Cash flow +9.4/30.0
- ARV discount +7.5/15.0
- Appreciation +5.2/10.0
- Schools +4.7/10.0
- Livability +3.9/5.0
- 1% rule +3.1/10.0
- Rent growth +3.0/5.0
- DSCR +2.6/10.0
- Condition / age +2.5/5.0
$290,000
🖨 Deal sheet (PDF) 📄 Offer letter ✓ Due diligence
Listing remarks
3 Bedroom, Single Story Townhouse w/ 2 Car Garage, under $300k? Yes! A RARE opportunity, as units rarely become available for sale in this Suntree community. Saint Andrews Townhomes is distinguished by mature oak trees, lush foliage, sidewalks throughout the community, welcoming golf cart access to the Suntree Challenger golf course and country club. This home is very convenient to the pool/amenity. Enjoy your private covered lanai and outdoor patio & yard which provide entertainment space for guests, quiet time sipping coffee or relaxation. The rare 3rd bedroom, and a full size 2 car garage makes this a complete home. UPDATES: New raised panel interior doors (coming soon), updated b
Key facts
- $286 HOA
- 2 garage spots
- Community pool
Property features AI
Finance
- Other: Living area: 1,346 (listed); Corner parcel additional parcel reference: 2603283; Taxes recorded for 2025
- Financial info: Residential use
- HOA & community: Association: ST Andrews Townhomes; Monthly HOA: $265 (includes trash); Annual HOA: $257.25; Association amenities: Grounds maintenance, Park
Exterior
- Parking: Attached garage; 2-car garage
- Utilities: Public sewer; Cable available; Electricity connected; Sewer connected
- Home design: Townhouse; Entry level: 1; Faces southwest; Attached property
- Construction: Frame construction; Wood siding
- Exterior features: Wood fencing; Corner lot
Interior
- Bedrooms: 3 bedrooms
- Flooring: Tile
- Bathrooms: 2 full bathrooms
- Heating & cooling: Central heating; Central electric air conditioning
- Interior features: Tile flooring
- Laundry & utility: Unfurnished unit
Neighborhood map
What this means for you Summary
Snapshot
- This is a 3-bed/2.0-bath townhouse listed at $290k.
Deal economics
- At list price, monthly cash flow is $-207 ($-2k/yr) — negative.
- To cash-flow at today's rent, offer at most $254k (12.6% below list).
- To meet the 1% rule (rent ≥ 1% of price), the offer needs to be $234k (19.3% below list).
- Recommended offer: $234k (19.3% below list) — sets the bar for 1% rule.
Location & tenants
- Location reads 78/100 on livability (#165 in FL, #2,467 nationally) — a middle-class / working-renter tenant base. Strengths: crime A+, employment A+, housing A+; Watch: amenities F, health & safety D-.
- Brevard (suburban): math 53% / reading 57% proficiency, ranked #19 of 73 in FL (top 26%) — acceptable for families but not a draw, mixed tenant base, ~2y average lease.
- Zoned schools: Suntree Elementary School (math 80% / reading 80%, grade A+, #110 of 2,144 statewide, top 5%, 600 students, 23% FRL); Delaura Middle School (math 74% / reading 70%, grade A, #52 of 571 statewide, top 10%, 843 students, 21% FRL); Viera High School (math 58% / reading 71%, grade B-, #78 of 667 statewide, top 13%, 2,289 students, 15% FRL) — zoned schools average 19% FRL vs 43% district-wide (23 pts lower); this property's tenant base skews higher-income than the district average.
- Zoned-school proficiency averages 72% at this address vs 55% district-wide (+17 pts) — the actual schools serving this property are materially stronger than the Brevard average implies; a family-tenant draw the district grade alone would hide.
- Market conditions: Rents rising (+2.0%/yr); 593 active listings in the ZIP; 9 comparable units currently listed for rent nearby; rentals at typical pace (median 26d on market — plan ~3-4 weeks tenant-placement turnaround); high-income renter base; 4,602 units permitted in Brevard County in 2024 (702 in 5+ unit buildings).
Forward outlook
- In year one you build about $3k of equity ($2k loan paydown + $1k appreciation (0.4% local appreciation)).
- Brevard County population projected at +15% by 2050 — modest demand growth; plan on rents tracking national, not racing it.
- By year 9, paydown + projected appreciation supports a ~$33k cash-out refi (75% LTV) — recoverable capital for the next deal without selling this one.
Negotiation context
- It's been on market 16 days — a 2% lower offer ($286k) is reasonable based on typical stale-listing flexibility.
- Current owner paid $92k; list at $290k implies a 217% gain — meaningful room to come down on a strong offer.
Risks & watch-outs
- Climate carrying-cost: severe wind risk, 99% chance of damaging wind over 30y; extreme-heat days projected 7→23/yr by 2055 (HVAC capex compounding) — expect insurance premiums to compound above CPI over the hold.
Questions for the listing agent
- What do current leases actually rent for vs. the listed asking? Can we see a recent rent roll and the last 12 months of T-12 income?
- What does the HOA fee cover, when was the last increase, and are there any pending special assessments or reserve-fund shortfalls?
- Is there a deadline driving the sale (1031 exchange, divorce, estate, relocation)? That informs how much negotiation room exists.
- Schools are B-rated — typically a magnet for longer-tenancy family renters. What's the average tenant stay here, and is there a school-zone premium baked into asking?
- The area grade is low — what's the realistic commute time and amenity access for the typical tenant pool here? Any planned neighborhood developments (good or bad) we should know about?
- What's the average days-on-market for RENTAL listings here right now (not sales)? A rising rental-DOM trend means longer vacancies and softer asking-rent achievability than the comps imply.
- What's the recent tenant-quality profile in this submarket — average credit score on applications, eviction rate, late-payment / NSF rate, and stable-employment percentage? A property-management company in the area should have these aggregated.
- How much new for-sale + rental construction is in the pipeline within 1–3 miles? Heavy new supply typically softens prices + rents 12–24 months out; constrained supply supports both.
Investment metrics
- 1% rule
- 0.81% ✗
- Cap rate
- 5.44%
- Cash-on-cash
- -3.05%
- DSCR
- 0.86
- GRM
- 10.3
CMA / ARV
No comps found within radius.
Projected returns pro-forma
0.4% appreciation · 1.96% rent growth · sell at horizon
- IRR
- -4.7%
- Equity multiple
- 0.77×
- Total profit
- $-18,459
- Equity at exit
- $90,101
- IRR
- 0.2%
- Equity multiple
- 1.02×
- Total profit
- $1,927
- Equity at exit
- $113,128
Cash invested: $81,200 (down + closing). Projections, not guarantees.
Landlord ↔ Tenant lean methodology
- Overall (STATE)
- 87 Strongly Landlord-Friendly
- State Florida
- 87 Strongly Landlord-Friendly · R+3
- County
- — inherits STATE
- City
- — inherits STATE
ZIP-level market 32940
- Home prices YoY
- 0.1%
- Rents YoY
- 2.0%
- Active inventory
- 593
- Price-to-rent
- 10.3×
Monthly cashflow live
- Estimated rent
- $2,341 high interval (Pro) →
- Mortgage (P&I)
- −$1,521
- Tax from tax record
- −$128 /mo · $1,537/yr
- Insurance
- −$121
- HOA
- −$286
- Lot rent
- −$0
- Vacancy / Maint / Mgmt
- −$492
- Net cashflow
- $-207
Break-even live
Sensitivity live
| Price | -10% $-42 | -5% $-125 | +0% $-207 | +5% $-289 | +10% $-371 |
|---|---|---|---|---|---|
| Rent | -10% $-392 | -5% $-299 | +0% $-207 | +5% $-114 | +10% $-22 |
| Rate | -1.0pp $-61 | -0.5pp $-133 | base $-207 | +0.5pp $-282 | +1.0pp $-358 |
UW: 25.0% down · 7.5% · 30yr · 1.5% tax · 5.0% vac · 8.0% maint · 8.0% mgmt
Financing live
Cash to close
- Down payment
- $72,500
- Closing costs
- $8,700
- Reserves months
- —
- Total cash needed
- —
Loan-product check · same deal, 3 products live
Conventional
25% down · 7.5% · 30yr
- Down + closing
- —
- Monthly P&I
- —
- Monthly cashflow
- —
- DSCR
- —
- Eligible?
- —
Personal DTI + credit; lowest rate.
DSCR
20% down · 8.5% · 30yr
- Down + closing
- —
- Monthly P&I
- —
- Monthly cashflow
- —
- DSCR
- —
- Eligible?
- —
No personal income docs; deal must DSCR.
Hard money
10% down · 12.0% · 12mo
- Down + closing
- —
- Monthly P&I
- —
- Monthly cashflow
- —
- DSCR
- —
- Eligible?
- —
Short-term bridge; refi at stabilization.
Rent comps 9 comps
| Address | Beds | Baths | Sqft | Rent | $/sqft | DOM | Units | Dist |
|---|---|---|---|---|---|---|---|---|
| 216 Country Club Dr Melbourne, FL | 3.0 | 2.0 | 1749 | $2,295 | $1.31 | 23d | 1 | 0.66mi |
| 2705 Bosque Cir Melbourne, FL | 1.0–3.0 | 1.0–2.0 | 1044 | $2,375 | $2.27 | 16d | 18 | 0.76mi |
| 2745 Bosque Cir Unit 307 Melbourne, FL | 3.0 | 2.0 | 1305 | $2,245 | $1.72 | 25d | 1 | 0.79mi |
| 2750 Bosque Cir Unit 304 Melbourne, FL | 2.0 | 2.0 | 1046 | $1,825 | $1.74 | 25d | 1 | 0.83mi |
| 2760 Bosque Cir Unit 307 Melbourne, FL | 3.0 | 2.0 | 1305 | $2,225 | $1.70 | 25d | 1 | 0.88mi |
| 201 Plantation Club Dr Melbourne, FL | 1.0–2.0 | 1.0–2.0 | 1025 | $1,870 | $1.82 | 16d | 10 | 1.01mi |
| 7667 N Wickham Rd Melbourne, FL | 1.0–2.0 | 1.0–2.0 | 915 | $1,750 | $1.91 | 16d | 2 | 1.16mi |
| 640 Casa Grande Dr Melbourne, FL | 3.0 | 2.0 | 1160 | $2,200 | $1.90 | 25d | 1 | 1.47mi |
| 300 Tuscany Way Melbourne, FL | 1.0–3.0 | 1.0–2.0 | 1097 | $2,269 | $2.07 | 25d | 12 | 1.47mi |
HOA detail
- Monthly dues
- $286 · $3,432/yr
- Likely covers
- pool
Listing history 8 events
-
2026-05-09status Pending
-
2026-04-27historical Active Under Contract
-
2026-04-23$290,000 Active
-
2026-04-20historical $290,000
-
1997-04-08soldstatus $91,500
-
1992-08-30soldstatus $105,000
-
1992-06-01soldstatus $105,000
-
1985-05-01soldstatus $89,500
ⓘ Source: listings_history table (triggers on properties + properties_extension) + one-shot
backfill from property_details.listing_events for pre-trigger history.
Tax reassessment forecast FL · Resets to sale price
- Current annual tax
- $1,537 · $128/mo
- Projected year-2 tax
- $2,407 · $201/mo
- Expected delta
- +$870/yr (+$72/mo · 56.6%)
ⓘ Screening estimate from a state-policy table — verify with the county assessor before closing.
Climate risk First Street
- Flood 1/10 Low FEMA zone X (unshaded) · 0% chance over 30 yrs
- Wildfire 3/10 Moderate
- Heat 10/10 Extreme 7 d/yr ≥104°F today · 23 d/yr by 30 yrs out
- Wind 10/10 Extreme 99% chance of damaging wind over 30 yrs
- Air quality 1/10 Low 0 unhealthy d/yr today · 0 by 30 yrs out
Nearby sold comps map
Loading sold comps map…
Walkable amenities ~0.75 mi
Loading nearby amenities…
Taxation est. · year 1
- Rental income
- $28,088
- − Mortgage interest
- −$16,245
- − Property taxes
- −$1,537
- − Insurance
- −$1,450
- − Repairs & maintenance
- −$2,247
- − Management
- −$2,247
- − HOA
- −$3,432
- − Depreciation
- −$8,436
- Taxable loss
- −$7,506
- Est. tax savings @ 24.0%
- +$1,801
- After-tax cash flow
- $-678/yr
For passive investors: Depreciation is non-cash, so a rental often shows a tax loss while cash-flowing — sheltering income. Rental losses are passive: they offset passive income freely, and up to $25,000/yr can offset ordinary (W-2) income if you actively participate and your MAGI is under $100k (phasing out to $0 by $150k); unused losses carry forward. On sale, claimed depreciation is recaptured at up to 25%, and gains may owe capital-gains tax (a 1031 exchange can defer both). Figures are a year-1 estimate at your 24.0% rate — not tax advice; consult a CPA.
Schools (NCES district)
- District
- Brevard
- NCES district ID
- 1200150
- Math proficiency
- 53% ▼ -9.00%
- Reading proficiency
- 57% ▼ -4.00%
- Median HH income
- $49,426
- Composite
- 46.86/100
- National rank
- #2370
- State rank
- #19 of 73 in FL
Livability — Palm Shores
- Score
- 78/100
- State rank
- #165
- US rank
- #2467
Category grades
Schools grade is shown separately in the Schools card above.
Census & demographics
- County
- Brevard County · 602,871 people
- Metro
- Palm Bay-Melbourne-Titusville, FL
- Population (ZIP)
- 51,727
- Household income
- $110,495
- Rent vs Own
- Severe rent burden
- 873.0
Population outlook (Brevard County) Hauer SSP2
- Today (2025)
- 623,254 people
- By 2030
- 648,420 · +4.0%
- By 2040
- 690,009 · +10.7%
- By 2050
- 715,669 · +14.8%
- By 2075
- 775,744 · +24.5%
- By 2100
- 776,687 · +24.6%
Race, ethnicity, and origin ACS 2023
- Neighborhood character
- Predominantly White (77%)
- Race & ethnicity
- White 77% Hispanic / Latino 10% Two or more races 9% Asian 5% Black 3%
- Hispanic origin (detail)
- Mexican 1% Puerto Rican 3% Cuban 1%
- Common ancestry
- Romanian 4% Lithuanian 3% Slovak 2%
- Foreign-born
- 11% · Canada, Jamaica, China
- Languages at home
- 88% English-only · Spanish 6% Other Indo-European 2% German/W. Germanic 1%
Political lean MEDSL · Brevard
- 2024 margin
- Strong R (+20.8) · D 39.1% · R 59.9% · Other 1.0%
- 2008→2024 swing
- -10.4pp toward R · 2008: -10.4pp · 2024: -20.8pp
- All cycles
- 2024: R+20.8 2020: R+16.4 2016: R+19.8 2012: R+12.7 2008: R+10.4
Not yet ingested
- Civics
- —
Market trends
- HPI YoY
- ▲ 0.40%
- Current HPI
- 298.1023
- Rent YoY
- ▲ 1.96%
- Metro
- Palm Bay-Melbourne-Titusville, FL
- State GDP YoY
- ▲ 3.28%
- F500 in state
- 36
Industry mix (Fortune 500 HQ in FL)
| Industry | F500 HQs | Revenue |
|---|---|---|
| Industrial Technology | 2 | $29B |
|
||
| Insurance | 2 | $17B |
|
||
| Retail | 1 | $60B |
|
||
| Technology Distribution | 1 | $58B |
|
||
| Homebuilding | 1 | $35B |
|
||
| Technology Manufacturing | 1 | $35B |
|
||
Price history
+224.0% since first listed8 events — show timeline
- 2026-05-09 Pending — SCMLS
- 2026-04-27 Contingent — SCMLS
- 2026-04-23 Listed $290,000 SCMLS
- 2026-04-20 Coming Soon $290,000 SCMLS
- 1997-04-08 Sold (Public Records) $91,500 Public Records
- 1992-08-30 Sold (Public Records) $105,000 Public Records
- 1992-06-01 Sold (Public Records) $105,000 Public Records
- 1985-05-01 Sold (Public Records) $89,500 Public Records
Property tax history
+3.8%/yrLatest (2025): $1,537 · +9.4% YoY. Source: county tax records.
Cash-flow waterfall
monthlySold comps — $/sqft
last 12 mo · ≤1 miLoading sold comps…