229 W Tower · Ada, OK
Flood risk 1/10 · Minimal
- FEMA flood zone
- X (unshaded)
- Chance of flooding over 30 yrs
- 0.0%
- Est. flood insurance / yr
- $507 – $1,088
Fire risk 8/10 · Major
- Est. fire insurance / yr
- $2,463 – $4,575
Heat risk 5/10 · Moderate
- Hot days now (above 109°F)
- 7 days/yr
- Hot days in 30 yrs
- 19 days/yr
Wind risk 4/10 · Minor
- Chance of severe wind over 30 yrs
- 11.0%
Air-quality risk 2/10 · Minimal
- Unhealthy air days now
- 1 days/yr
- Unhealthy air days in 30 yrs
- 1 days/yr
Risk factors via First Street. Map © Google.
Why this score? — see what drove the C+ grade
The composite is a weighted blend of 9 inputs, each scored 0–100. Each bar is that input's sub-score; the figure is the points it added to the 100-point composite (weight × sub-score).
- Cash flow +30.0/30.0
- DSCR +10.0/10.0
- 1% rule +9.0/10.0
- Rent growth +3.7/5.0
- Livability +3.5/5.0
- ARV discount +3.0/15.0
- Schools +3.0/10.0
- Condition / age +2.5/5.0
- Appreciation +0.0/10.0
$65,000
🖨 Deal sheet 📄 Offer letter ✓ Due diligence
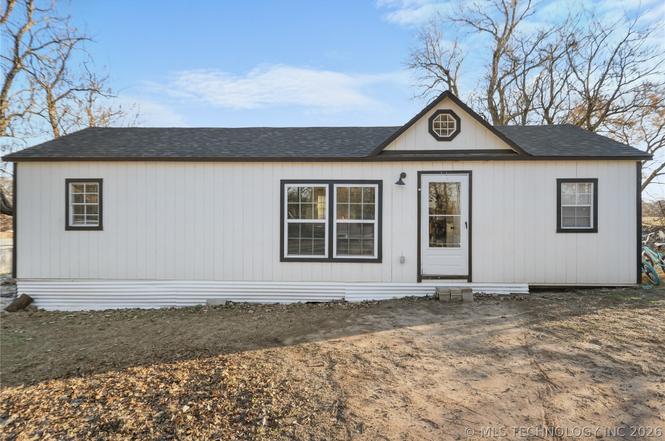
Listing remarks
MOTIVATED SELLER! — PRICED $25,000+ UNDER APPRAISED VALUE! Efficient 2-bedroom, 1-bath home built in 2022. Situated on two parcels near the edge of town, this property brings a private feel with plenty of future potential. With a few finishing touches, it is ready to be transformed into your next starter home or long-term investment. Featuring a storage shed and a recently installed underground storm shelter for added functionality and Oklahoma peace of mind. The additional rear parcel offers flexibility for future use or expansion. Opportunities like this don’t come around often — schedule your showing today! PROPERTY BEING SOLD AS-IS.
Key facts
- Storage shed
- 0.36 acre lot
- Built 2022
Tags
Property features AI
Exterior
- Parking: Gravel driveway parking
- Security: Storm shelter
- Utilities: Electricity available; Natural gas available; Public water; Public sewer
- Home design: Single-story; Faces north
- Construction: Vinyl siding; Wood frame construction; Asphalt/fiberglass roof; Crawlspace foundation; Built per public records
- Exterior features: Gravel driveway; Mature trees; Chain link (partial) fence; Storage structure; Storm shelter
Interior
- Kitchen: Cooktop; Oven; Range; Refrigerator
- Flooring: Carpet; Laminate
- Bathrooms: 1 full bathroom
- Heating & cooling: Ductless cooling (two units); Ductless electric heating (multiple units)
- Interior features: Vinyl windows; Insulated doors; Laminate counters; Crawl space basement
- Laundry & utility: Washer hookup; Electric dryer hookup; Electric water heater
Neighborhood map
What this means for you Summary
Snapshot
- This is a 1-bed/1.0-bath manufactured listed at $65k.
Deal economics
- At list price, monthly cash flow is $296 ($4k/yr) — positive.
- The deal already cash-flows at list — no discount required.
- Meets the 1% rule at list price ($907 rent vs $65k).
- Recommended offer: $61k (6.0% below list) — sets the bar for market timing.
- Cap rate 11.8% vs local median 4.0% in Ada — top-decile yield for the area; either an underpriced asset or a hidden risk that comps aren't pricing in. Stress-test before assuming the spread holds.
Location & tenants
- Location reads 70/100 on livability (#41 in OK) — a middle-class / working-renter tenant base. Strengths: cost of living A+, housing A+, health & safety A; Watch: schools D, employment D, crime D-.
- Byng (rural): math 35% / reading 35% proficiency, ranked #32 of 270 in OK (top 12%) — families likely to look elsewhere, expect single-tenant / working-renter base with shorter leases.
- Market conditions: Rents rising fast (+4.8%/yr); 305 active listings in the ZIP; 2 units permitted in Pontotoc County in 2024 (0 in 5+ unit buildings).
- This rent is only 17% of the median local income ($62k/yr) — well below the 30% rent-burden line; pricing power to push rent on renewal without tenant pushback.
Forward outlook
- Local home prices are declining (-3.0%/yr); year-one equity from $449 of loan paydown is wiped out by about $2k of value loss. Plan a longer hold.
- Pontotoc County population projected at +7% by 2050 — modest demand growth; plan on rents tracking national, not racing it.
- At projected returns (-3.0% appreciation + 4.8% rent growth), your $18k cash investment doubles in ~6 years — after that, you're playing with house money.
Negotiation context
- It's been on market 70 days — a 6% lower offer ($61k) is reasonable based on typical stale-listing flexibility.
- 2 sale attempts since 2y ago; this cycle's ask has dropped $25k (28%) from the opening price — seller is motivated, your offer sets the floor, not the list.
Risks & watch-outs
- Climate carrying-cost: severe wildfire risk; extreme-heat days projected 7→19/yr by 2055 (HVAC capex compounding) — expect insurance premiums to compound above CPI over the hold.
Questions for the listing agent
- It's been on market 70 days. Have you received any prior offers? Is the seller open to a 6% concession, seller financing, or rate buy-down credit?
- Why hasn't it sold? Are there any deal-killer items the seller is aware of (foundation, flood, title, zoning, code violations)?
- Is there a deadline driving the sale (1031 exchange, divorce, estate, relocation)? That informs how much negotiation room exists.
- Schools are D-rated, which usually means shorter tenancies and higher turnover. Who's the typical renter profile here, and what's been the actual vacancy rate?
- Crime grade is D in this area — have there been break-ins, vandalism, or insurance claims at this property in the last 3 years? What carrier currently insures it and at what premium?
- What's the average days-on-market for RENTAL listings here right now (not sales)? A rising rental-DOM trend means longer vacancies and softer asking-rent achievability than the comps imply.
- What's the recent tenant-quality profile in this submarket — average credit score on applications, eviction rate, late-payment / NSF rate, and stable-employment percentage? A property-management company in the area should have these aggregated.
- How much new for-sale + rental construction is in the pipeline within 1–3 miles? Heavy new supply typically softens prices + rents 12–24 months out; constrained supply supports both.
Investment metrics
- 1% rule
- 1.40% ✓
- Cap rate
- 11.75%
- Cash-on-cash
- 19.50%
- DSCR
- 1.87
- GRM
- 6.0
CMA / ARV
- ARV (on-the-fly)
- $59,136
- Comps found
- 1
Show comp detail 1 sale within ~0.75 mi
| Address | Dist | Beds/Ba | Sqft | Sold | Price | $/sf | Match |
|---|---|---|---|---|---|---|---|
| 229 W Tower | 0.00mi | 2/1.0 (+1) | 684 (+2%) | 1mo | $60,000 | $88 | 91 |
Match score weights: distance 35% · size 25% · config 20% · recency 20%. Top-matched comps best support the ARV.
Projected returns pro-forma
-3.0% appreciation · 4.83% rent growth · sell at horizon
- IRR
- 13.5%
- Equity multiple
- 1.55×
- Total profit
- $10,005
- Equity at exit
- $9,692
- IRR
- 23.6%
- Equity multiple
- 3.21×
- Total profit
- $40,202
- Equity at exit
- $5,620
Cash invested: $18,200 (down + closing). Projections, not guarantees.
Landlord ↔ Tenant lean methodology
- Overall (STATE)
- 83 Strongly Landlord-Friendly
- State Oklahoma
- 83 Strongly Landlord-Friendly · R+20
- County
- — inherits STATE
- City
- — inherits STATE
ZIP-level market 74820
- Home prices YoY
- -11.5%
- Rents YoY
- 4.8%
- Active inventory
- 305
- Price-to-rent
- 6.0×
Monthly cashflow live
- Estimated rent
- $907 medium interval (Pro) →
- Mortgage (P&I)
- −$341
- Tax from tax record
- −$53 /mo · $634/yr
- Insurance
- −$27
- HOA
- −$0
- Vacancy / Maint / Mgmt
- −$190
- Net cashflow
- $296
Break-even live
UW: 25.0% down · 7.5% · 30yr · 1.5% tax · 5.0% vac · 8.0% maint · 8.0% mgmt
Financing live
Cash to close
- Down payment
- $16,250
- Closing costs
- $1,950
- Reserves months
- —
- Total cash needed
- —
Loan-product check · same deal, 3 products live
Conventional
25% down · 7.5% · 30yr
- Down + closing
- —
- Monthly P&I
- —
- Monthly cashflow
- —
- DSCR
- —
- Eligible?
- —
Personal DTI + credit; lowest rate.
DSCR
20% down · 8.5% · 30yr
- Down + closing
- —
- Monthly P&I
- —
- Monthly cashflow
- —
- DSCR
- —
- Eligible?
- —
No personal income docs; deal must DSCR.
Hard money
10% down · 12.0% · 12mo
- Down + closing
- —
- Monthly P&I
- —
- Monthly cashflow
- —
- DSCR
- —
- Eligible?
- —
Short-term bridge; refi at stabilization.
Listing history 11 events
-
2026-05-01status Pending
-
2026-04-28price $65,000
-
2026-04-22price $69,900
-
2026-04-14price $75,000
-
2026-04-05price $80,000
-
2026-03-30price $85,900
-
2026-03-17price $87,500
-
2026-02-20$90,000 Active
-
2024-08-01status Pending
-
2024-08-01historical
-
2024-07-22$90,000 Active
ⓘ Source: listings_history table (triggers on properties + properties_extension) + one-shot
backfill from property_details.listing_events for pre-trigger history.
Tax reassessment forecast OK · Resets to sale price
- Current annual tax
- $634 · $53/mo
- Projected year-2 tax
- $634 · $53/mo
- Expected delta
- $0/yr ($0/mo · 0.0%)
ⓘ Screening estimate from a state-policy table — verify with the county assessor before closing.
Climate risk First Street
- Flood 1/10 Low FEMA zone X (unshaded) · 0% chance over 30 yrs
- Wildfire 8/10 Severe
- Heat 5/10 Major 7 d/yr ≥109°F today · 19 d/yr by 30 yrs out
- Wind 4/10 Moderate 11% chance of damaging wind over 30 yrs
- Air quality 2/10 Low 1 unhealthy d/yr today · 1 by 30 yrs out
Nearby sold comps map
Loading sold comps map…
Walkable amenities ~0.75 mi
Loading nearby amenities…
Taxation est. · year 1
- Rental income
- $10,885
- − Mortgage interest
- −$3,641
- − Property taxes
- −$634
- − Insurance
- −$325
- − Repairs & maintenance
- −$871
- − Management
- −$871
- − Depreciation
- −$1,891
- Taxable income
- $2,653
- Est. tax owed @ 24.0%
- −$637
- After-tax cash flow
- $2,913/yr
For passive investors: Depreciation is non-cash, so a rental often shows a tax loss while cash-flowing — sheltering income. Rental losses are passive: they offset passive income freely, and up to $25,000/yr can offset ordinary (W-2) income if you actively participate and your MAGI is under $100k (phasing out to $0 by $150k); unused losses carry forward. On sale, claimed depreciation is recaptured at up to 25%, and gains may owe capital-gains tax (a 1031 exchange can defer both). Figures are a year-1 estimate at your 24.0% rate — not tax advice; consult a CPA.
Schools (NCES district)
- District
- Byng
- NCES district ID
- 4006060
- Math proficiency
- 35% ▼ -7.00%
- Reading proficiency
- 35% ▼ -10.00%
- Median HH income
- $49,993
- Composite
- 30.36/100
- National rank
- #6258
- State rank
- #32 of 270 in OK
Livability — Ada
- Score
- 70/100
- State rank
- #41
- US rank
- #7835
Category grades
Schools grade is shown separately in the Schools card above.
Census & demographics
- Census place
- Ada, OK
- County
- Pontotoc County · 31,943 people
- City population
- 31,943
- Metro
- Ada, OK
- Population (ZIP)
- 31,943
- Household income
- $62,357
- Rent vs Own
- Severe rent burden
- 774.0
Population outlook (Pontotoc County) Hauer SSP2
- Today (2025)
- 39,521 people
- By 2030
- 40,140 · +1.6%
- By 2040
- 41,242 · +4.4%
- By 2050
- 42,293 · +7.0%
- By 2075
- 44,678 · +13.0%
- By 2100
- 46,015 · +16.4%
Race, ethnicity, and origin ACS 2023
- Neighborhood character
- Diverse neighborhood (Simpson 0.61)
- Race & ethnicity
- White 62% Native American 19% Two or more races 13% Hispanic / Latino 7% Black 3% Asian 1%
- Hispanic origin (detail)
- Mexican 6%
- Common ancestry
- Slovak 3% Lithuanian 2% Italian 1%
- Foreign-born
- 2% · Canada
- Languages at home
- 96% English-only · Spanish 2%
Political lean MEDSL · Pontotoc
- 2024 margin
- Solid R (+46.6) · D 25.7% · R 72.3% · Other 2.1%
- 2008→2024 swing
- -9.9pp toward R · 2008: -36.7pp · 2024: -46.6pp
- All cycles
- 2024: R+46.6 2020: R+43.7 2016: R+45.8 2012: R+38.8 2008: R+36.7
Not yet ingested
- Civics
- —
Market trends
- HPI YoY
- ▼ -32.45%
- Current HPI
- 250.7685
- Rent YoY
- ▲ 4.83%
- Metro
- Ada, OK
- State GDP YoY
- ▲ 1.55%
- F500 in state
- 6
Industry mix (Fortune 500 HQ in OK)
| Industry | F500 HQs | Revenue |
|---|---|---|
| Energy | 3 | $48B |
|
||
Price history
-27.8% since first listed11 events — show timeline
- 2026-05-01 Pending — MLS Technology, Inc.
- 2026-04-28 Price Changed $65,000 MLS Technology, Inc.
- 2026-04-22 Price Changed $69,900 MLS Technology, Inc.
- 2026-04-14 Price Changed $75,000 MLS Technology, Inc.
- 2026-04-05 Price Changed $80,000 MLS Technology, Inc.
- 2026-03-30 Price Changed $85,900 MLS Technology, Inc.
- 2026-03-17 Price Changed $87,500 MLS Technology, Inc.
- 2026-02-20 Listed $90,000 MLS Technology, Inc.
- 2024-08-01 Pending — MLS Technology, Inc.
- 2024-08-01 Listing Removed — MLS Technology, Inc.
- 2024-07-22 Listed $90,000 MLS Technology, Inc.
Property tax history
+140.3%/yrLatest (2025): $634 · +3.3% YoY. Source: county tax records.
Cash-flow waterfall
monthlySold comps — $/sqft
last 12 mo · ≤1 miLoading sold comps…