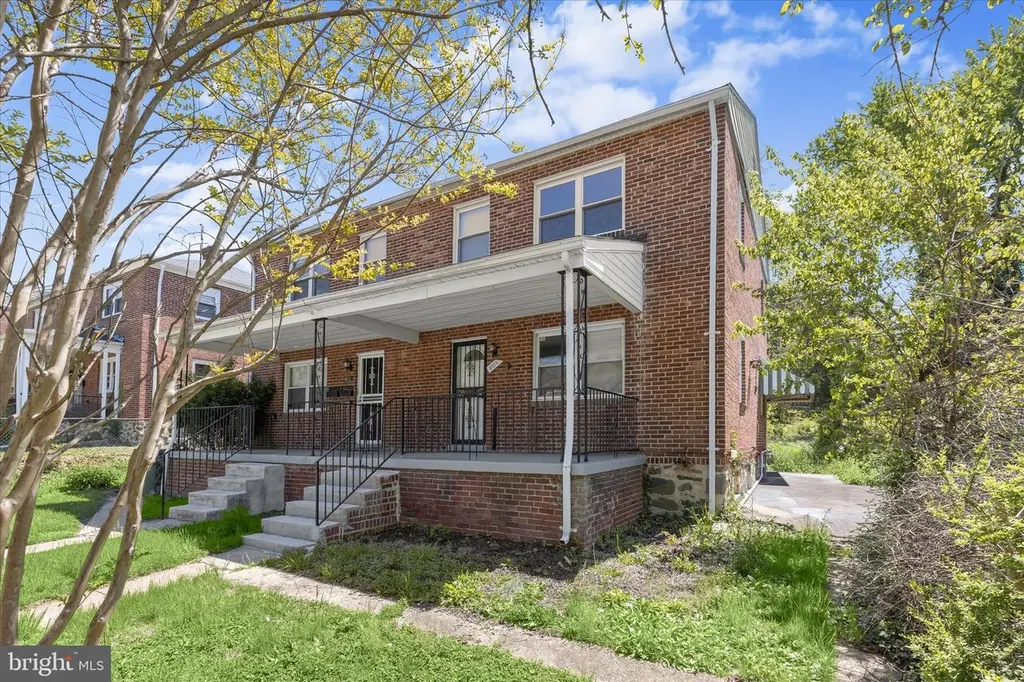
4015 Duvall Ave · Baltimore, MD
Flood risk 4/10 · Minor
- FEMA flood zone
- X (unshaded)
- Chance of flooding over 30 yrs
- 0.24%
- Est. flood insurance / yr
- $473 – $860
Fire risk 1/10 · Minimal
- Est. fire insurance / yr
- $755 – $1,403
Heat risk 6/10 · Moderate
- Hot days now (above 103°F)
- 7 days/yr
- Hot days in 30 yrs
- 15 days/yr
Wind risk 5/10 · Moderate
- Chance of severe wind over 30 yrs
- 26.0%
Air-quality risk 3/10 · Minor
- Unhealthy air days now
- 3 days/yr
- Unhealthy air days in 30 yrs
- 4 days/yr
Risk factors via First Street. Map © Google.
Why this score? — see what drove the D grade
The composite is a weighted blend of 9 inputs, each scored 0–100. Each bar is that input's sub-score; the figure is the points it added to the 100-point composite (weight × sub-score).
- ARV discount +12.5/15.0
- Cash flow +12.2/30.0
- Rent growth +4.0/5.0
- Livability +3.8/5.0
- 1% rule +3.7/10.0
- DSCR +3.6/10.0
- Condition / age +2.5/5.0
- Schools +1.0/10.0
- Appreciation +0.0/10.0
$225,000
🖨 Deal sheet (PDF) 📄 Offer letter ✓ Due diligence
Listing remarks MLS
Beautifully updated semi-detached home featuring modern-day style & amenities! 3 fully-finished levels give you all the space you need! Open floorplan with hardwood floors & tons of natural light make this one not to be missed. Enjoy bright and spacious kitchen with breakfast bar & dining room. All this plus spacious lower level family room & spacious backyard - perfect for family fun! Must see!
Key facts
- Ample cabinetry
- Updated flooring
- Granite countertops
Tags
Property features AI
Exterior
- Parking: On-street parking
- Utilities: Public water; Public sewer; Natural gas hot water; Natural gas heating; Electric for cooling
- Home design: Semi-detached property; Entry level bedroom
- Construction: Combination of brick and aluminum siding; Asphalt roof; Block foundation; Windows: double pane, double hung, vinyl clad with screens; Major remodel/effective year 2025
- Exterior features: Exterior lighting; Sidewalks; Street lights; Landscaping
Interior
- Kitchen: Built-in microwave; Dishwasher; Disposal; Self-cleaning oven; Electric range; Refrigerator; Stainless steel appliances; Freezer
- Bedrooms: One bedroom on the main level; Three bedrooms on the upper level
- Flooring: Hardwood floors
- Bathrooms: Two full bathrooms; One half bathroom on a lower level
- Heating & cooling: Forced air heating (natural gas); Central air conditioning; Ceiling fans; Electric cooling
- Interior features: Ceiling fans; Traditional floor plan; Formal separate dining room; Recessed lighting; Upgraded countertops; Tub/shower; Drywall walls and high ceilings; Wood floors
- Laundry & utility: Washer and dryer included; Laundry room on lower floor; Water heater
Neighborhood map
What this means for you Summary
Snapshot
- This is a 4-bed/2.5-bath townhouse listed at $225k.
Deal economics
- At list price, monthly cash flow is $-45 ($-541/yr) — negative.
- To cash-flow at today's rent, offer at most $217k (3.5% below list).
- To meet the 1% rule (rent ≥ 1% of price), the offer needs to be $197k (12.6% below list).
- Recommended offer: $197k (12.6% below list) — sets the bar for 1% rule.
Location & tenants
- Location reads 76/100 on livability (#90 in MD, #3,396 nationally) — a middle-class / working-renter tenant base. Strengths: amenities A+, commute A+, housing A+; Watch: crime F.
- Baltimore City Public Schools (urban): math 7% / reading 16% proficiency, ranked #24 of 24 in MD (top 100%) — low school quality limits family demand, transient renter base, plan for 1-2y turnover; 79% free/reduced lunch — lower-income household profile, screen leases tightly.
- Zoned schools: Elmer A. Henderson: A Johns Hopkins Partnership (math 2% / reading 16%, grade F, #650 of 860 statewide, top 77%, 642 students, 80% FRL); Baltimore Polytechnic Institute (math 71% / reading 84%, grade A-, #22 of 222 statewide, top 10%, 1,555 students, 43% FRL) — zoned schools average 62% FRL vs 79% district-wide (17 pts lower); this property's tenant base skews higher-income than the district average.
- Zoned-school proficiency averages 43% at this address vs 12% district-wide (+32 pts) — the actual schools serving this property are materially stronger than the Baltimore City Public Schools average implies; a family-tenant draw the district grade alone would hide.
- Market conditions: Rents rising fast (+6.1%/yr); 252 active listings in the ZIP; 29 comparable units currently listed for rent nearby; rentals at typical pace (median 26d on market — plan ~3-4 weeks tenant-placement turnaround); 48% of comp listings sitting > 30 days — soft ceiling on asking rent; lower-income renter base — watch delinquency; 1,273 units permitted in Baltimore city in 2024 (1,104 in 5+ unit buildings).
- At $1,967/mo this rent would consume 56% of the median local household income ($42k/yr) (locally 2264% of renters already pay >50% of income on rent) — very limited rent-growth headroom before tenants either downsize or default.
Forward outlook
- Local home prices are declining (-3.0%/yr); year-one equity from $2k of loan paydown is wiped out by about $7k of value loss. Plan a longer hold.
- Baltimore County population projected to shrink 4% by 2050 — rents likely to lag national; underwrite the cash flow, not the appreciation.
Negotiation context
- It's been on market 19 days — a 2% lower offer ($222k) is reasonable based on typical stale-listing flexibility.
- 16 sale attempts since 29y ago; this cycle's ask is 9084% above the opening price — seller raised mid-cycle; expect resistance to lowballs.
Risks & watch-outs
- Watch-outs: built in 1950 — expect roof / HVAC / electrical / plumbing capex.
- Climate carrying-cost: moderate wind risk, 26% chance of damaging wind over 30y; extreme-heat days projected 7→15/yr by 2055 (HVAC capex compounding) — expect insurance premiums to compound above CPI over the hold.
Questions for the listing agent
- What do current leases actually rent for vs. the listed asking? Can we see a recent rent roll and the last 12 months of T-12 income?
- Built in 1950 — when were the roof, HVAC, electrical panel, plumbing, and water heater last replaced?
- Is there a deadline driving the sale (1031 exchange, divorce, estate, relocation)? That informs how much negotiation room exists.
- Schools are D-rated, which usually means shorter tenancies and higher turnover. Who's the typical renter profile here, and what's been the actual vacancy rate?
- Crime grade is F in this area — have there been break-ins, vandalism, or insurance claims at this property in the last 3 years? What carrier currently insures it and at what premium?
- The area grade is low — what's the realistic commute time and amenity access for the typical tenant pool here? Any planned neighborhood developments (good or bad) we should know about?
- What's the average days-on-market for RENTAL listings here right now (not sales)? A rising rental-DOM trend means longer vacancies and softer asking-rent achievability than the comps imply.
- What's the recent tenant-quality profile in this submarket — average credit score on applications, eviction rate, late-payment / NSF rate, and stable-employment percentage? A property-management company in the area should have these aggregated.
- How much new for-sale + rental construction is in the pipeline within 1–3 miles? Heavy new supply typically softens prices + rents 12–24 months out; constrained supply supports both.
Investment metrics
- 1% rule
- 0.87% ✗
- Cap rate
- 6.05%
- Cash-on-cash
- -0.86%
- DSCR
- 0.96
- GRM
- 9.5
CMA / ARV
- ARV (median comp)
- $253,182
- List price
- $225,000
- Delta
- -11.13%
- Verdict
- UNDERPRICED
- Comps
- 20 within 1.0 mi
Show comp detail 12 sales within ~0.75 mi
| Address | Dist | Beds/Ba | Sqft | Sold | Price | $/sf | Match |
|---|---|---|---|---|---|---|---|
| 4119 Fairview Ave | 0.27mi | 4/2.0 | 1,340 (-3%) | 3mo | $235,000 | $175 | 79 |
| 4145 Fairfax Rd | 0.13mi | 4/2.0 | 1,260 (-8%) | 5mo | $230,500 | $183 | 74 |
| 4222 Bonner Rd | 0.24mi | 3/1.5 (-1) | 1,380 (+0%) | 9mo | $155,000 | $112 | 72 |
| 4002 Woodhaven Ave | 0.23mi | 4/3.5 | 1,354 (-2%) | 13mo | $268,000 | $198 | 71 |
| 3929 Duvall Ave | 0.09mi | 3/2.5 (-1) | 1,248 (-9%) | 6mo | $270,000 | $216 | 70 |
| 4110 Fairview Ave | 0.31mi | 3/1.5 (-1) | 1,464 (+6%) | 1mo | $150,000 | $102 | 65 |
| 2914 Chelsea Ter | 0.29mi | 3/2.0 (-1) | 1,327 (-4%) | 14mo | $258,000 | $194 | 62 |
| 4010 Woodhaven Ave | 0.22mi | 4/1.5 | 1,474 (+7%) | 14mo | $135,000 | $92 | 62 |
| 4008 Bonner Rd | 0.28mi | 3/2.0 (-1) | 1,564 (+14%) | 5mo | $145,000 | $93 | 53 |
| 3409 Mondawmin Ave | 0.66mi | 4/3.5 | 1,400 (+2%) | 12mo | $249,500 | $178 | 52 |
| 3816 Bonner Rd | 0.39mi | 4/3.0 | 1,554 (+13%) | 13mo | $259,500 | $167 | 47 |
| 4120 Norfolk Ave | 0.36mi | 3/1.0 (-1) | 1,216 (-12%) | 14mo | $60,800 | $50 | 41 |
Match score weights: distance 35% · size 25% · config 20% · recency 20%. Top-matched comps best support the ARV.
Projected returns pro-forma
-3.0% appreciation · 6.1% rent growth · sell at horizon
- IRR
- -14.2%
- Equity multiple
- 0.48×
- Total profit
- $-32,949
- Equity at exit
- $33,548
- IRR
- -0.9%
- Equity multiple
- 0.93×
- Total profit
- $-4,492
- Equity at exit
- $19,454
Cash invested: $63,000 (down + closing). Projections, not guarantees.
Landlord ↔ Tenant lean methodology
- Overall (CITY)
- 12 Strongly Tenant-Friendly
- State Maryland
- 27 Tenant-Leaning · D+14
- County
- — inherits STATE
- City Baltimore
- 12 Strongly Tenant-Friendly · D+58
ZIP-level market 21216
- Rents YoY
- 6.1%
- Active inventory
- 252
- Price-to-rent
- 9.5×
Monthly cashflow live
- Estimated rent
- $1,967 high interval (Pro) →
- Mortgage (P&I)
- −$1,180
- Tax from tax record
- −$325 /mo · $3,906/yr
- Insurance
- −$94
- HOA
- −$0
- Vacancy / Maint / Mgmt
- −$413
- Net cashflow
- $-45
Break-even live
Sensitivity live
| Price | -10% $82 | -5% $19 | +0% $-45 | +5% $-109 | +10% $-172 |
|---|---|---|---|---|---|
| Rent | -10% $-201 | -5% $-123 | +0% $-45 | +5% $33 | +10% $110 |
| Rate | -1.0pp $68 | -0.5pp $12 | base $-45 | +0.5pp $-103 | +1.0pp $-163 |
UW: 25.0% down · 7.5% · 30yr · 1.5% tax · 5.0% vac · 8.0% maint · 8.0% mgmt
Financing live
Cash to close
- Down payment
- $56,250
- Closing costs
- $6,750
- Reserves months
- —
- Total cash needed
- —
Loan-product check · same deal, 3 products live
Conventional
25% down · 7.5% · 30yr
- Down + closing
- —
- Monthly P&I
- —
- Monthly cashflow
- —
- DSCR
- —
- Eligible?
- —
Personal DTI + credit; lowest rate.
DSCR
20% down · 8.5% · 30yr
- Down + closing
- —
- Monthly P&I
- —
- Monthly cashflow
- —
- DSCR
- —
- Eligible?
- —
No personal income docs; deal must DSCR.
Hard money
10% down · 12.0% · 12mo
- Down + closing
- —
- Monthly P&I
- —
- Monthly cashflow
- —
- DSCR
- —
- Eligible?
- —
Short-term bridge; refi at stabilization.
Rent comps 29 comps
| Address | Beds | Baths | Sqft | Rent | $/sqft | DOM | Units | Dist |
|---|---|---|---|---|---|---|---|---|
| 3904 Gwynns Falls Pkwy Baltimore, MD | 3.0 | 2.0 | 1772 | $2,600 | $1.47 | 45d | 1 | 0.34mi |
| 2103 Chelsea Ter Unit 2 Baltimore, MD | 3.0 | 1.5 | 1500 | $2,100 | $1.40 | 16d | 1 | 0.55mi |
| 2742 N Rosedale St Baltimore, MD | 3.0 | 1.0 | 1024 | $1,350 | $1.32 | 45d | 2 | 0.84mi |
| 3028 Hanlon Ave Baltimore, MD | 3.0 | 2.0 | 1200 | $1,711 | $1.43 | 25d | 1 | 0.88mi |
| 3001 Carlisle Ave Baltimore, MD | 3.0 | 1.0 | 1024 | $1,300 | $1.27 | 45d | 1 | 0.89mi |
| 2738 N Longwood St Baltimore, MD | 3.0 | 1.0 | 1024 | $1,399 | $1.37 | 45d | 1 | 0.90mi |
| 5006 Windsor Mill Rd Baltimore, MD | 1.0–3.0 | 1.0–2.0 | 776 | $1,869 | $2.41 | 0d | 18 | 1.00mi |
| 4998 W Forest Park Ave Baltimore, MD | 3.0 | 1.0–2.0 | 790 | $1,875 | $2.37 | 16d | 15 | 1.13mi |
| 2917 Clifton Ave Baltimore, MD | 4.0 | 4.0 | 1700 | $2,150 | $1.26 | 25d | 1 | 1.15mi |
| 3309 Brighton St Baltimore, MD | 3.0 | 1.0 | 1134 | $1,700 | $1.50 | 45d | 1 | 1.16mi |
| 4113 Mountwood Rd Baltimore, MD | 3.0 | 1.0 | 1520 | $1,795 | $1.18 | 45d | 1 | 1.20mi |
| 3127 Baker St Baltimore, MD | 3.0 | 1.0 | 1000 | $1,300 | $1.30 | 45d | 1 | 1.21mi |
| 3601 Howard Park Ave Unit 2 Baltimore, MD | 3.0 | 1.0 | 1000 | $1,650 | $1.65 | 45d | 1 | 1.21mi |
| 4103 Mountwood Rd Baltimore, MD | 3.0 | 2.0 | 1030 | $1,700 | $1.65 | 45d | 1 | 1.21mi |
| 2812 Clifton Ave Baltimore, MD | 3.0 | 1.5 | 1650 | $1,850 | $1.12 | 45d | 1 | 1.22mi |
| 1216 N Augusta Ave Baltimore, MD | 3.0 | 1.0 | 1024 | $1,550 | $1.51 | 25d | 1 | 1.23mi |
| 5136 Oaklawn Rd Gwynn Oak, MD | 1.0–3.0 | 1.0 | 896 | $1,715 | $1.91 | 0d | 21 | 1.23mi |
| 1513 N Ellamont St Baltimore, MD | 3.0 | 1.0 | 1700 | $1,700 | $1.00 | 25d | 1 | 1.24mi |
| 3204 Sequoia Ave Baltimore, MD | 4.0 | 2.5 | 1791 | $2,600 | $1.45 | 45d | 1 | 1.24mi |
| 1530 N Rosedale St Baltimore, MD | 3.0 | 2.0 | 1641 | $1,795 | $1.09 | 0d | 1 | 1.25mi |
| 5215 Muth Ave Gwynn Oak, MD | 3.0 | 3.0 | 1205 | $2,700 | $2.24 | 16d | 1 | 1.36mi |
| 3727 Milford Ave Gwynn Oak, MD | 3.0 | 1.0 | 900 | $1,450 | $1.61 | 45d | 1 | 1.36mi |
| 3238 Westmont Ave Baltimore, MD | 3.0 | 1.0 | 1280 | $1,600 | $1.25 | 45d | 1 | 1.41mi |
| 917 Kevin Rd Baltimore, MD | 3.0 | 2.0 | 1151 | $1,795 | $1.56 | 4d | 1 | 1.42mi |
| 4037 Cedardale Rd Baltimore, MD | 5.0 | 3.0 | 1500 | $2,800 | $1.87 | 16d | 1 | 1.42mi |
| 3104 Tioga Pkwy Baltimore, MD | 3.0 | 2.0 | 1640 | $2,050 | $1.25 | 23d | 1 | 1.44mi |
| 1402 Poplar Grove St Baltimore, MD | 4.0 | 1.5 | 1540 | $800 | $0.52 | 45d | 1 | 1.47mi |
| 2636 W North Ave Baltimore, MD | 2.0–3.0 | 1.0–2.0 | 975 | $1,475 | $1.51 | 6d | 1 | 1.47mi |
| 2800 Presstman St Baltimore, MD | 3.0 | 2.5 | 1460 | $1,799 | $1.23 | 25d | 1 | 1.49mi |
Listing history 49 events
-
2026-06-04status $225,000 Pending 19 DOM
-
2026-05-18historical $2,450
-
2026-05-12historical Active Under Contract 1004-char remark
-
2026-04-29$2,450
-
2026-04-28historical $2,450
-
2026-04-23$225,000 Active 1004-char remark
-
2026-04-17$2,450
-
2025-11-19historical $2,450
-
2025-10-31historical
-
2025-10-19$2,450
-
2025-09-27historical $2,250
-
2025-08-27$2,250
-
2025-08-12historical $2,250
-
2025-08-01status Active
-
2025-07-31historical
-
2025-07-12$2,250
-
2025-07-08price $219,900
-
2025-06-24historical $2,450
-
2025-05-27price $229,900
-
2025-05-23$2,450
-
2025-04-14price $249,900
-
2025-04-04price $259,900
-
2025-03-19price $274,900
-
2025-03-01$299,900 Active
-
2025-02-02historical
-
2018-02-28soldstatus $112,900
-
2018-02-19historical
Show marketing remark (422 chars)
Beautifully updated semi-detached home featuring modern-day style & amenities! 3 fully-finished levels give you all the space you need! Open floorplan with hardwood floors & tons of natural light make this one not to be missed. Enjoy bright and spacious kitchen with breakfast bar & dining room. All this plus spacious lower level family room & spacious backyard - perfect for family fun! Must see!
-
2018-02-13soldstatus $112,900
Show marketing remark (422 chars)
Beautifully updated semi-detached home featuring modern-day style & amenities! 3 fully-finished levels give you all the space you need! Open floorplan with hardwood floors & tons of natural light make this one not to be missed. Enjoy bright and spacious kitchen with breakfast bar & dining room. All this plus spacious lower level family room & spacious backyard - perfect for family fun! Must see!
-
2018-02-13soldstatus $112,900 Sold
Show marketing remark (422 chars)
Beautifully updated semi-detached home featuring modern-day style & amenities! 3 fully-finished levels give you all the space you need! Open floorplan with hardwood floors & tons of natural light make this one not to be missed. Enjoy bright and spacious kitchen with breakfast bar & dining room. All this plus spacious lower level family room & spacious backyard - perfect for family fun! Must see!
-
2017-12-27status Contingent (No Kick Out)
-
2017-12-22price $119,900
-
2017-11-29price $125,000
-
2017-11-09$130,000 Active
Show marketing remark (422 chars)
Beautifully updated semi-detached home featuring modern-day style & amenities! 3 fully-finished levels give you all the space you need! Open floorplan with hardwood floors & tons of natural light make this one not to be missed. Enjoy bright and spacious kitchen with breakfast bar & dining room. All this plus spacious lower level family room & spacious backyard - perfect for family fun! Must see!
-
2017-11-09$119,900
Show marketing remark (422 chars)
Beautifully updated semi-detached home featuring modern-day style & amenities! 3 fully-finished levels give you all the space you need! Open floorplan with hardwood floors & tons of natural light make this one not to be missed. Enjoy bright and spacious kitchen with breakfast bar & dining room. All this plus spacious lower level family room & spacious backyard - perfect for family fun! Must see!
-
2017-09-05historical
-
2017-09-05historical Withdrawn
-
2017-08-28status Active
-
2017-08-07historical Temporarily Off-Market
-
2017-07-18price
-
2017-04-25status Active
-
2017-04-17$115,000
-
2017-04-17historical
-
2017-04-17
-
1998-05-19soldstatus $69,900
-
1998-05-19soldstatus $69,900
-
1998-01-20soldstatus $69,900
-
1997-11-20historical
-
1997-08-29$69,000
-
1986-06-24soldstatus $52,000
ⓘ Source: listings_history table (triggers on properties + properties_extension) + one-shot
backfill from property_details.listing_events for pre-trigger history.
Tax reassessment forecast MD · Partial reset (capped growth)
- Current annual tax
- $3,906 · $325/mo
- Projected year-2 tax
- $3,906 · $325/mo
- Expected delta
- $0/yr ($0/mo · 0.0%)
ⓘ Screening estimate from a state-policy table — verify with the county assessor before closing.
Climate risk First Street
- Flood 4/10 Moderate FEMA zone X (unshaded) · 24% chance over 30 yrs
- Wildfire 1/10 Low
- Heat 6/10 Major 7 d/yr ≥103°F today · 15 d/yr by 30 yrs out
- Wind 5/10 Major 26% chance of damaging wind over 30 yrs
- Air quality 3/10 Moderate 3 unhealthy d/yr today · 4 by 30 yrs out
Nearby sold comps map
Loading sold comps map…
Walkable amenities ~0.75 mi
Loading nearby amenities…
Taxation est. · year 1
- Rental income
- $23,606
- − Mortgage interest
- −$12,603
- − Property taxes
- −$3,906
- − Insurance
- −$1,125
- − Repairs & maintenance
- −$1,888
- − Management
- −$1,888
- − Depreciation
- −$6,545
- Taxable loss
- −$4,351
- Est. tax savings @ 24.0%
- +$1,044
- After-tax cash flow
- $503/yr
For passive investors: Depreciation is non-cash, so a rental often shows a tax loss while cash-flowing — sheltering income. Rental losses are passive: they offset passive income freely, and up to $25,000/yr can offset ordinary (W-2) income if you actively participate and your MAGI is under $100k (phasing out to $0 by $150k); unused losses carry forward. On sale, claimed depreciation is recaptured at up to 25%, and gains may owe capital-gains tax (a 1031 exchange can defer both). Figures are a year-1 estimate at your 24.0% rate — not tax advice; consult a CPA.
Schools (NCES district)
- District
- Baltimore City Public Schools
- NCES district ID
- 2400090
- Math proficiency
- 7% ▼ -9.00%
- Reading proficiency
- 16% ▼ -5.00%
- Median HH income
- $42,108
- Composite
- 10.08/100
- National rank
- #9805
- State rank
- #24 of 24 in MD
Livability — Baltimore
- Score
- 76/100
- State rank
- #90
- US rank
- #3396
Category grades
Schools grade is shown separately in the Schools card above.
Census & demographics
- Census place
- Baltimore, MD
- County
- Baltimore City · 558,601 people
- City population
- 588,727
- Metro
- Baltimore-Columbia-Towson, MD
- Population (ZIP)
- 29,426
- Household income
- $42,031
- Rent vs Own
- Severe rent burden
- 2264.0
Population outlook (Baltimore County) Hauer SSP2
- Today (2025)
- 624,249 people
- By 2030
- 621,541 · -0.4%
- By 2040
- 609,756 · -2.3%
- By 2050
- 597,249 · -4.3%
- By 2075
- 552,236 · -11.5%
- By 2100
- 513,934 · -17.7%
Race, ethnicity, and origin ACS 2023
- Neighborhood character
- Predominantly Black (91%)
- Race & ethnicity
- Black 91% Hispanic / Latino 4% Two or more races 3% White 2%
- Foreign-born
- 3% · Canada
- Languages at home
- 96% English-only · Spanish 3% French/Haitian/Cajun 1%
Political lean MEDSL · Baltimore
- 2024 margin
- Solid D (+73.0) · D 85.2% · R 12.2% · Other 2.6%
- 2008→2024 swing
- -2.5pp toward R · 2008: 75.5pp · 2024: 73.0pp
- All cycles
- 2024: D+73.0 2020: D+76.6 2016: D+74.6 2012: D+76.4 2008: D+75.5
Not yet ingested
- Civics
- —
Market trends
- HPI YoY
- ▼ -107.42%
- Current HPI
- 164.3933
- Rent YoY
- ▲ 6.10%
- Metro
- Baltimore-Columbia-Towson, MD
- State GDP YoY
- ▲ 2.97%
- F500 in state
- 12
Industry mix (Fortune 500 HQ in MD)
| Industry | F500 HQs | Revenue |
|---|---|---|
| Aerospace / Defense | 1 | $71B |
|
||
| Utilities | 1 | $25B |
|
||
| Hotels | 1 | $24B |
|
||
| Consumer Goods | 1 | $7B |
|
||
| Real Estate | 1 | $6B |
|
||
| Chemicals | 1 | $2B |
|
||
Price history
+332.7% since first listed50 events — show timeline
- 2026-06-12 Sold (MLS) $225,000 BRIGHT MLS
- 2026-06-04 Pending — BRIGHT MLS
- 2026-05-18 Rental Removed $2,450 TURBOTENANT
- 2026-05-12 Contingent — BRIGHT MLS
- 2026-04-29 Listed for Rent $2,450 TURBOTENANT
- 2026-04-28 Rental Removed $2,450 TURBOTENANT
- 2026-04-23 Listed $225,000 BRIGHT MLS
- 2026-04-17 Listed for Rent $2,450 TURBOTENANT
- 2025-11-19 Rental Removed $2,450 TURBOTENANT
- 2025-10-31 Listing Removed — BRIGHT MLS
- 2025-10-19 Listed for Rent $2,450 TURBOTENANT
- 2025-09-27 Rental Removed $2,250 TURBOTENANT
- 2025-08-27 Listed for Rent $2,250 TURBOTENANT
- 2025-08-12 Rental Removed $2,250 TURBOTENANT
- 2025-08-01 Relisted — BRIGHT MLS
- 2025-07-31 Listing Removed — BRIGHT MLS
- 2025-07-12 Listed for Rent $2,250 TURBOTENANT
- 2025-07-08 Price Changed $219,900 BRIGHT MLS
- 2025-06-24 Rental Removed $2,450 TURBOTENANT
- 2025-05-27 Price Changed $229,900 BRIGHT MLS
- 2025-05-23 Listed for Rent $2,450 TURBOTENANT
- 2025-04-14 Price Changed $249,900 BRIGHT MLS
- 2025-04-04 Price Changed $259,900 BRIGHT MLS
- 2025-03-19 Price Changed $274,900 BRIGHT MLS
- 2025-03-01 Listed $299,900 BRIGHT MLS
- 2025-02-02 Coming Soon — BRIGHT MLS
- 2018-02-28 Sold (Public Records) $112,900 Public Records
- 2018-02-19 Listing Removed — BRIGHT MLS
- 2018-02-13 Sold (MLS) $112,900 MRIS
- 2018-02-13 Sold (MLS) $112,900 BRIGHT MLS
- 2017-12-27 Pending — MRIS
- 2017-12-22 Price Changed $119,900 MRIS
- 2017-11-29 Price Changed $125,000 MRIS
- 2017-11-09 Listed $130,000 MRIS
- 2017-11-09 Listed $119,900 BRIGHT MLS
- 2017-09-05 Listing Removed — BRIGHT MLS
- 2017-09-05 Delisted — MRIS
- 2017-08-28 Relisted — MRIS
- 2017-08-07 Delisted — MRIS
- 2017-07-18 Price Changed — MRIS
- 2017-04-25 Relisted — MRIS
- 2017-04-17 Listed $115,000 BRIGHT MLS
- 2017-04-17 Listed — MRIS
- 2017-04-17 Delisted — MRIS
- 1998-05-19 Sold (Public Records) $69,900 Public Records
- 1998-05-19 Sold (Public Records) $69,900 Public Records
- 1998-01-20 Sold (MLS) $69,900 MRIS
- 1997-11-20 Delisted — MRIS
- 1997-08-29 Listed $69,000 MRIS
- 1986-06-24 Sold (Public Records) $52,000 Public Records
Property tax history
+3.0%/yrLatest (2025): $3,906 · +4.7% YoY. Source: county tax records.
Cash-flow waterfall
monthlySold comps — $/sqft
last 12 mo · ≤1 miLoading sold comps…