 Multi-family
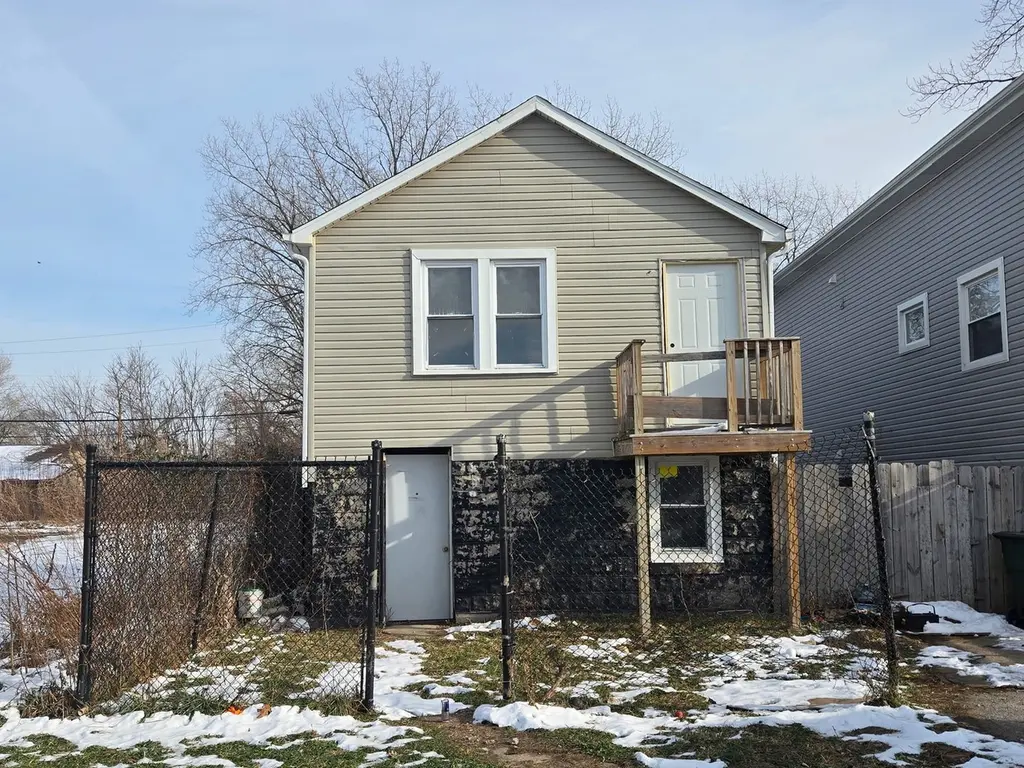
13719 S Spaulding Ave · Robbins, IL
Flood risk 6/10 · Moderate
- FEMA flood zone
- X (unshaded)
- Chance of flooding over 30 yrs
- 0.96%
- Est. flood insurance / yr
- $473 – $860
Fire risk 1/10 · Minimal
- Est. fire insurance / yr
- $804 – $1,492
Heat risk 3/10 · Minor
- Hot days now (above 102°F)
- 7 days/yr
- Hot days in 30 yrs
- 14 days/yr
Wind risk 2/10 · Minimal
- Chance of severe wind over 30 yrs
- —
Air-quality risk 3/10 · Minor
- Unhealthy air days now
- 4 days/yr
- Unhealthy air days in 30 yrs
- 4 days/yr
Risk factors via First Street. Map © Google.
Why this score? — see what drove the B+ grade
The composite is a weighted blend of 9 inputs, each scored 0–100. Each bar is that input's sub-score; the figure is the points it added to the 100-point composite (weight × sub-score).
- Cash flow +30.0/30.0
- 1% rule +10.0/10.0
- DSCR +10.0/10.0
- Appreciation +10.0/10.0
- ARV discount +7.5/15.0
- Livability +3.3/5.0
- Rent growth +2.5/5.0
- Condition / age +2.5/5.0
- Schools +1.6/10.0
$50,000
🖨 Deal sheet 📄 Offer letter ✓ Due diligence
Multi-family units
County records classify this as Multi-Family (2-4 Unit). Listing-text estimate: 1 unit. estimate disagrees with records
Listing remarks MLS
This property needs a full gut rehab. However, the current owner installed new siding, soffit, fascia, gutters and roof. This is a cash only sale. This property is in Flood Zone X but flood insurance is not required in Flood Zone X. This is an as-is, where-is sale.
Key facts
- New siding
- New gutters
- New soffit
Tags
Neighborhood map
What this means for you Summary
Snapshot
- This is a 3-bed/2.0-bath multifamily listed at $50k.
Deal economics
- At list price, monthly cash flow is $1k ($15k/yr) — positive.
- The deal already cash-flows at list — no discount required.
- Meets the 1% rule at list price ($2k rent vs $50k).
- Recommended offer: $44k (12.0% below list) — sets the bar for market timing.
Location & tenants
- Location reads 66/100 on livability (#583 in IL) — a middle-class / working-renter tenant base. Strengths: commute A+, cost of living A+, housing A+; Watch: crime D+, schools F, amenities F.
- Chsd 218 (suburban): math 14% / reading 20% proficiency, ranked #454 of 620 in IL (top 73%) — low school quality limits family demand, transient renter base, plan for 1-2y turnover.
- Market conditions: 28 active listings in the ZIP; 11 comparable units currently listed for rent nearby; rentals leasing fast (median 2d on market — plan ~1-2 weeks tenant-placement turnaround); 6,272 units permitted in Cook County in 2024 (4,658 in 5+ unit buildings).
Forward outlook
- In year one you build about $5k of equity ($346 loan paydown + $5k appreciation (10.0% local appreciation)).
- At projected returns (10.0% appreciation + 3.0% rent growth), your $14k cash investment doubles in ~1 year — after that, you're playing with house money.
- By year 6, paydown + projected appreciation supports a ~$31k cash-out refi (75% LTV) — recoverable capital for the next deal without selling this one.
Negotiation context
- It's been on market 185 days — a 12% lower offer ($44k) is reasonable based on typical stale-listing flexibility.
- 5 sale attempts since 8y ago with the ask held roughly flat each time — persistent listings suggest the price (not the market) is what's stuck; bring a comps-based counter.
- Current owner paid $24k; list at $50k implies a 108% gain — meaningful room to come down on a strong offer.
Risks & watch-outs
- Watch-outs: built in 1938 — expect roof / HVAC / electrical / plumbing capex.
- Climate carrying-cost: major flood risk — expect insurance premiums to compound above CPI over the hold.
Questions for the listing agent
- It's been on market 185 days. Have you received any prior offers? Is the seller open to a 12% concession, seller financing, or rate buy-down credit?
- Built in 1938 — when were the roof, HVAC, electrical panel, plumbing, and water heater last replaced?
- Why hasn't it sold? Are there any deal-killer items the seller is aware of (foundation, flood, title, zoning, code violations)?
- Is there a deadline driving the sale (1031 exchange, divorce, estate, relocation)? That informs how much negotiation room exists.
- Schools are F-rated, which usually means shorter tenancies and higher turnover. Who's the typical renter profile here, and what's been the actual vacancy rate?
- Crime grade is D in this area — have there been break-ins, vandalism, or insurance claims at this property in the last 3 years? What carrier currently insures it and at what premium?
- What's the average days-on-market for RENTAL listings here right now (not sales)? A rising rental-DOM trend means longer vacancies and softer asking-rent achievability than the comps imply.
- What's the recent tenant-quality profile in this submarket — average credit score on applications, eviction rate, late-payment / NSF rate, and stable-employment percentage? A property-management company in the area should have these aggregated.
- How much new apartment / multifamily construction is in the pipeline within 1–3 miles? Heavy new supply (>2% of stock underway) typically softens rents 12–24 months out; light construction supports rent growth.
Investment metrics
- 1% rule
- 4.00% ✓
- Cap rate
- 35.88%
- Cash-on-cash
- 105.67%
- DSCR
- 5.70
- GRM
- 2.1
CMA / ARV
- ARV (median comp)
- $146,509
- List price
- $50,000
- Delta
- -65.87%
- Verdict
- UNDERPRICED
- Comps
- 20 within 1.0 mi
Projected returns pro-forma
10.0% appreciation · 3.0% rent growth · sell at horizon
- IRR
- —
- Equity multiple
- 8.56×
- Total profit
- $105,782
- Equity at exit
- $45,044
- IRR
- —
- Equity multiple
- 18.84×
- Total profit
- $249,822
- Equity at exit
- $97,139
Cash invested: $14,000 (down + closing). Projections, not guarantees.
Landlord ↔ Tenant lean methodology
- Overall (STATE)
- 43 Moderately Tenant-Leaning
- State Illinois
- 43 Moderately Tenant-Leaning · D+7
- County
- — inherits STATE
- City
- — inherits STATE
ZIP-level market 60472
- Home prices YoY
- 3.5%
- Active inventory
- 28
- Price-to-rent
- 2.1×
Monthly cashflow live
- Estimated rent
- $1,998 high interval (Pro) →
- Mortgage (P&I)
- −$262
- Tax est. 1.5%
- −$62 /mo · $750/yr
- Insurance
- −$21
- HOA
- −$0
- Vacancy / Maint / Mgmt
- −$420
- Net cashflow
- $1,233
Break-even live
UW: 25.0% down · 7.5% · 30yr · 1.5% tax · 5.0% vac · 8.0% maint · 8.0% mgmt
Financing live
Cash to close
- Down payment
- $12,500
- Closing costs
- $1,500
- Reserves months
- —
- Total cash needed
- —
Loan-product check · same deal, 3 products live
Conventional
25% down · 7.5% · 30yr
- Down + closing
- —
- Monthly P&I
- —
- Monthly cashflow
- —
- DSCR
- —
- Eligible?
- —
Personal DTI + credit; lowest rate.
DSCR
20% down · 8.5% · 30yr
- Down + closing
- —
- Monthly P&I
- —
- Monthly cashflow
- —
- DSCR
- —
- Eligible?
- —
No personal income docs; deal must DSCR.
Hard money
10% down · 12.0% · 12mo
- Down + closing
- —
- Monthly P&I
- —
- Monthly cashflow
- —
- DSCR
- —
- Eligible?
- —
Short-term bridge; refi at stabilization.
Rent comps 11 comps
| Address | Beds | Baths | Sqft | Rent | $/sqft | DOM | Units | Dist |
|---|---|---|---|---|---|---|---|---|
| 13906 Central Park Ave Unit 2N Robbins, IL | 3.0 | 2.0 | 900 | $2,200 | $2.44 | 1d | 1 | 0.49mi |
| 3025 140th St Blue Island, IL | 4.0 | 1.0 | 1144 | $2,000 | $1.75 | 1d | 1 | 0.49mi |
| 3028 141st St Blue Island, IL | 4.0 | 1.0 | 1144 | $1,911 | $1.67 | 1d | 1 | 0.57mi |
| 13443 Greenwood Ave Unit 2E Blue Island, IL | 2.0 | 1.0 | 1200 | $1,550 | $1.29 | 1d | 1 | 1.04mi |
| 14336 S Harrison Ave Posen, IL | 4.0 | 3.0 | 1707 | $2,600 | $1.52 | 1d | 1 | 1.06mi |
| 2640 Vermont St Unit 1 Blue Island, IL | 3.0 | 1.5 | 1500 | $2,200 | $1.47 | 1d | 1 | 1.10mi |
| 13308 Old Western Ave Unit 2 Blue Island, IL | 3.0 | 1.5 | 1350 | $2,200 | $1.63 | 11d | 1 | 1.13mi |
| 13308 Old Western Ave Unit 2 Blue Island, IL | 3.0 | 1.5 | 1350 | $2,200 | $1.63 | 22d | 1 | 1.13mi |
| 2119 135th Pl Unit 4 Blue Island, IL | 2.0 | 1.0 | 900 | $1,250 | $1.39 | 8d | 1 | 1.45mi |
| 2119 135th Pl Blue Island, IL | 2.0 | 1.0 | 900 | $1,250 | $1.39 | 4d | 1 | 1.45mi |
| 12710 Elm St Unit 2B Blue Island, IL | 3.0 | 2.0 | 900 | $1,850 | $2.06 | 1d | 1 | 1.47mi |
Listing history 30 events
-
2026-06-18days on market $50,000 Active 185 DOM
-
2026-06-17days on market $50,000 Active 184 DOM
-
2026-06-16days on market $50,000 Active 183 DOM
-
2026-06-15days on market $50,000 Active 182 DOM
-
2026-06-13days on market $50,000 Active 180 DOM
-
2026-06-09days on market $50,000 Active 176 DOM
-
2026-06-08days on market $50,000 Active 175 DOM
-
2026-06-07days on market $50,000 Active 174 DOM
-
2026-06-04days on market $50,000 Active 171 DOM
-
2026-06-03days on market $50,000 Active 170 DOM
-
2026-06-02days on market $50,000 Active 169 DOM
-
2026-06-01days on market $50,000 Active 168 DOM
-
2026-05-31days on market $50,000 Active 167 DOM
-
2025-12-15$50,000 Active 269-char remark
Show marketing remark (269 chars)
This property needs a full gut rehab. However, the current owner installed new siding, soffit, fascia, gutters and roof. This is a cash only sale. This property is in Flood Zone X but flood insurance is not required in Flood Zone X. This is an as-is, where-is sale.
-
2021-07-26soldstatus $24,000
-
2021-07-14status Active Under Contract 165-char remark
Show marketing remark (165 chars)
Investors come and look at this fixer-upper gem with NEW construction next door!!! Price is discounted for a quick sale - cash offers and quick closes are preferred.
-
2021-07-12soldstatus $24,000 Closed 165-char remark
Show marketing remark (165 chars)
Investors come and look at this fixer-upper gem with NEW construction next door!!! Price is discounted for a quick sale - cash offers and quick closes are preferred.
-
2021-05-18status Contingent 165-char remark
Show marketing remark (165 chars)
Investors come and look at this fixer-upper gem with NEW construction next door!!! Price is discounted for a quick sale - cash offers and quick closes are preferred.
-
2021-03-01$25,000 New 165-char remark
Show marketing remark (165 chars)
Investors come and look at this fixer-upper gem with NEW construction next door!!! Price is discounted for a quick sale - cash offers and quick closes are preferred.
-
2021-03-01historical
Show marketing remark (165 chars)
Investors come and look at this fixer-upper gem with NEW construction next door!!! Price is discounted for a quick sale - cash offers and quick closes are preferred.
-
2021-01-23price
-
2020-12-01price
-
2020-11-18price
-
2020-11-12price
-
2020-11-07New
-
2020-11-07historical
-
2020-11-07New
-
2018-05-08historical
-
2018-04-27
-
1997-12-10soldstatus $66,000
ⓘ Source: listings_history table (triggers on properties + properties_extension) + one-shot
backfill from property_details.listing_events for pre-trigger history.
Climate risk First Street
- Flood 6/10 Major FEMA zone X (unshaded) · 96% chance over 30 yrs
- Wildfire 1/10 Low
- Heat 3/10 Moderate 7 d/yr ≥102°F today · 14 d/yr by 30 yrs out
- Wind 2/10 Low
- Air quality 3/10 Moderate 4 unhealthy d/yr today · 4 by 30 yrs out
Nearby sold comps map
Loading sold comps map…
Walkable amenities ~0.75 mi
Loading nearby amenities…
Taxation est. · year 1
- Rental income
- $23,975
- − Mortgage interest
- −$2,801
- − Property taxes
- −$750
- − Insurance
- −$250
- − Repairs & maintenance
- −$1,918
- − Management
- −$1,918
- − Depreciation
- −$1,455
- Taxable income
- $14,884
- Est. tax owed @ 24.0%
- −$3,572
- After-tax cash flow
- $11,222/yr
For passive investors: Depreciation is non-cash, so a rental often shows a tax loss while cash-flowing — sheltering income. Rental losses are passive: they offset passive income freely, and up to $25,000/yr can offset ordinary (W-2) income if you actively participate and your MAGI is under $100k (phasing out to $0 by $150k); unused losses carry forward. On sale, claimed depreciation is recaptured at up to 25%, and gains may owe capital-gains tax (a 1031 exchange can defer both). Figures are a year-1 estimate at your 24.0% rate — not tax advice; consult a CPA.
Schools (NCES district)
- District
- Chsd 218
- NCES district ID
- 1706540
- Math proficiency
- 14% ▼ -4.00%
- Reading proficiency
- 20% ▼ -1.00%
- Median HH income
- $57,166
- Composite
- 16.09/100
- National rank
- #9235
- State rank
- #454 of 620 in IL
Livability — Robbins
- Score
- 66/100
- State rank
- #583
- US rank
- #12161
Category grades
Schools grade is shown separately in the Schools card above.
Census & demographics
- Census place
- Robbins, IL
- City population
- 4,961
- Population (ZIP)
- 4,961
Population outlook (Cook County) Hauer SSP2
- Today (2025)
- 5,347,519 people
- By 2030
- 5,357,703 · +0.2%
- By 2040
- 5,324,924 · -0.4%
- By 2050
- 5,230,762 · -2.2%
- By 2075
- 4,785,735 · -10.5%
- By 2100
- 4,188,836 · -21.7%
Race, ethnicity, and origin ACS 2023
- Neighborhood character
- Predominantly Black (85%)
- Race & ethnicity
- Black 85% Hispanic / Latino 9% White 4% Two or more races 3%
- Hispanic origin (detail)
- Mexican 8%
- Common ancestry
- Hispanic 4%
- Foreign-born
- 4% · Canada
- Languages at home
- 92% English-only · Spanish 7%
Political lean MEDSL · Cook
- 2024 margin
- Solid D (+42.0) · D 70.4% · R 28.4% · Other 1.2%
- 2008→2024 swing
- -11.4pp toward R · 2008: 53.4pp · 2024: 42.0pp
- All cycles
- 2024: D+42.0 2020: D+50.3 2016: D+53.0 2012: D+49.4 2008: D+53.4
Not yet ingested
- Civics
- —
Market trends
- HPI YoY
- ▲ 16.74%
- Current HPI
- 494.1622
- Rent YoY
- —
- Metro
- —
- State GDP YoY
- ▲ 1.59%
- F500 in state
- 60
Industry mix (Fortune 500 HQ in IL)
| Industry | F500 HQs | Revenue |
|---|---|---|
| Insurance | 4 | $201B |
|
||
| Consumer Goods | 4 | $87B |
|
||
| Industrial Machinery | 3 | $64B |
|
||
| Healthcare | 2 | $55B |
|
||
| Retail / Pharmacy | 1 | $148B |
|
||
| Agriculture / Food | 1 | $86B |
|
||
Price history
-24.2% since first listed17 events — show timeline
- 2025-12-15 Listed $50,000 MRED as Distributed by MLS Grid
- 2021-07-26 Sold (Public Records) $24,000 Public Records
- 2021-07-14 Pending — MRED as Distributed by MLS Grid
- 2021-07-12 Sold (MLS) $24,000 MRED as Distributed by MLS Grid
- 2021-05-18 Pending — MRED as Distributed by MLS Grid
- 2021-03-01 Listing Removed — MRED as Distributed by MLS Grid
- 2021-03-01 Listed $25,000 MRED as Distributed by MLS Grid
- 2021-01-23 Price Changed — MRED as Distributed by MLS Grid
- 2020-12-01 Price Changed — MRED as Distributed by MLS Grid
- 2020-11-18 Price Changed — MRED as Distributed by MLS Grid
- 2020-11-12 Price Changed — MRED as Distributed by MLS Grid
- 2020-11-07 Listed — MRED as Distributed by MLS Grid
- 2020-11-07 Listing Removed — MRED as Distributed by MLS Grid
- 2020-11-07 Listed — MRED as Distributed by MLS Grid
- 2018-05-08 Listing Removed — MRED as Distributed by MLS Grid
- 2018-04-27 Listed — MRED as Distributed by MLS Grid
- 1997-12-10 Sold (Public Records) $66,000 Public Records
Property tax history
+5.9%/yrLatest (2023): $4,053 · -19.3% YoY. Source: county tax records.
Cash-flow waterfall
monthlySold comps — $/sqft
last 12 mo · ≤1 miLoading sold comps…